![]()
Search Market Research Report
Cogeneration Equipment Market Size, Share Global Analysis Report, 2020–2026

Cogeneration Equipment Market By Technology (Steam Turbine, Gas Turbine, Combined Cycle Gas Turbine, Reciprocating engine, and Others), By Capacity (Upto 30 MW, 31MW – 60 MW, and 61 MW – 100 MW), By Fuel Type (Biomass, Coal, Natural Gas, and Others), and By Application (Industrial, Residential, and Commercial), and By Region: Global Industry Outlook, Market Size, Business Intelligence, Consumer Preferences, Statistical Surveys, Comprehensive Analysis, Historical Developments, Current Trends, and Forecast 2020–2026
Industry Insights
This specialized and expertise oriented industry research report scrutinizes the technical and commercial business outlook of the Cogeneration Equipment industry. The report analyzes and declares the historical and current trends analysis of the Cogeneration Equipment industry and subsequently recommends the projected trends anticipated to be observed in the global Cogeneration Equipment market during the upcoming years.
The global Cogeneration Equipment market report analyzes and notifies the industry statistics at the global as well as regional and country levels in order to acquire a thorough perspective of the entire Cogeneration Equipment market. The historical and past insights are provided for FY 2016 to FY 2019 whereas projected trends are delivered for FY 2020 to FY 2026. The quantitative and numerical data is represented in terms of value (USD Million) from FY 2016 – 2026.
The quantitative data is further underlined and reinforced by comprehensive qualitative data which comprises various across-the-board market dynamics. The rationales which directly or indirectly impact the Cogeneration Equipment industry are exemplified through parameters such as growth drivers, restraints, challenges, and opportunities among other impacting factors.
Throughout our research report, we have encompassed all the proven models and tools of industry analysis and extensively illustrated all the key business strategies and business models adopted in the Cogeneration Equipment industry. The report provides an all-inclusive and detailed competitive landscape prevalent in the global Cogeneration Equipment market.
The report utilizes established industry analysis tools and models such as Porter’s Five Forces framework to analyze and recognize critical business strategies adopted by various stakeholders involved in the entire value chain of the Cogeneration Equipment industry. The global Cogeneration Equipment market report additionally employs SWOT analysis and PESTLE analysis models for further in-depth analysis.
The report study further includes an in-depth analysis of industry players' market shares and provides an overview of leading players' market position in the Cogeneration Equipment sector. Key strategic developments in the global Cogeneration Equipment market competitive landscape such as acquisitions & mergers, inaugurations of different products and services, partnerships & joint ventures, MoU agreements, VC & funding activities, R&D activities, and geographic expansion among other noteworthy activities by key players of the global Cogeneration Equipment market are appropriately highlighted in the report.
Cogeneration is also known as combined heat and power (CHP) systems. These systems help generate both electricity and heat from a single fuel source, including natural gas, biomass, waste heat, wood, and coal. Cogeneration systems work with almost 77–81% efficiency compared to the46% efficiency of traditional systems. These systems help lower carbon emissions by almost 29%.
The increasing demand for productive power generation techniques to meet up to the increasing requirement for electricity across the globe is the major factor propelling the expansion of the global Cogeneration Equipment market. Apart from this, the decrease in fossil fuels has encouraged the adoption of alternative techniques such as cogeneration. Furthermore, the stringent government regulations for energy-saving and curbing climatic changes have urged to use cogeneration equipment to generate power, thus augmenting the Cogeneration Equipment market. The numerous renewable energy projects coupled with the high availability of natural gas across the world are supplementing the development of the Cogeneration Equipment market. In addition to this, the low prices of natural gas, favorable government policies, and old infrastructure are expected to fuel the Cogeneration Equipment demand in the coming years. However, the high initial investments and requisites for sophisticated technological are likely to have a negative impact on the cogeneration equipment market.
 Report Scope
Report Attribute |
Details |
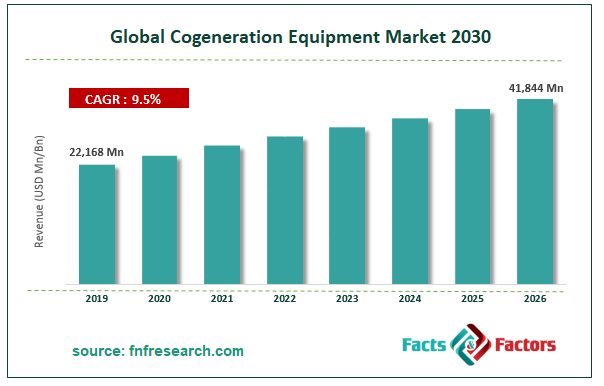
Market Size in 2019 |
USD 22,168 Million |
Projected Market Size in 2026 |
USD 41,844 Million |
CAGR Growth Rate |
9.5% CAGR |
Base Year |
2019 |
Forecast Years |
2020-2026 |
Key Market Players |
Alstorm Power, American DG Energy Inc., Cidea Uno Inc., Turner Crane, Allied Equipments Inc., Mitsubishi Heavy Industries Ltd., Caterpillar Inc., Baxi Group, GE Energy, Siemens AG, Almeg Controls, Solar Turbines Inc., US Green Energy Ltd., Rolls Royce PLC., Perry Process Equipment Ltd., and Others |
Key Segment |
By Capacity, Fuel, Technology, Application, and Region |
Major Regions Covered |
North America, Europe, Asia Pacific, Latin America, and the Middle East & Africa |
Purchase Options |
Request customized purchase options to meet your research needs. Explore purchase options |
The global Cogeneration Equipment market research report delivers an acute valuation and taxonomy of the Cogeneration Equipment industry by practically splitting the market on the basis of different technology, capacity, fuel type, applications, and regions. Through the analysis of the historical and projected trends, all the segments and sub-segments were evaluated through the bottom-up approach, and different market sizes have been projected for FY 2020 to FY 2026. The regional segmentation of the Cogeneration Equipment industry includes the complete classification of all the major continents including North America, Latin America, Europe, Asia Pacific, and Middle East & Africa. Further, country-wise data for the Cogeneration Equipment industry is provided for the leading economies of the world.
The global Cogeneration Equipment market is segmented based on Technology, Capacity, Fuel Type, and Application. On the basis of technology, the global Cogeneration Equipment market is divided intoSteam Turbine, Gas Turbine, Combined Cycle Gas Turbine, Reciprocating engine, and Others. Based on capacity, the market is segregated into Up to 30 MW, 31MW – 60 MW, and 61 MW – 100 MW. In terms of fuel type, the market for Cogeneration Equipment is sectored into Biomass, Coal, Natural Gas, and Others. By application, the market is categorized into Industrial, Residential, and Commercial.
Some of the essential players operating in the global Cogeneration Equipment market, but not restricted to include
- Alstorm Power
- American DG Energy Inc.
- Cidea Uno Inc.
- Turner Crane
- Allied Equipments Inc.
- Mitsubishi Heavy Industries Ltd.
- Caterpillar Inc.
- Baxi Group
- GE Energy
- Siemens AG
- Almeg Controls
- Solar Turbines Inc.
- US Green Energy Ltd.
- Rolls Royce PLC.
- Perry Process Equipment Ltd.
The taxonomy of the Cogeneration Equipment industry by its scope and segmentation is as follows:
By Capacity
- Upto 30 MW
- 31MW – 60 MW
- 61 MW – 100 MW
By Fuel
- Biomass
- Coal
- Natural Gas
- Others
By Technology
- Steam Turbine
- Gas Turbine
- Combined Cycle Gas Turbine
- Reciprocating engine
- Others
By Application
- Industrial
- Residential
- Commercial
Regional Segmentation Analysis
- North America
- The U.S.
- Canada
- Europe
- Germany
- The UK
- France
- Spain
- Italy
- Rest of Europe
- Asia Pacific
- China
- Japan
- India
- South Korea
- Southeast Asia
- Rest of Asia Pacific
- Latin America
- Brazil
- Mexico
- Rest of Latin America
- Middle East & Africa
- GCC
- South Africa
- Rest of Middle East & Africa
Table of Content
Industry Major Market Players
- Alstorm Power
- American DG Energy Inc.
- Cidea Uno Inc.
- Turner Crane
- Allied Equipments Inc.
- Mitsubishi Heavy Industries Ltd.
- Caterpillar Inc.
- Baxi Group
- GE Energy
- Siemens AG
- Almeg Controls
- Solar Turbines Inc.
- US Green Energy Ltd.
- Rolls Royce PLC.
- Perry Process Equipment Ltd.


Copyright © 2025 - 2026, All Rights Reserved, Facts and Factors