Search Market Research Report

Discover Our Latest Reports
Discover Our Featured Reports
Discover Top Selling Reports

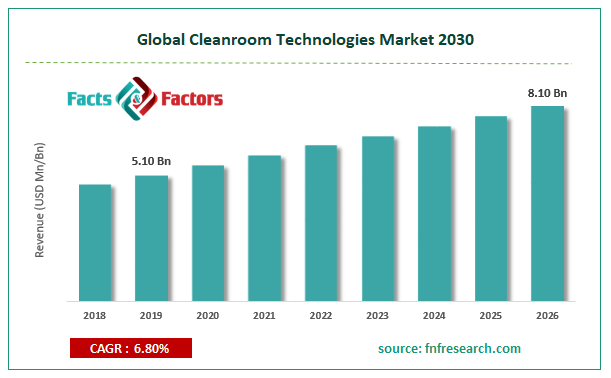
Cleanroom Technologies Market Size, Share Global Analysis Report, 2020–2026

report img

Cleanroom Technologies Market By Product (Equipment, Consumables, and Controls), By Construction Type (Drywall/Standard Cleanrooms, Hardwall Cleanrooms, Softwall Cleanrooms, and Pass-Through Cabinets), By End-User (Pharmaceutical Industry, Biotechnology Industry, Medical Device Manufacturers, Hospitals, and Others), and By Region: Global Industry Outlook, Market Size, Business Intelligence, Consumer Preferences, Statistical Surveys, Comprehensive Analysis, Historical Developments, Current Trends, and Forecast 2020–2026

Industry Insights

This specialized and expertise oriented industry research report scrutinizes the technical and commercial business outlook of the Cleanroom Technologies industry. The report analyzes and declares the historical and current trends analysis of the Cleanroom Technologies industry and subsequently recommends the projected trends anticipated to be observed in the Cleanroom Technologies market during the upcoming years.

Global Cleanroom Technologies Market Size

To know more about this report | Request Free Sample Copy

The Cleanroom Technologies market report analyzes and notifies the industry statistics at the global as well as regional and country levels in order to acquire a thorough perspective of the entire Cleanroom Technologies market. The historical and past insights are provided for FY 2016 to FY 2019 whereas projected trends are delivered for FY 2020 to FY 2026. The quantitative and numerical data is represented in terms of value (USD Billion) from FY 2016 – 2026.

The quantitative data is further underlined and reinforced by comprehensive qualitative data which comprises various across-the-board market dynamics. The rationales which directly or indirectly impact the Cleanroom Technologies industry are exemplified through parameters such as growth drivers, restraints, challenges, and opportunities among other impacting factors.

Throughout our research report, we have encompassed all the proven models and tools of industry analysis and extensively illustrated all the key business strategies and business models adopted in the Cleanroom Technologies industry. The report provides an all-inclusive and detailed competitive landscape prevalent in the Cleanroom Technologies market.

The report utilizes established industry analysis tools and models such as Porter’s Five Forces framework to analyze and recognize critical business strategies adopted by various stakeholders involved in the entire value chain of the Cleanroom Technologies industry. The Cleanroom Technologies market report additionally employs SWOT analysis and PESTLE analysis models for further in-depth analysis.

The report study further includes an in-depth analysis of industry players' market shares and provides an overview of leading players' market position in the Cleanroom Technologies sector. Key strategic developments in the Cleanroom Technologies market competitive landscape such as acquisitions & mergers, inaugurations of different products and services, partnerships & joint ventures, MoU agreements, VC & funding activities, R&D activities, and geographic expansion among other noteworthy activities by key players of the Cleanroom Technologies market are appropriately highlighted in the report.

A cleanroom is a facility basically utilized in case of scientific research ore any specialized industrial production which includes production of CRT, integrated circuits, OLED, LCD, microLED displays, and pharmaceutical items. In a cleanroom, the environment is controlled and kept free of pollutants such as airborne microorganisms, dirt, aerosol particles, and chemical vapors.

The primary reasons expected to boost the global Cleanroom Technologies market is the strict government rules and regulations and also the development taking place in the biologics sector. In addition to this, the rising demand for sterilized pharmaceutical formulations along with the immense technological advancements in the cleanroom technology is expected to boost the growth of the Cleanroom Technology market during the forecast period. Furthermore, the growing requirement for medical equipment in hospitals, clinics, homes, etc. is also likely to supplement the global Cleanroom Technology market expansion. Apart from this, the mounting number of R&D activities in the healthcare sector is also attributing to the growth of the Cleanroom Technologies market. The increasing spending on healthcare increasing along with the rising demand for maintaining high quality while manufacturing healthcare products are anticipated to further propel the growth of the global Cleanroom Technologies market.

The Cleanroom Technologies market research report delivers an acute valuation and taxonomy of the Cleanroom Technologiesindustry by practically splitting the market on the basis of different Product, Construction Type, End-User, and regions. Through the analysis of the historical and projected trends, all the segments and sub-segments were evaluated through the bottom-up approach, and different market sizes have been projected for FY 2020 to FY 2026. The regional segmentation of the Cleanroom Technologiesindustry includes the complete classification of all the major continents including North America, Latin America, Europe, Asia Pacific, and Middle East & Africa. Further, country-wise data for the Cleanroom Technologies industry is provided for the leading economies of the world.

The Cleanroom Technologies market is segmented based on Product, Construction Type, and End-User. On the basis of product, the global Cardiac Safety Services are segregated into Equipment, Consumables, and Controls. By construction type, the market for cardiac safety services is divided into drywall/Standard Cleanrooms, Hardwall Cleanrooms, Softwall Cleanrooms, and Pass-Through Cabinets. Based on the end-user,  the market is sectored into Pharmaceutical Industry, Biotechnology Industry, Medical Device Manufacturers, Hospitals, and Others.

logoReport Scope

Report Attribute

Details

Market Size in 2019

USD 5.10 Billion

Projected Market Size in 2026

USD 8.10 Billion

CAGR Growth Rate

6.8% CAGR

Base Year

2019

Forecast Years

2020-2026

Key Market Players

Kimberly-Clark Corporation, Azbil Corporation, Ardmac, Clean Air Products, Labconco Corporation, Exyte AG, Dynarex Corporation, Airtech Japan, Ltd., DowDuPont Inc., Illinois Tool Works Inc., Taikisha Ltd., ABN Cleanroom Technology, COLANDIS GmbH, Clean Rooms International, Inc., Terra Universal, Inc., Bouygues Group, Connect 2 Cleanrooms Ltd., OCTANORM-Vertriebs-GmbH, Camfil, and Parteco Srl.

Key Segment

By Product, By Construction Type, By End-User, and By Region

Major Regions Covered

North America, Europe, Asia Pacific, Latin America, and the Middle East & Africa

Purchase Options

Request customized purchase options to meet your research needs. Explore purchase options

logoSome of the essential players operating in the Cleanroom Technologies market, but not restricted to include

  • Kimberly-Clark Corporation
  • Azbil Corporation
  • Ardmac
  • Clean Air Products
  • Labconco Corporation
  • Exyte AG
  • Dynarex Corporation
  • Airtech Japan Ltd.
  • DowDuPont Inc.
  • Illinois Tool Works Inc.
  • Taikisha Ltd.
  • ABN Cleanroom Technology
  • COLANDIS GmbH
  • Clean Rooms International Inc.
  • Terra Universal Inc.
  • Bouygues Group
  • Connect 2 Cleanrooms Ltd.
  • OCTANORM-Vertriebs-GmbH
  • Camfil
  • Parteco Srl.

The taxonomy of the Cleanroom Technologies Market by its scope and segmentation is as follows:

logo Product Segmentation Analysis

  • Equipment
    • HVAC Systems
    • HEPA Filters
    • Fan Filter Units
    • Laminar Air Flow Systems & Biosafety Cabinets
    • Air Diffusers and Showers
    • Others
  • Consumables
    • Safety Consumables
    • Cleaning Consumables
  • Controls

logo Construction Type Segmentation Analysis

  • Standard/Drywall Cleanrooms
  • Hardwall Cleanrooms
  • Softwall Cleanrooms
  • Pass-through Cabinets

logo End User Segmentation Analysis

  • Pharmaceutical Industry
  • Biotechnology Industry
  • Medical Device Manufacturers
  • Hospitals
  • Others

logo Regional Segmentation Analysis

  • North America
    • The U.S.
    • Canada
  • Europe
    • Germany
    • The UK
    • France
    • Spain
    • Italy
    • Rest of Europe
  • Asia Pacific
    • China
    • Japan
    • India
    • South Korea
    • Southeast Asia
    • Rest of Asia Pacific
  • Latin America
    • Brazil
    • Mexico
    • Rest of Latin America
  • Middle East & Africa
    • GCC
    • South Africa
    • Rest of Middle East & Africa

Table of Content

  1. CHAPTER 1. Executive Summary
  2. CHAPTER 2. Cleanroom Technologies market – Product Analysis
    1. 2.1. Global Cleanroom Technologies Market – Product Overview
    2. 2.2. Global Cleanroom Technologies Market Share, by Product, 2018 & 2025 (USD Billion)
    3. 2.3. Equipment
      1. 2.3.1. Global Equipment Cleanroom Technologies Market, 2016-2026 (USD Billion)
    4. 2.4. Consumables
      1. 2.4.1. Global Consumables Cleanroom Technologies Market, 2016-2026 (USD Billion)
    5. 2.5. Controls
      1. 2.5.1. Global Controls Cleanroom Technologies Market, 2016-2026 (USD Billion)
  3. CHAPTER 3. Cleanroom Technologies market – Construction Type Analysis
    1. 3.1. Global Cleanroom Technologies Market – Construction Type Overview
    2. 3.2. Global Cleanroom Technologies Market Share, by Construction Type, 2018 & 2025 (USD Billion)
    3. 3.3. Drywall/Standard Cleanrooms
      1. 3.3.1. Global Drywall/Standard Cleanrooms Cleanroom Technologies Market, 2016-2026 (USD Billion)
    4. 3.4. Hardwall Cleanrooms
      1. 3.4.1. Global Hardwall Cleanrooms Cleanroom Technologies Market, 2016-2026 (USD Billion)
    5. 3.5. Softwall Cleanrooms
      1. 3.5.1. Global Softwall Cleanrooms Cleanroom Technologies Market, 2016-2026 (USD Billion)
    6. 3.6. Pass-Through Cabinets
      1. 3.6.1. Global Pass-Through Cabinets Cleanroom Technologies Market, 2016-2026 (USD Billion)
  4. CHAPTER 4. Cleanroom Technologies market – End-User Analysis
    1. 4.1. Global Cleanroom Technologies Market – End-User Overview
    2. 4.2. Global Cleanroom Technologies Market Share, by End-User, 2018 & 2025 (USD Billion)
    3. 4.3. Pharmaceutical Industry
      1. 4.3.1. Global Pharmaceutical Industry Cleanroom Technologies Market, 2016-2026 (USD Billion)
    4. 4.4. Biotechnology Industry
      1. 4.4.1. Global Biotechnology Industry Cleanroom Technologies Market, 2016-2026 (USD Billion)
    5. 4.5. Medical Device Manufacturers
      1. 4.5.1. Global Medical Device Manufacturers Cleanroom Technologies Market, 2016-2026 (USD Billion)
    6. 4.6. Hospitals
      1. 4.6.1. Global Hospitals Cleanroom Technologies Market, 2016-2026 (USD Billion)
    7. 4.7. Others
      1. 4.7.1. Global Others Cleanroom Technologies Market, 2016-2026 (USD Billion)
  5. CHAPTER 5. Cleanroom Technologies market – Regional Analysis
    1. 5.1. Global Cleanroom Technologies Market Regional Overview
    2. 5.2. Global Cleanroom Technologies Market Share, by Region, 2018 & 2025 (Value)
    3. 5.3. North America
      1. 5.3.1. North America Cleanroom Technologies Market size and forecast, 2016-2026
      2. 5.3.2. North America Cleanroom Technologies Market, by Country, 2018 & 2025 (USD Billion)
      3. 5.3.3. North America Cleanroom Technologies Market, by Product, 2016-2026
        1. 5.3.3.1. North America Cleanroom Technologies Market, by Product, 2016-2026 (USD Billion)
      4. 5.3.4. North America Cleanroom Technologies Market, by Construction Type, 2016-2026
        1. 5.3.4.1. North America Cleanroom Technologies Market, by Construction Type, 2016-2026 (USD Billion)
      5. 5.3.5. North America Cleanroom Technologies Market, by End-User, 2016-2026
        1. 5.3.5.1. North America Cleanroom Technologies Market, by End-User, 2016-2026 (USD Billion)
      6. 5.3.6. U.S.
        1. 5.3.6.1. U.S. Market size and forecast, 2016-2026 (USD Billion)
      7. 5.3.7. Canada
        1. 5.3.7.1. Canada Market size and forecast, 2016-2026 (USD Billion)
    4. 5.4. Europe
      1. 5.4.1. Europe Cleanroom Technologies Market size and forecast, 2016-2026
      2. 5.4.2. Europe Cleanroom Technologies Market, by Country, 2018 & 2025 (USD Billion)
      3. 5.4.3. Europe Cleanroom Technologies Market, by Product, 2016-2026
        1. 5.4.3.1. Europe Cleanroom Technologies Market, by Product, 2016-2026 (USD Billion)
      4. 5.4.4. Europe Cleanroom Technologies Market, by Construction Type, 2016-2026
        1. 5.4.4.1. Europe Cleanroom Technologies Market, by Construction Type, 2016-2026 (USD Billion)
      5. 5.4.5. Europe Cleanroom Technologies Market, by End-User, 2016-2026
        1. 5.4.5.1. Europe Cleanroom Technologies Market, by End-User, 2016-2026 (USD Billion)
      6. 5.4.6. Germany
        1. 5.4.6.1. Germany Market size and forecast, 2016-2026 (USD Billion)
      7. 5.4.7. France
        1. 5.4.7.1. France Market size and forecast, 2016-2026 (USD Billion)
      8. 5.4.8. U.K.
        1. 5.4.8.1. U.K. Market size and forecast, 2016-2026 (USD Billion)
      9. 5.4.9. Italy
        1. 5.4.9.1. Italy Market size and forecast, 2016-2026 (USD Billion)
      10. 5.4.10. Spain
        1. 5.4.10.1. Spain Market size and forecast, 2016-2026 (USD Billion)
      11. 5.4.11. Rest of Europe
        1. 5.4.11.1. Rest of Europe Market size and forecast, 2016-2026 (USD Billion)
    5. 5.5. Asia Pacific
      1. 5.5.1. Asia Pacific Cleanroom Technologies Market size and forecast, 2016-2026
      2. 5.5.2. Asia Pacific Cleanroom Technologies Market, by Country, 2018 & 2025 (USD Billion)
      3. 5.5.3. Asia Pacific Cleanroom Technologies Market, by Product, 2016-2026
        1. 5.5.3.1. Asia Pacific Cleanroom Technologies Market, by Product, 2016-2026 (USD Billion)
      4. 5.5.4. Asia Pacific Cleanroom Technologies Market, by Construction Type, 2016-2026
        1. 5.5.4.1. Asia Pacific Cleanroom Technologies Market, by Construction Type, 2016-2026 (USD Billion)
      5. 5.5.5. Asia Pacific Cleanroom Technologies Market, by End-User, 2016-2026
        1. 5.5.5.1. Asia Pacific Cleanroom Technologies Market, by End-User, 2016-2026 (USD Billion)
      6. 5.5.6. China
        1. 5.5.6.1. China Market size and forecast, 2016-2026 (USD Billion)
      7. 5.5.7. Japan
        1. 5.5.7.1. Japan Market size and forecast, 2016-2026 (USD Billion)
      8. 5.5.8. India
        1. 5.5.8.1. India Market size and forecast, 2016-2026 (USD Billion)
      9. 5.5.9. South Korea
        1. 5.5.9.1. South Korea Market size and forecast, 2016-2026 (USD Billion)
      10. 5.5.10. South-East Asia
        1. 5.5.10.1. South-East Asia Market size and forecast, 2016-2026 (USD Billion)
      11. 5.5.11. Rest of Asia Pacific
        1. 5.5.11.1. Rest of Asia Pacific Market size and forecast, 2016-2026 (USD Billion)
    6. 5.6. Latin America
      1. 5.6.1. Latin America Cleanroom Technologies Market size and forecast, 2016-2026
      2. 5.6.2. Latin America Cleanroom Technologies Market, by Country, 2018 & 2025 (USD Billion)
      3. 5.6.3. Latin America Cleanroom Technologies Market, by Product, 2016-2026
        1. 5.6.3.1. Latin America Cleanroom Technologies Market, by Product, 2016-2026 (USD Billion)
      4. 5.6.4. Latin America Cleanroom Technologies Market, by Construction Type, 2016-2026
        1. 5.6.4.1. Latin America Cleanroom Technologies Market, by Construction Type, 2016-2026 (USD Billion)
      5. 5.6.5. Latin America Cleanroom Technologies Market, by End-User, 2016-2026
        1. 5.6.5.1. Latin America Cleanroom Technologies Market, by End-User, 2016-2026 (USD Billion)
      6. 5.6.6. Brazil
        1. 5.6.6.1. Brazil Market size and forecast, 2016-2026 (USD Billion)
      7. 5.6.7. Mexico
        1. 5.6.7.1. Mexico Market size and forecast, 2016-2026 (USD Billion)
      8. 5.6.8. Rest of Latin America
        1. 5.6.8.1. Rest of Latin America Market size and forecast, 2016-2026 (USD Billion)
    7. 5.7. The Middle-East and Africa
      1. 5.7.1. The Middle-East and Africa Cleanroom Technologies Market size and forecast, 2016-2026
      2. 5.7.2. The Middle-East and Africa Cleanroom Technologies Market, by Country, 2018 & 2025 (USD Billion)
      3. 5.7.3. The Middle-East and Africa Cleanroom Technologies Market, by Product, 2016-2026
        1. 5.7.3.1. The Middle-East and Africa Cleanroom Technologies Market, by Product, 2016-2026 (USD Billion)
      4. 5.7.4. The Middle-East and Africa Cleanroom Technologies Market, by Construction Type, 2016-2026
        1. 5.7.4.1. The Middle-East and Africa Cleanroom Technologies Market, by Construction Type, 2016-2026 (USD Billion)
      5. 5.7.5. The Middle-East and Africa Cleanroom Technologies Market, by End-User, 2016-2026
        1. 5.7.5.1. The Middle-East and Africa Cleanroom Technologies Market, by End-User, 2016-2026 (USD Billion)
      6. 5.7.6. GCC Countries
        1. 5.7.6.1. GCC Countries Market size and forecast, 2016-2026 (USD Billion)
      7. 5.7.7. South Africa
        1. 5.7.7.1. South Africa Market size and forecast, 2016-2026 (USD Billion)
      8. 5.7.8. Rest of Middle-East Africa
        1. 5.7.8.1. Rest of Middle-East Africa Market size and forecast, 2016-2026 (USD Billion)
  6. CHAPTER 6. Cleanroom Technologies market – Competitive Landscape
    1. 6.1. Competitor Market Share – Revenue
    2. 6.2. Market Concentration Rate Analysis, Top 3 and Top 5 Players
    3. 6.3. Strategic Development
      1. 6.3.1. Acquisitions and Mergers
      2. 6.3.2. New Products
      3. 6.3.3. Research & Development Activities
  7. CHAPTER 7. Company Profiles
    1. 7.1. Kimberly-Clark Corporation
      1. 7.1.1. Company Overview
      2. 7.1.2. Kimberly-Clark Corporation Revenue and Gross Margin
      3. 7.1.3. Product portfolio
      4. 7.1.4. Recent initiatives
    2. 7.2. Azbil Corporation
      1. 7.2.1. Company Overview
      2. 7.2.2. Azbil Corporation Revenue and Gross Margin
      3. 7.2.3. Product portfolio
      4. 7.2.4. Recent initiatives
    3. 7.3. Ardmac
      1. 7.3.1. Company Overview
      2. 7.3.2. Ardmac Revenue and Gross Margin
      3. 7.3.3. Product portfolio
      4. 7.3.4. Recent initiatives
    4. 7.4. Clean Air Products
      1. 7.4.1. Company Overview
      2. 7.4.2. Clean Air Products Revenue and Gross Margin
      3. 7.4.3. Product portfolio
      4. 7.4.4. Recent initiatives
    5. 7.5. Labconco Corporation
      1. 7.5.1. Company Overview
      2. 7.5.2. Labconco Corporation Revenue and Gross Margin
      3. 7.5.3. Product portfolio
      4. 7.5.4. Recent initiatives
    6. 7.6. Exyte AG
      1. 7.6.1. Company Overview
      2. 7.6.2. Exyte AG Revenue and Gross Margin
      3. 7.6.3. Product portfolio
      4. 7.6.4. Recent initiatives
    7. 7.7. Dynarex Corporation
      1. 7.7.1. Company Overview
      2. 7.7.2. Dynarex Corporation Revenue and Gross Margin
      3. 7.7.3. Product portfolio
      4. 7.7.4. Recent initiatives
    8. 7.8. Airtech Japan Ltd.
      1. 7.8.1. Company Overview
      2. 7.8.2. Airtech Japan Ltd. Revenue and Gross Margin
      3. 7.8.3. Product portfolio
      4. 7.8.4. Recent initiatives
    9. 7.9. DowDuPont Inc.
      1. 7.9.1. Company Overview
      2. 7.9.2. DowDuPont Inc. Revenue and Gross Margin
      3. 7.9.3. Product portfolio
      4. 7.9.4. Recent initiatives
    10. 7.10. Illinois Tool Works Inc.
      1. 7.10.1. Company Overview
      2. 7.10.2. Illinois Tool Works Inc. Revenue and Gross Margin
      3. 7.10.3. Product portfolio
      4. 7.10.4. Recent initiatives
    11. 7.11. Taikisha Ltd.
      1. 7.11.1. Company Overview
      2. 7.11.2. Taikisha Ltd. Revenue and Gross Margin
      3. 7.11.3. Product portfolio
      4. 7.11.4. Recent initiatives
    12. 7.12. ABN Cleanroom Technology
      1. 7.12.1. Company Overview
      2. 7.12.2. ABN Cleanroom Technology Revenue and Gross Margin
      3. 7.12.3. Product portfolio
      4. 7.12.4. Recent initiatives
    13. 7.13. COLANDIS GmbH
      1. 7.13.1. Company Overview
      2. 7.13.2. COLANDIS GmbH Revenue and Gross Margin
      3. 7.13.3. Product portfolio
      4. 7.13.4. Recent initiatives
    14. 7.14. Clean Rooms International Inc.
      1. 7.14.1. Company Overview
      2. 7.14.2. Clean Rooms International Inc. Revenue and Gross Margin
      3. 7.14.3. Product portfolio
      4. 7.14.4. Recent initiatives
    15. 7.15. Terra Universal Inc.
      1. 7.15.1. Company Overview
      2. 7.15.2. Terra Universal Inc. Revenue and Gross Margin
      3. 7.15.3. Product portfolio
      4. 7.15.4. Recent initiatives
    16. 7.16. Bouygues Group
      1. 7.16.1. Company Overview
      2. 7.16.2. Bouygues Group Revenue and Gross Margin
      3. 7.16.3. Product portfolio
      4. 7.16.4. Recent initiatives
    17. 7.17. Connect 2 Cleanrooms Ltd.
      1. 7.17.1. Company Overview
      2. 7.17.2. Connect 2 Cleanrooms Ltd. Revenue and Gross Margin
      3. 7.17.3. Product portfolio
      4. 7.17.4. Recent initiatives
    18. 7.18. OCTANORM-Vertriebs-GmbH
      1. 7.18.1. Company Overview
      2. 7.18.2. OCTANORM-Vertriebs-GmbH Revenue and Gross Margin
      3. 7.18.3. Product portfolio
      4. 7.18.4. Recent initiatives
    19. 7.19. Camfil
      1. 7.19.1. Company Overview
      2. 7.19.2. Camfil Revenue and Gross Margin
      3. 7.19.3. Product portfolio
      4. 7.19.4. Recent initiatives
    20. 7.20. Parteco Srl.
      1. 7.20.1. Company Overview
      2. 7.20.2. Parteco Srl. Revenue and Gross Margin
      3. 7.20.3. Product portfolio
      4. 7.20.4. Recent initiatives
  8. CHAPTER 8. Cleanroom Technologies — Industry Analysis
    1. 8.1. Cleanroom Technologies Market – Key Trends
      1. 8.1.1. Market Drivers
      2. 8.1.2. Market Restraints
      3. 8.1.3. Market Opportunities
    2. 8.2. Value Chain Analysis
    3. 8.3. Technology Roadmap and Timeline
    4. 8.4. Cleanroom Technologies Market – Attractiveness Analysis
      1. 8.4.1. By Product
      2. 8.4.2. By Construction Type
      3. 8.4.3. By End-User
      4. 8.4.4. By Region
  9. CHAPTER 9. Marketing Strategy Analysis, Distributors
    1. 9.1. Marketing Channel
    2. 9.2. Direct Marketing
    3. 9.3. Indirect Marketing
    4. 9.4. Marketing Channel Development Trend
    5. 9.5. Economic/Political Environmental Change
  10. CHAPTER 10. Report Conclusion
  11. CHAPTER 11. Research Approach & Methodology
    1. 11.1. Report Description
    2. 11.2. Research Scope
    3. 11.3. Research Methodology
      1. 11.3.1. Secondary Research
      2. 11.3.2. Primary Research
      3. 11.3.3. Models
        1. 11.3.3.1. Company Share Analysis Model
        2. 11.3.3.2. Revenue Based Modeling
        3. 11.3.3.3. Research Limitations

        List of Figures

        FIG. 1 Global Cleanroom Technologies Market, 2016-2026 (USD Billion)
        FIG. 2 Global Cleanroom Technologies Market Share, by Product, 2018 & 2025 (USD Billion)
        FIG. 3 Global Equipment Cleanroom Technologies Market, 2016-2026 (USD Billion)
        FIG. 4 Global Consumables Cleanroom Technologies Market, 2016-2026 (USD Billion)
        FIG. 5 Global Controls Cleanroom Technologies Market, 2016-2026 (USD Billion)
        FIG. 6 Global Cleanroom Technologies Market Share, by Construction Type, 2018 & 2025 (USD Billion)
        FIG. 7 Global Drywall/Standard Cleanrooms Cleanroom Technologies Market, 2016-2026 (USD Billion)
        FIG. 8 Global Hardwall Cleanrooms Cleanroom Technologies Market, 2016-2026 (USD Billion)
        FIG. 9 Global Softwall Cleanrooms Cleanroom Technologies Market, 2016-2026 (USD Billion)
        FIG. 10 Global Pass-Through Cabinets Cleanroom Technologies Market, 2016-2026 (USD Billion)
        FIG. 11 Global Cleanroom Technologies Market Share, by End-User, 2018 & 2025 (USD Billion)
        FIG. 12 Global Pharmaceutical Industry Cleanroom Technologies Market, 2016-2026 (USD Billion)
        FIG. 13 Global Biotechnology Industry Cleanroom Technologies Market, 2016-2026 (USD Billion)
        FIG. 14 Global Medical Device Manufacturers Cleanroom Technologies Market, 2016-2026 (USD Billion)
        FIG. 15 Global Hospitals Cleanroom Technologies Market, 2016-2026 (USD Billion)
        FIG. 16 Global Others Cleanroom Technologies Market, 2016-2026 (USD Billion)
        FIG. 17 Global Cleanroom Technologies Market Share, by Region, 2018 & 2025
        FIG. 18 North America Cleanroom Technologies Market, 2016-2026
        FIG. 19 U.S. Cleanroom Technologies Market, 2016-2026
        FIG. 20 Canada Cleanroom Technologies Market, 2016-2026
        FIG. 21 Europe Cleanroom Technologies Market, 2016-2026
        FIG. 22 Germany Cleanroom Technologies Market, 2016-2026
        FIG. 23 France Cleanroom Technologies Market, 2016-2026
        FIG. 24 U.K. Cleanroom Technologies Market, 2016-2026
        FIG. 25 Italy Cleanroom Technologies Market, 2016-2026
        FIG. 26 Spain Cleanroom Technologies Market, 2016-2026
        FIG. 27 Rest of Europe Cleanroom Technologies Market, 2016-2026
        FIG. 28 Asia Pacific Cleanroom Technologies Market, 2016-2026
        FIG. 29 China Cleanroom Technologies Market, 2016-2026
        FIG. 30 Japan Cleanroom Technologies Market, 2016-2026
        FIG. 31 India Cleanroom Technologies Market, 2016-2026
        FIG. 32 South  Korea Cleanroom Technologies Market, 2016-2026
        FIG. 33 South-East Asia Cleanroom Technologies Market, 2016-2026
        FIG. 34 Rest of Asia Pacific Cleanroom Technologies Market, 2016-2026
        FIG. 35 Latin America Cleanroom Technologies Market, 2016-2026
        FIG. 36 Brazil Cleanroom Technologies Market, 2016-2026
        FIG. 37 Mexico Cleanroom Technologies Market, 2016-2026
        FIG. 38 Rest of Latin America Cleanroom Technologies Market, 2016-2026
        FIG. 39 The Middle-East and Africa Cleanroom Technologies Market, 2016-2026
        FIG. 40 GCC Countries Cleanroom Technologies Market, 2016-2026
        FIG. 41 South Africa Cleanroom Technologies Market, 2016-2026
        FIG. 42 Rest of Middle-East Africa Cleanroom Technologies Market, 2016-2026
        FIG. 43 Competitor Market Share – Revenue
        FIG. 44 Kimberly-Clark Corporation Revenue and Growth Rate
        FIG. 45 Kimberly-Clark Corporation Market Share
        FIG. 46 Azbil Corporation Revenue and Growth Rate
        FIG. 47 Azbil Corporation Market Share
        FIG. 48 Ardmac Revenue and Growth Rate
        FIG. 49 Ardmac Market Share
        FIG. 50 Clean Air Products Revenue and Growth Rate
        FIG. 51 Clean Air Products Market Share
        FIG. 52 Labconco Corporation Revenue and Growth Rate
        FIG. 53 Labconco Corporation Market Share
        FIG. 54 Exyte AG Revenue and Growth Rate
        FIG. 55 Exyte AG Market Share
        FIG. 56 Dynarex Corporation Revenue and Growth Rate
        FIG. 57 Dynarex Corporation Market Share
        FIG. 58 Airtech Japan Ltd. Revenue and Growth Rate
        FIG. 59 Airtech Japan Ltd. Market Share
        FIG. 60 DowDuPont Inc. Revenue and Growth Rate
        FIG. 61 DowDuPont Inc. Market Share
        FIG. 62 Illinois Tool Works Inc. Revenue and Growth Rate
        FIG. 63 Illinois Tool Works Inc. Market Share
        FIG. 64 Taikisha Ltd. Revenue and Growth Rate
        FIG. 65 Taikisha Ltd. Market Share
        FIG. 66 ABN Cleanroom Technology Revenue and Growth Rate
        FIG. 67 ABN Cleanroom Technology Market Share
        FIG. 68 COLANDIS GmbH Revenue and Growth Rate
        FIG. 69 COLANDIS GmbH Market Share
        FIG. 70 Clean Rooms International Inc. Revenue and Growth Rate
        FIG. 71 Clean Rooms International Inc. Market Share
        FIG. 72 Terra Universal Inc. Revenue and Growth Rate
        FIG. 73 Terra Universal Inc. Market Share
        FIG. 74 Bouygues Group Revenue and Growth Rate
        FIG. 75 Bouygues Group Market Share
        FIG. 76 Connect 2 Cleanrooms Ltd. Revenue and Growth Rate
        FIG. 77 Connect 2 Cleanrooms Ltd. Market Share
        FIG. 78 OCTANORM-Vertriebs-GmbH Revenue and Growth Rate
        FIG. 79 OCTANORM-Vertriebs-GmbH Market Share
        FIG. 80 Camfil Revenue and Growth Rate
        FIG. 81 Camfil Market Share
        FIG. 82 Parteco Srl. Revenue and Growth Rate
        FIG. 83 Parteco Srl. Market Share
        FIG. 84 Market Dynamics
        FIG. 85 Global Cleanroom Technologies – Value Chain Analysis
        FIG. 86 Technology Roadmap and Timeline
        FIG. 87 Market Attractiveness Analysis – By Product
        FIG. 88 Market Attractiveness Analysis – By Construction Type
        FIG. 89 Market Attractiveness Analysis – By End-User
        FIG. 90 Market Attractiveness Analysis – By Region
        FIG. 91 Market Channel
        FIG. 92 Marketing Channel Development Trend
        FIG. 93 Growth in World Gross Product, 2008-2018

        List of Tables

        TABLE 1 Global Cleanroom Technologies Market, 2018 & 2025 (USD Billion)
        TABLE 2 Global Cleanroom Technologies market, by Product, 2016-2026 (USD Billion)
        TABLE 3 Global Cleanroom Technologies market, by Construction Type, 2016-2026 (USD Billion)
        TABLE 4 Global Cleanroom Technologies market, by End-User, 2016-2026 (USD Billion)
        TABLE 5 Global Cleanroom Technologies market, by Region, 2016-2026 (USD Billion)
        TABLE 6 North America Cleanroom Technologies Market, by Product, 2016-2026 (USD Billion)
        TABLE 7 North America Cleanroom Technologies Market, by Construction Type, 2016-2026 (USD Billion)
        TABLE 8 North America Cleanroom Technologies Market, by End-User, 2016-2026 (USD Billion)
        TABLE 9 Europe Cleanroom Technologies Market, by Product, 2016-2026 (USD Billion)
        TABLE 10 Europe Cleanroom Technologies Market, by Construction Type, 2016-2026 (USD Billion)
        TABLE 11 Europe Cleanroom Technologies Market, by End-User, 2016-2026 (USD Billion)
        TABLE 12 Asia Pacific Cleanroom Technologies Market, by Product, 2016-2026 (USD Billion)
        TABLE 13 Asia Pacific Cleanroom Technologies Market, by Construction Type, 2016-2026 (USD Billion)
        TABLE 14 Asia Pacific Cleanroom Technologies Market, by End-User, 2016-2026 (USD Billion)
        TABLE 15 Latin America Cleanroom Technologies Market, by Product, 2016-2026 (USD Billion)
        TABLE 16 Latin America Cleanroom Technologies Market, by Construction Type, 2016-2026 (USD Billion)
        TABLE 17 Latin America Cleanroom Technologies Market, by End-User, 2016-2026 (USD Billion)
        TABLE 18 The Middle-East and Africa Cleanroom Technologies Market, by Product, 2016-2026 (USD Billion)
        TABLE 19 The Middle-East and Africa Cleanroom Technologies Market, by Construction Type, 2016-2026 (USD Billion)
        TABLE 20 The Middle-East and Africa Cleanroom Technologies Market, by End-User, 2016-2026 (USD Billion)
        TABLE 21 Global Cleanroom Technologies Market - Company Revenue Analysis 2016-2019 (USD Billion)
        TABLE 22 Global Cleanroom Technologies Market - Company Revenue Share Analysis 2016-2019(%)
        TABLE 23 Acquisitions and Mergers
        TABLE 24 New Product/Service Launch
        TABLE 25 Research & Development Activities
        TABLE 26 Market Drivers
        TABLE 27 Market Restraints
        TABLE 28 Market Opportunities
        

Industry Major Market Players

  •  Kimberly-Clark Corporation
  •  Azbil Corporation
  •  Ardmac
  •  Clean Air Products
  •  Labconco Corporation
  •  Exyte AG
  •  Dynarex Corporation
  •  Airtech Japan Ltd.
  •  DowDuPont Inc.
  •  Illinois Tool Works Inc.
  •  Taikisha Ltd.
  •  ABN Cleanroom Technology
  •  COLANDIS GmbH
  •  Clean Rooms International Inc.
  •  Terra Universal Inc.
  •  Bouygues Group
  •  Connect 2 Cleanrooms Ltd.
  •  OCTANORM-Vertriebs-GmbH
  •  Camfil
  •  Parteco Srl