![]()
Search Market Research Report
Butane Market Size, Share Global Analysis Report, 2020–2026

Butane Market By Application (LPG, Petrochemicals, Refinery, and Others), and By Region: Global Industry Outlook, Market Size, Business Intelligence, Consumer Preferences, Statistical Surveys, Comprehensive Analysis, Historical Developments, Current Trends, and Forecast 2020–2026
Industry Insights
This specialized and expertise oriented industry research report scrutinizes the technical and commercial business outlook of the Butane industry. The report analyzes and declares the historical and current trends analysis of the Butane industry and subsequently recommends the projected trends anticipated to be observed in the global Butane market during the upcoming years.
The global Butane market report analyzes and notifies the industry statistics at the global as well as regional and country levels in order to acquire a thorough perspective of the entire Butane market. The historical and past insights are provided for FY 2016 to FY 2019 whereas projected trends are delivered for FY 2020 to FY 2026. The quantitative and numerical data is represented in terms of both volume (Million Tons) and value (USD Billion) from FY 2016 – 2026.
The quantitative data is further underlined and reinforced by comprehensive qualitative data which comprises various across-the-board market dynamics. The rationales which directly or indirectly impact the Butane industry are exemplified through parameters such as growth drivers, restraints, challenges, and opportunities among other impacting factors.
Throughout our research report, we have encompassed all the proven models and tools of industry analysis and extensively illustrated all the key business strategies and business models adopted in the Butane industry. The report provides an all-inclusive and detailed competitive landscape prevalent in the global Butane market.
The report utilizes established industry analysis tools and models such as Porter’s Five Forces framework to analyze and recognize critical business strategies adopted by various stakeholders involved in the entire value chain of the Butane industry. The global Butane market report additionally employs SWOT analysis and PESTLE analysis models for further in-depth analysis.
The report study further includes an in-depth analysis of industry players' market shares and provides an overview of leading players' market position in the Butane sector. Key strategic developments in the global Butane market competitive landscape such as acquisitions & mergers, inaugurations of different products and services, partnerships & joint ventures, MoU agreements, VC & funding activities, R&D activities, and geographic expansion among other noteworthy activities by key players of the global Butane market are appropriately highlighted in the report.
Butane is a highly flammable, colorless, and easily liquefied hydrocarbon. Butane is produced as a byproduct of crude oil production and refining. It is widely used as LPG, refrigerant, lighters, and aerosols due to its high density.
The growing demand for an alternative for fossil fuels is the primary reason augmenting the growth of the global Butane market. Thus, the automotive application of butane is a major market share contributor. Additionally, the rising demand for electricity has increased its use in power generation across the world. Furthermore, the rising demand for butane in the petrochemical industries accounts for market growth. The growing R&D activities in the renewable energy sector are likely to escalate the scope of butane in the coming years. Butane is widely used as LPG in the industrial and residential areas, thereby benefiting the butane market. The eco-friendly nature and efficiency of butane make it a promising reliant for the paper, plastic, explosive, and food processing industries. Apart from this, the rising use of automobiles, supporting government bodies, and favorable emission standard policies boost industry growth. However, the changing crude oil prices and groundwater contamination due to leakage of methyl tert-butyl ether (MTBE) will hamper the growth of the Butane market.
The global Butane market research report delivers an acute valuation and taxonomy of the Butane industry by practically splitting the market on the basis of different applications and regions. Through the analysis of the historical and projected trends, all the segments and sub-segments were evaluated through the bottom-up approach, and different market sizes have been projected for FY 2020 to FY 2026. The regional segmentation of the Butane industry includes the complete classification of all the major continents including North America, Latin America, Europe, Asia Pacific, and Middle East & Africa. Further, country-wise data for the Butane industry is provided for the leading economies of the world.
The global Butane market is segmented based on Application. On the basis of application segmentation, the market is classified into LPG, Petrochemicals, Refinery, and Others.
 Report Scope
Report Attribute |
Details |
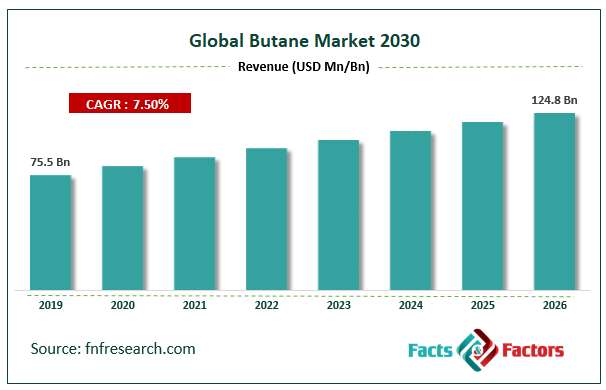
Market Size in 2019 |
USD 75.5 Billion |
Projected Market Size in 2026 |
USD 124.8 Billion |
CAGR Growth Rate |
7.5% CAGR |
Base Year |
2019 |
Forecast Years |
2020-2026 |
Key Market Players |
Chevron Corporation, Aditya Air Product Pvt. Ltd., British Petroleum, ExxonMobil Corp., ConocoPhillips Co., Sinopec Group., Proton Gases India Pvt. ltd., Royal Dutch Shell, Total S.A., Devon Energy Corporation, Valero Energy Corporation., Tyumen Oil Company, Air Liquide, Linde AG, Energy Corporation of America, Praxair, Perenco, and China National Petroleum Corporation (CNPC), among others. |
Key Segment |
By Application, and By Region |
Major Regions Covered |
North America, Europe, Asia Pacific, Latin America, and the Middle East & Africa |
Purchase Options |
Request customized purchase options to meet your research needs. Explore purchase options |
Some of the essential players operating in the global Butane market, but not restricted to include
- Chevron Corporation
- Aditya Air Product Pvt. Ltd.
- British Petroleum
- ExxonMobil Corp.
- ConocoPhillips Co.
- Sinopec Group.
- Proton Gases India Pvt. ltd.
- Royal Dutch Shell
- Total S.A.
- Devon Energy Corporation
- Valero Energy Corporation.
- Tyumen Oil Company
- Air Liquide
- Linde AG
- Energy Corporation of America
- Praxair
- Perenco
- China National Petroleum Corporation (CNPC)
The taxonomy of the Butane industry by its scope and segmentation is as follows:
By Type Segmentation Analysis
- LPG
- Petrochemicals
- Refineries
- Others
Regional Segmentation Analysis
- North America
- The U.S.
- Canada
- Europe
- Germany
- The UK
- France
- Spain
- Italy
- Rest of Europe
- Asia Pacific
- China
- Japan
- India
- South Korea
- Southeast Asia
- Rest of Asia Pacific
- Latin America
- Brazil
- Mexico
- Rest of Latin America
- Middle East & Africa
- GCC
- South Africa
- Rest of Middle East & Africa
Table of Content
Industry Major Market Players
- Chevron Corporation
- Aditya Air Product Pvt. Ltd.
- British Petroleum
- ExxonMobil Corp.
- ConocoPhillips Co.
- Sinopec Group.
- Proton Gases India Pvt. ltd.
- Royal Dutch Shell
- Total S.A.
- Devon Energy Corporation
- Valero Energy Corporation.
- Tyumen Oil Company
- Air Liquide
- Linde AG
- Energy Corporation of America
- Praxair
- Perenco
- China National Petroleum Corporation (CNPC)


Copyright © 2025 - 2026, All Rights Reserved, Facts and Factors