Search Market Research Report

Discover Our Latest Reports
Discover Our Featured Reports
Discover Top Selling Reports

Glass Partition Wall Market Size, Share Global Analysis Report, 2020–2026

report img

Glass Partition Wall Market By Type (Movable Partition/ Demountable, Sliding Doors, Acoustical Glass and Others) and By Application (Commercial Buildings, Institutional Buildings, Industrial Buildings and Others): Global Industry Outlook, Market Size, Business Intelligence, Consumer Preferences, Statistical Surveys, Comprehensive Analysis, Historical Developments, Current Trends, and Forecast 2020–2026

Industry Insights

The Glass Partition Wall market report analyzes and notifies the industry statistics at the global as well as regional and country levels in order to acquire a thorough perspective of the entire Glass Partition Wall market. The historical and past insights are provided for FY 2016 to FY 2019 whereas projected trends are delivered for FY 2020 to FY 2026. The quantitative and numerical data is represented in terms of both volume (Million Sq. Meters) and value (USD Million) from FY 2016 – 2026.

This specialized and expertise oriented industry research report scrutinizes the technical and commercial business outlook of the Glass Partition Wall industry. The report analyzes and declares the historical and current trends analysis of the Glass Partition Wall industry and subsequently recommends the projected trends anticipated to be observed in the Glass Partition Wall market during the upcoming years.

Glass Partition Wall Market Size

To know more about this report | Request Free Sample Copy


logoKey Insights from Primary Research

  • As per our primary respondents, the Glass Partition Wall market is set to grow annually at a rate of around 3.2%.
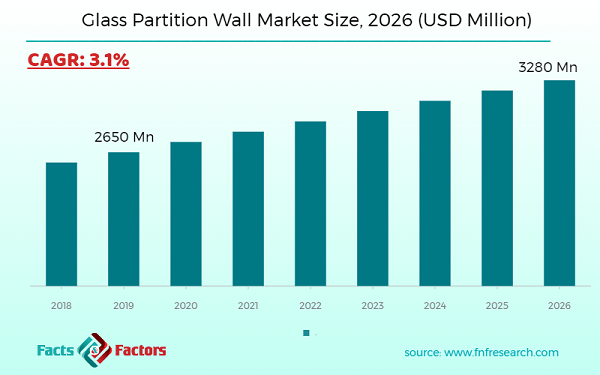
  • It was established through primary research that the Glass Partition Wall market was valued at around USD 2,650 million in 2019.
  • After secondary research, we performed face to face interviews to validate our data. The insights interviewee’s declared that Acoustical Glass is the most used type for the global Glass Partition Wall market.
  • On the basis of the type, mobile tanker dominated the global Glass Partition Wall market in 2019. It accounted for around 29% share of the total market in 2019.
  • The Commercial Buildings segment, on the basis of application segmentation, was the leading revenue-generating category accounting for around 48% share, in 2019.

logoKey Recommendations from Analysts

  • Based on the exhaustive secondary research done by our team, the Acoustical Glass type is anticipated to become the most demanding type in the upcoming years, owing to the growing demand for Glass Partition Wall from the IT and residential industry for various end-use applications.
  • As per our analysts, APAC recorded the highest market share of more than 35% by 2026, and the market is expected to bolster in this region, resulting in creating lucrative opportunities for new players.
  • Growing at a CAGR around 3.2%, the Glass Partition Wall market provides numerous opportunities for all of the involved stakeholders across the entire value chain.
  • Our analysts have identified Acoustical Glass and Commercial Buildings categories as the leading investment pockets for the Glass Partition Wall market in terms of type and application segmentation respectively.
  • Our analysts recommend the emerging players to focus on Acoustical Glass owing to the substantial growth of the residential and IT industry, especially in APAC.

logo
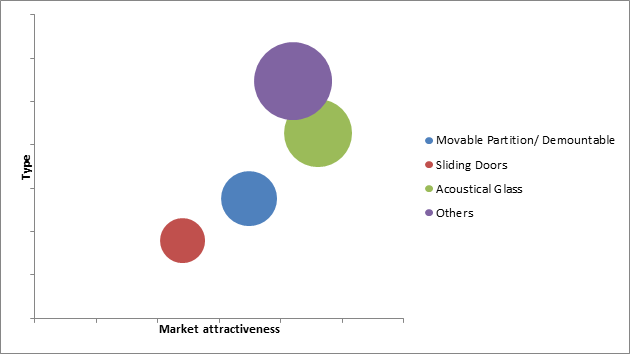
Market Attractiveness – By Type

Glass Partition Wall Market

To know more about this report | Request Free Sample Copy


The quantitative data is further underlined and reinforced by comprehensive qualitative data which comprises various across-the-board market dynamics. The rationales which directly or indirectly impact the Glass Partition Wall industry are exemplified through parameters such as growth drivers, restraints, challenges, and opportunities among other impacting factors.

Throughout our research report, we have encompassed all the proven models and tools of industry analysis and extensively illustrated all the key business strategies and business models adopted in the Glass Partition Wall industry. The report provides an all-inclusive and detailed competitive landscape prevalent in the Glass Partition Wall market.

The report utilizes established industry analysis tools and models such as Porter’s Five Forces framework to analyze and recognize critical business strategies adopted by various stakeholders involved in the entire value chain of the Glass Partition Wall industry. The Glass Partition Wall market report additionally employs SWOT analysis and PESTLE analysis models for further in-depth analysis.

The report study further includes an in-depth analysis of industry players' market shares and provides an overview of leading players' market position in the Glass Partition Wall sector. Key strategic developments in the Glass Partition Wall market competitive landscape such as acquisitions & mergers, inaugurations of different products and services, partnerships & joint ventures, MoU agreements, VC & funding activities, R&D activities, and geographic expansion among other noteworthy activities by key players of the Glass Partition Wall market are appropriately highlighted in the report.

The global market for Glass Partition Wall in 2019 was approximately USD 2650 million. The market is expected to grow at a CAGR of 3.1% and is anticipated to reach around USD 2280 million by 2026. Glass partition walls are high-quality, durable glass panels that serve as room dividers. The walls of the glass partition are ideal for opening up space and creating a safe and airy working environment. Typically, partition wall systems have full glass partitions (wall ceilings). Such devices shall be fitted with aluminum frames or other mounting hardware. This interior glass helps architects and designers divide the room as a building material without losing floor space and the diffusion of light. Glass partition walls are suitable for large and functional office working environments. When natural light flows into a given area, the interaction between shapes, colors, patterns, textures and people changes.

Splitting glass walls is also one of the easiest ways to upgrade your office or office space. Some of the features expected to drive the market are rapid reconfiguration, enhanced acoustics, and low remodeling costs. In addition, glass partition walls are widely used across many industries, such as education, IT, and others, due to their esthetically pleasing look combined with the ideal amount of natural light passage. In addition, glass partitions are sound and vermin-proof. The growth in educational institutions and the IT industry around the globe is expected to bring lucrative opportunities for new and existing players providing services to the glass partitioning industry.

The Glass Partition Wall market research report delivers an acute valuation and taxonomy of the Glass Partition Wall industry by practically splitting the market on the basis of different types, applications, and regions. Through the analysis of the historical and projected trends, all the segments and sub-segments were evaluated through the bottom-up approach, and different market sizes have been projected for FY 2020 to FY 2026. The regional segmentation of the Glass Partition Wall industry includes the complete classification of all the major continents including North America, Latin America, Europe, Asia Pacific, and the Middle East & Africa. Further, country-wise data for the Glass Partition Wall industry is provided for the leading economies of the world.

The Glass Partition Wall market is segmented based on Type and Application. On the basis of type segmentation, the market is classified into Movable Partition/ Demountable, Sliding Doors, Acoustical Glass, and Others. In terms of Application segmentation, the market is bifurcated into Commercial Buildings, Institutional Buildings, Industrial Buildings, and Others.

logoReport Scope

Report Attribute

Details

Market Size in 2019

USD 2,650 Million

Projected Market Size in 2026

USD 3,280 Million

CAGR Growth Rate

3.1% CAGR

Base Year

2019

Forecast Years

2020-2026

Key Market Players

Lindner Group, Optima, Dormakaba, Hufcor, AXIS, Jeld Wen, Maars, IMT, CARVART, Lizzanno Partitions, JEB, Nanawall, Lacantina, Panda, DIRTT Environmental Solutions, CR Laurence, Klein, Apton Partitioning, Interwand (Netherlands), Clestra Hauserman (France), Dalai (Hong Kong) Partition Industrial Co., Ltd, U-Team Corporate Office Solution, Obspace Wall Partition Co., Ltd, Halumm (Hangzhou) Furniture Co., Ltd, Avanti Systems USA, Neuwall Movable Partition Wall Solution, and others.

Key Segment

By Type, By Application, By Region

Major Regions Covered

North America, Europe, Asia Pacific, Latin America, and the Middle East & Africa

Purchase Options

Request customized purchase options to meet your research needs. Explore purchase options

logoSome of the essential players operating in the Global Partition wall market, but not restricted to include

  •  Lindner Group
  •  Optima
  •  Dormakaba
  •  Hufcor
  •  AXIS
  •  Jeld Wen
  •  Maars
  •  IMT
  •  CARVART
  •  Lizzanno Partitions
  •  JEB
  •  Nanawall
  •  Lacantina
  •  Panda
  •  DIRTT Environmental Solutions
  •  CR Laurence
  •  Klein
  •  Apton Partitioning
  •  Interwand (Netherlands)
  •  Clestra Hauserman (France)
  •  Dalai (Hong Kong) Partition Industrial Co.Ltd
  •  U-Team Corporate Office Solution
  •  Obspace Wall Partition Co.Ltd
  •  Halumm (Hangzhou) Furniture Co.Ltd
  •  Avanti Systems USA
  •  Neuwall Movable Partition Wall Solution

The taxonomy of the Glass Partition Wall industry by its scope and segmentation is as follows

logoBy Region 

  • North America
    • The U.S.
    • Canada
    • Mexico
  • Europe
    • France
    • The UK
    • Spain
    • Germany
    • Italy
    • Nordic Countries
      • Denmark
      • Sweden
      • Norway
    • Benelux Union
      • Belgium
      • The Netherlands
      • Luxembourg
    • Rest of Europe
  • Asia Pacific
    • China
    • Japan
    • India
    • Australia
    • South Korea
    • Southeast Asia
      • Indonesia
      • Thailand
      • Malaysia
      • Singapore
      • Rest of Southeast Asia
    • Rest of Asia Pacific
  • The Middle East & Africa
    • Saudi Arabia
    • UAE
    • Egypt
    • South Africa
    • Rest of the Middle East & Africa
  • Latin America
    • Brazil
    • Argentina
    • Rest of Latin America


Table of Content

  1. CHAPTER 1. Executive Summary
  2. CHAPTER 2. Glass Partition Wall market – Types Analysis
    1. 2.1. Global Glass Partition Wall Market – Types Overview
    2. 2.2. Global Glass Partition Wall Market Share, by Types, 2019 & 2026 (USD Million)
    3. 2.3. Global Glass Partition Wall Market share, by Types, 2019 & 2026 (Million Sq. Meters)
    4. 2.4. Movable Partition/ Demountable
      1. 2.4.1. Global Movable Partition/ Demountable Glass Partition Wall Market, 2016-2026 (USD Million)
      2. 2.4.2. Global Movable Partition/ Demountable Glass Partition Wall Market, 2016-2026 (Million Sq. Meters)
    5. 2.5. Sliding Doors
      1. 2.5.1. Global Sliding Doors Glass Partition Wall Market, 2016-2026 (USD Million)
      2. 2.5.2. Global Sliding Doors Glass Partition Wall Market, 2016-2026 (Million Sq. Meters)
    6. 2.6. Acoustical Glass
      1. 2.6.1. Global Acoustical Glass Glass Partition Wall Market, 2016-2026 (USD Million)
      2. 2.6.2. Global Acoustical Glass Glass Partition Wall Market, 2016-2026 (Million Sq. Meters)
    7. 2.7. Others
      1. 2.7.1. Global Others Glass Partition Wall Market, 2016-2026 (USD Million)
      2. 2.7.2. Global Others Glass Partition Wall Market, 2016-2026 (Million Sq. Meters)
  3. CHAPTER 3. Glass Partition Wall market – Application Analysis
    1. 3.1. Global Glass Partition Wall Market – Application Overview
    2. 3.2. Global Glass Partition Wall Market Share, by Application, 2019 & 2026 (USD Million)
    3. 3.3. Global Glass Partition Wall Market share, by Application, 2019 & 2026 (Million Sq. Meters)
    4. 3.4. Commercial Buildings
      1. 3.4.1. Global Commercial Buildings Glass Partition Wall Market, 2016-2026 (USD Million)
      2. 3.4.2. Global Commercial Buildings Glass Partition Wall Market, 2016-2026 (Million Sq. Meters)
    5. 3.5. Institutional Buildings
      1. 3.5.1. Global Institutional Buildings Glass Partition Wall Market, 2016-2026 (USD Million)
      2. 3.5.2. Global Institutional Buildings Glass Partition Wall Market, 2016-2026 (Million Sq. Meters)
    6. 3.6. Industrial Buildings
      1. 3.6.1. Global Industrial Buildings Glass Partition Wall Market, 2016-2026 (USD Million)
      2. 3.6.2. Global Industrial Buildings Glass Partition Wall Market, 2016-2026 (Million Sq. Meters)
    7. 3.7. Others
      1. 3.7.1. Global Others Glass Partition Wall Market, 2016-2026 (USD Million)
      2. 3.7.2. Global Others Glass Partition Wall Market, 2016-2026 (Million Sq. Meters)
  4. CHAPTER 4. Glass Partition Wall market – Regional Analysis
    1. 4.1. Global Glass Partition Wall Market Regional Overview
    2. 4.2. Global Glass Partition Wall Market Share, by Region, 2019 & 2026 (Value)
    3. 4.3. Global Glass Partition Wall Market Share, by Region, 2019 & 2026 (Volume)
    4. 4.4. North America
      1. 4.4.1. North America Glass Partition Wall Market size and forecast, 2016-2026
      2. 4.4.2. North America Glass Partition Wall Market, by Country, 2019 - 2026 (USD Million)
      3. 4.4.3. North America Market size and forecast, 2016-2026 (Million Sq. Meters)
      4. 4.4.4. North America Glass Partition Wall Market, by Country, 2019 - 2026 (Million Sq. Meters)
      5. 4.4.5. North America Glass Partition Wall Market, by Types, 2016-2026
        1. 4.4.5.1. North America Glass Partition Wall Market, by Types, 2016-2026 (USD Million)
        2. 4.4.5.2. North America Glass Partition Wall Market, by Types, 2016-2026 (Million Sq. Meters)
      6. 4.4.6. North America Glass Partition Wall Market, by Application, 2016-2026
        1. 4.4.6.1. North America Glass Partition Wall Market, by Application, 2016-2026 (USD Million)
        2. 4.4.6.2. North America Glass Partition Wall Market, by Application, 2016-2026 (Million Sq. Meters)
      7. 4.4.7. U.S.
        1. 4.4.7.1. U.S. Market size and forecast, 2016-2026 (USD Million)
        2. 4.4.7.2. U.S. Market size and forecast, 2016-2026 (Million Sq. Meters)
      8. 4.4.8. Canada
        1. 4.4.8.1. Canada Market size and forecast, 2016-2026 (USD Million)
        2. 4.4.8.2. Canada Market size and forecast, 2016-2026 (Million Sq. Meters)
    5. 4.5. Europe
      1. 4.5.1. Europe Glass Partition Wall Market size and forecast, 2016-2026
      2. 4.5.2. Europe Glass Partition Wall Market, by Country, 2019 - 2026 (USD Million)
      3. 4.5.3. Europe Market size and forecast, 2016-2026 (Million Sq. Meters)
      4. 4.5.4. Europe Glass Partition Wall Market, by Country, 2019 - 2026 (Million Sq. Meters)
      5. 4.5.5. Europe Glass Partition Wall Market, by Types, 2016-2026
        1. 4.5.5.1. Europe Glass Partition Wall Market, by Types, 2016-2026 (USD Million)
        2. 4.5.5.2. Europe Glass Partition Wall Market, by Types, 2016-2026 (Million Sq. Meters)
      6. 4.5.6. Europe Glass Partition Wall Market, by Application, 2016-2026
        1. 4.5.6.1. Europe Glass Partition Wall Market, by Application, 2016-2026 (USD Million)
        2. 4.5.6.2. Europe Glass Partition Wall Market, by Application, 2016-2026 (Million Sq. Meters)
      7. 4.5.7. Germany
        1. 4.5.7.1. Germany Market size and forecast, 2016-2026 (USD Million)
        2. 4.5.7.2. Germany Market size and forecast, 2016-2026 (Million Sq. Meters)
      8. 4.5.8. France
        1. 4.5.8.1. France Market size and forecast, 2016-2026 (USD Million)
        2. 4.5.8.2. France Market size and forecast, 2016-2026 (Million Sq. Meters)
      9. 4.5.9. U.K.
        1. 4.5.9.1. U.K. Market size and forecast, 2016-2026 (USD Million)
        2. 4.5.9.2. U.K. Market size and forecast, 2016-2026 (Million Sq. Meters)
      10. 4.5.10. Italy
        1. 4.5.10.1. Italy Market size and forecast, 2016-2026 (USD Million)
        2. 4.5.10.2. Italy Market size and forecast, 2016-2026 (Million Sq. Meters)
      11. 4.5.11. Spain
        1. 4.5.11.1. Spain Market size and forecast, 2016-2026 (USD Million)
        2. 4.5.11.2. Spain Market size and forecast, 2016-2026 (Million Sq. Meters)
      12. 4.5.12. Rest of Europe
        1. 4.5.12.1. Rest of Europe Market size and forecast, 2016-2026 (USD Million)
        2. 4.5.12.2. Rest of Europe Market size and forecast, 2016-2026 (Million Sq. Meters)
    6. 4.6. Asia Pacific
      1. 4.6.1. Asia Pacific Glass Partition Wall Market size and forecast, 2016-2026
      2. 4.6.2. Asia Pacific Glass Partition Wall Market, by Country, 2019 - 2026 (USD Million)
      3. 4.6.3. Asia Pacific Market size and forecast, 2016-2026 (Million Sq. Meters)
      4. 4.6.4. Asia Pacific Glass Partition Wall Market, by Country, 2019 - 2026 (Million Sq. Meters)
      5. 4.6.5. Asia Pacific Glass Partition Wall Market, by Types, 2016-2026
        1. 4.6.5.1. Asia Pacific Glass Partition Wall Market, by Types, 2016-2026 (USD Million)
        2. 4.6.5.2. Asia Pacific Glass Partition Wall Market, by Types, 2016-2026 (Million Sq. Meters)
      6. 4.6.6. Asia Pacific Glass Partition Wall Market, by Application, 2016-2026
        1. 4.6.6.1. Asia Pacific Glass Partition Wall Market, by Application, 2016-2026 (USD Million)
        2. 4.6.6.2. Asia Pacific Glass Partition Wall Market, by Application, 2016-2026 (Million Sq. Meters)
      7. 4.6.7. China
        1. 4.6.7.1. China Market size and forecast, 2016-2026 (USD Million)
        2. 4.6.7.2. China Market size and forecast, 2016-2026 (Million Sq. Meters)
      8. 4.6.8. Japan
        1. 4.6.8.1. Japan Market size and forecast, 2016-2026 (USD Million)
        2. 4.6.8.2. Japan Market size and forecast, 2016-2026 (Million Sq. Meters)
      9. 4.6.9. India
        1. 4.6.9.1. India Market size and forecast, 2016-2026 (USD Million)
        2. 4.6.9.2. India Market size and forecast, 2016-2026 (Million Sq. Meters)
      10. 4.6.10. South Korea
        1. 4.6.10.1. South Korea Market size and forecast, 2016-2026 (USD Million)
        2. 4.6.10.2. South Korea Market size and forecast, 2016-2026 (Million Sq. Meters)
      11. 4.6.11. South-East Asia
        1. 4.6.11.1. South-East Asia Market size and forecast, 2016-2026 (USD Million)
        2. 4.6.11.2. South-East Asia Market size and forecast, 2016-2026 (Million Sq. Meters)
      12. 4.6.12. Rest of Asia Pacific
        1. 4.6.12.1. Rest of Asia Pacific Market size and forecast, 2016-2026 (USD Million)
        2. 4.6.12.2. Rest of Asia Pacific Market size and forecast, 2016-2026 (Million Sq. Meters)
    7. 4.7. Latin America
      1. 4.7.1. Latin America Glass Partition Wall Market size and forecast, 2016-2026
      2. 4.7.2. Latin America Glass Partition Wall Market, by Country, 2019 - 2026 (USD Million)
      3. 4.7.3. Latin America Market size and forecast, 2016-2026 (Million Sq. Meters)
      4. 4.7.4. Latin America Glass Partition Wall Market, by Country, 2019 - 2026 (Million Sq. Meters)
      5. 4.7.5. Latin America Glass Partition Wall Market, by Types, 2016-2026
        1. 4.7.5.1. Latin America Glass Partition Wall Market, by Types, 2016-2026 (USD Million)
        2. 4.7.5.2. Latin America Glass Partition Wall Market, by Types, 2016-2026 (Million Sq. Meters)
      6. 4.7.6. Latin America Glass Partition Wall Market, by Application, 2016-2026
        1. 4.7.6.1. Latin America Glass Partition Wall Market, by Application, 2016-2026 (USD Million)
        2. 4.7.6.2. Latin America Glass Partition Wall Market, by Application, 2016-2026 (Million Sq. Meters)
      7. 4.7.7. Brazil
        1. 4.7.7.1. Brazil Market size and forecast, 2016-2026 (USD Million)
        2. 4.7.7.2. Brazil Market size and forecast, 2016-2026 (Million Sq. Meters)
      8. 4.7.8. Mexico
        1. 4.7.8.1. Mexico Market size and forecast, 2016-2026 (USD Million)
        2. 4.7.8.2. Mexico Market size and forecast, 2016-2026 (Million Sq. Meters)
      9. 4.7.9. Rest of Latin America
        1. 4.7.9.1. Rest of Latin America Market size and forecast, 2016-2026 (USD Million)
        2. 4.7.9.2. Rest of Latin America Market size and forecast, 2016-2026 (Million Sq. Meters)
    8. 4.8. The Middle-East and Africa
      1. 4.8.1. The Middle-East and Africa Glass Partition Wall Market size and forecast, 2016-2026
      2. 4.8.2. The Middle-East and Africa Glass Partition Wall Market, by Country, 2019 - 2026 (USD Million)
      3. 4.8.3. The Middle-East and Africa Market size and forecast, 2016-2026 (Million Sq. Meters)
      4. 4.8.4. The Middle-East and Africa Glass Partition Wall Market, by Country, 2019 - 2026 (Million Sq. Meters)
      5. 4.8.5. The Middle-East and Africa Glass Partition Wall Market, by Types, 2016-2026
        1. 4.8.5.1. The Middle-East and Africa Glass Partition Wall Market, by Types, 2016-2026 (USD Million)
        2. 4.8.5.2. The Middle-East and Africa Glass Partition Wall Market, by Types, 2016-2026 (Million Sq. Meters)
      6. 4.8.6. The Middle-East and Africa Glass Partition Wall Market, by Application, 2016-2026
        1. 4.8.6.1. The Middle-East and Africa Glass Partition Wall Market, by Application, 2016-2026 (USD Million)
        2. 4.8.6.2. The Middle-East and Africa Glass Partition Wall Market, by Application, 2016-2026 (Million Sq. Meters)
      7. 4.8.7. GCC Countries
        1. 4.8.7.1. GCC Countries Market size and forecast, 2016-2026 (USD Million)
        2. 4.8.7.2. GCC Countries Market size and forecast, 2016-2026 (Million Sq. Meters)
      8. 4.8.8. South Africa
        1. 4.8.8.1. South Africa Market size and forecast, 2016-2026 (USD Million)
        2. 4.8.8.2. South Africa Market size and forecast, 2016-2026 (Million Sq. Meters)
      9. 4.8.9. Rest of Middle-East Africa
        1. 4.8.9.1. Rest of Middle-East Africa Market size and forecast, 2016-2026 (USD Million)
        2. 4.8.9.2. Rest of Middle-East Africa Market size and forecast, 2016-2026 (Million Sq. Meters)
  5. CHAPTER 5. Glass Partition Wall Production, Consumption, Export, Import by Regions
    1. 5.1. Global Glass Partition Wall production and revenue, 2016-2026 (USD Million) (Million Sq. Meters)
    2. 5.2. Global Import and Export Analysis, by Region
  6. CHAPTER 6. Glass Partition Wall market – Competitive Landscape
    1. 6.1. Competitor Market Share – Revenue
    2. 6.2. Market Concentration Rate Analysis, Top 3 and Top 5 Players
    3. 6.3. Competitor Market Share – Volume
    4. 6.4. Strategic Development
      1. 6.4.1. Acquisitions and Mergers
      2. 6.4.2. New Products
      3. 6.4.3. Research & Development Activities
  7. CHAPTER 7. Company Profiles
    1. 7.1. Lindner Group
      1. 7.1.1. Company Overview
      2. 7.1.2. Lindner Group Sales, Revenue, Price, and Gross Margin
      3. 7.1.3. Product portfolio
      4. 7.1.4. Recent initiatives
    2. 7.2. Optima
      1. 7.2.1. Company Overview
      2. 7.2.2. Optima Sales, Revenue, Price, and Gross Margin
      3. 7.2.3. Product portfolio
      4. 7.2.4. Recent initiatives
    3. 7.3. Dormakaba
      1. 7.3.1. Company Overview
      2. 7.3.2. Dormakaba Sales, Revenue, Price, and Gross Margin
      3. 7.3.3. Product portfolio
      4. 7.3.4. Recent initiatives
    4. 7.4. Hufcor
      1. 7.4.1. Company Overview
      2. 7.4.2. Hufcor Sales, Revenue, Price, and Gross Margin
      3. 7.4.3. Product portfolio
      4. 7.4.4. Recent initiatives
    5. 7.5. AXIS
      1. 7.5.1. Company Overview
      2. 7.5.2. AXIS Sales, Revenue, Price, and Gross Margin
      3. 7.5.3. Product portfolio
      4. 7.5.4. Recent initiatives
    6. 7.6. Jeld Wen
      1. 7.6.1. Company Overview
      2. 7.6.2. Jeld Wen Sales, Revenue, Price, and Gross Margin
      3. 7.6.3. Product portfolio
      4. 7.6.4. Recent initiatives
    7. 7.7. Maars
      1. 7.7.1. Company Overview
      2. 7.7.2. Maars Sales, Revenue, Price, and Gross Margin
      3. 7.7.3. Product portfolio
      4. 7.7.4. Recent initiatives
    8. 7.8. IMT
      1. 7.8.1. Company Overview
      2. 7.8.2. IMT Sales, Revenue, Price, and Gross Margin
      3. 7.8.3. Product portfolio
      4. 7.8.4. Recent initiatives
    9. 7.9. CARVART
      1. 7.9.1. Company Overview
      2. 7.9.2. CARVART Sales, Revenue, Price, and Gross Margin
      3. 7.9.3. Product portfolio
      4. 7.9.4. Recent initiatives
    10. 7.10. Lizzanno Partitions
      1. 7.10.1. Company Overview
      2. 7.10.2. Lizzanno Partitions Sales, Revenue, Price, and Gross Margin
      3. 7.10.3. Product portfolio
      4. 7.10.4. Recent initiatives
    11. 7.11. JEB
      1. 7.11.1. Company Overview
      2. 7.11.2. JEB Sales, Revenue, Price, and Gross Margin
      3. 7.11.3. Product portfolio
      4. 7.11.4. Recent initiatives
    12. 7.12. Nanawall
      1. 7.12.1. Company Overview
      2. 7.12.2. Nanawall Sales, Revenue, Price, and Gross Margin
      3. 7.12.3. Product portfolio
      4. 7.12.4. Recent initiatives
    13. 7.13. Lacantina
      1. 7.13.1. Company Overview
      2. 7.13.2. Lacantina Sales, Revenue, Price, and Gross Margin
      3. 7.13.3. Product portfolio
      4. 7.13.4. Recent initiatives
    14. 7.14. Panda
      1. 7.14.1. Company Overview
      2. 7.14.2. Panda Sales, Revenue, Price, and Gross Margin
      3. 7.14.3. Product portfolio
      4. 7.14.4. Recent initiatives
    15. 7.15. DIRTT Environmental Solutions
      1. 7.15.1. Company Overview
      2. 7.15.2. DIRTT Environmental Solutions Sales, Revenue, Price, and Gross Margin
      3. 7.15.3. Product portfolio
      4. 7.15.4. Recent initiatives
    16. 7.16. CR Laurence
      1. 7.16.1. Company Overview
      2. 7.16.2. CR Laurence Sales, Revenue, Price, and Gross Margin
      3. 7.16.3. Product portfolio
      4. 7.16.4. Recent initiatives
    17. 7.17. Klein
      1. 7.17.1. Company Overview
      2. 7.17.2. Klein Sales, Revenue, Price, and Gross Margin
      3. 7.17.3. Product portfolio
      4. 7.17.4. Recent initiatives
    18. 7.18. Apton Partitioning (UK
      1. 7.18.1. Company Overview
      2. 7.18.2. Apton Partitioning (UK Sales, Revenue, Price, and Gross Margin
      3. 7.18.3. Product portfolio
      4. 7.18.4. Recent initiatives
    19. 7.19. Interwand (Netherlands)
      1. 7.19.1. Company Overview
      2. 7.19.2. Interwand (Netherlands) Sales, Revenue, Price, and Gross Margin
      3. 7.19.3. Product portfolio
      4. 7.19.4. Recent initiatives
    20. 7.20. Clestra Hauserman (France)
      1. 7.20.1. Company Overview
      2. 7.20.2. Clestra Hauserman (France) Sales, Revenue, Price, and Gross Margin
      3. 7.20.3. Product portfolio
      4. 7.20.4. Recent initiatives
    21. 7.21. Dalai (Hong Kong) Partition Industrial Co., Ltd
      1. 7.21.1. Company Overview
      2. 7.21.2. Dalai (Hong Kong) Partition Industrial Co., Ltd Sales, Revenue, Price, and Gross Margin
      3. 7.21.3. Product portfolio
      4. 7.21.4. Recent initiatives
    22. 7.22. U-Team Corporate Office Solution
      1. 7.22.1. Company Overview
      2. 7.22.2. U-Team Corporate Office Solution Sales, Revenue, Price, and Gross Margin
      3. 7.22.3. Product portfolio
      4. 7.22.4. Recent initiatives
    23. 7.23. Obspace Wall Partition Co., Ltd
      1. 7.23.1. Company Overview
      2. 7.23.2. Obspace Wall Partition Co., Ltd Sales, Revenue, Price, and Gross Margin
      3. 7.23.3. Product portfolio
      4. 7.23.4. Recent initiatives
    24. 7.24. Halumm (Hangzhou) Furniture Co., Ltd
      1. 7.24.1. Company Overview
      2. 7.24.2. Halumm (Hangzhou) Furniture Co., Ltd Sales, Revenue, Price, and Gross Margin
      3. 7.24.3. Product portfolio
      4. 7.24.4. Recent initiatives
    25. 7.25. Avanti Systems USA
      1. 7.25.1. Company Overview
      2. 7.25.2. Avanti Systems USA Sales, Revenue, Price, and Gross Margin
      3. 7.25.3. Product portfolio
      4. 7.25.4. Recent initiatives
    26. 7.26. Neuwall Movable Partition Wall Solution
      1. 7.26.1. Company Overview
      2. 7.26.2. Neuwall Movable Partition Wall Solution Sales, Revenue, Price, and Gross Margin
      3. 7.26.3. Product portfolio
      4. 7.26.4. Recent initiatives
  8. CHAPTER 8. Glass Partition Wall — Industry Analysis
    1. 8.1. Introduction and Taxonomy
    2. 8.2. Glass Partition Wall Market – Key Trends
      1. 8.2.1. Market Drivers
      2. 8.2.2. Market Restraints
      3. 8.2.3. Market Opportunities
    3. 8.3. Value Chain Analysis
    4. 8.4. Key Mandates and Regulations
    5. 8.5. Technology Roadmap and Timeline
    6. 8.6. Glass Partition Wall market – Attractiveness Analysis
      1. 8.6.1. By Types
      2. 8.6.2. By Application
      3. 8.6.3. By Region
  9. CHAPTER 9. Raw Material analysis
    1. 9.1. Glass Partition Wall Key Raw Material Analysis
      1. 9.1.1. Key Raw Materials
      2. 9.1.2. Price Trend of Key Raw Materials
    2. 9.2. Key Suppliers of Raw Materials
    3. 9.3. Proportion of Manufacturing Cost Structure
      1. 9.3.1. Raw Materials
      2. 9.3.2. Labor Cost
    4. 9.4. Manufacturing Expenses Analysis of Glass Partition Wall
  10. CHAPTER 10. Industrial Chain, Sourcing Strategy and Downstream Buyers
    1. 10.1. Glass Partition Wall Industrial Chain Analysis
    2. 10.2. Upstream Raw Materials Sourcing
      1. 10.2.1. Risk Mitigation:
      2. 10.2.2. Supplier Relationships:
      3. 10.2.3. Business Processes:
      4. 10.2.4. Securing the Product:
    3. 10.3. Raw Materials Sources of Glass Partition Wall Major Manufacturers in 2016
    4. 10.4. Downstream Buyers
    5. 10.5. Distributors/Traders List
  11. CHAPTER 11. Marketing Strategy Analysis, Distributors
    1. 11.1. Marketing Channel
    2. 11.2. Direct Marketing
    3. 11.3. Indirect Marketing
    4. 11.4. Marketing Channel Development Trend
    5. 11.5. Economic/Political Environmental Change
  12. CHAPTER 12. Report Conclusion
  13. CHAPTER 13. Research Approach & Methodology
    1. 13.1. Report Description
    2. 13.2. Research Scope
    3. 13.3. Research Methodology
      1. 13.3.1. Secondary Research
      2. 13.3.2. Primary Research
      3. 13.3.3. Models
        1. 13.3.3.1. Company Share Analysis Model
        2. 13.3.3.2. Revenue Based Modeling
        3. 13.3.3.3. Research Limitations

        List of Figures

        FIG. 1 Global Glass Partition Wall Market, 2016-2026 (USD Million)
        FIG. 2 Global Glass Partition Wall Market Share, by Types, 2019 & 2026 (USD Million)
        FIG. 3 Global Glass Partition Wall Market share, by Types, 2019 & 2026 (Million Sq. Meters)
        FIG. 4 Global Movable Partition/ Demountable Glass Partition Wall Market, 2016-2026 (USD Million)
        FIG. 5 Global Movable Partition/ Demountable Glass Partition Wall  Market, 2016-2026 (Million Sq. Meters)
        FIG. 6 Global Sliding Doors Glass Partition Wall Market, 2016-2026 (USD Million)
        FIG. 7 Global Sliding Doors Glass Partition Wall  Market, 2016-2026 (Million Sq. Meters)
        FIG. 8 Global Acoustical Glass Glass Partition Wall Market, 2016-2026 (USD Million)
        FIG. 9 Global Acoustical Glass Glass Partition Wall  Market, 2016-2026 (Million Sq. Meters)
        FIG. 10 Global Others Glass Partition Wall Market, 2016-2026 (USD Million)
        FIG. 11 Global Others Glass Partition Wall  Market, 2016-2026 (Million Sq. Meters)
        FIG. 12 Global Glass Partition Wall Market Share, by Application, 2019 & 2026 (USD Million)
        FIG. 13 Global Glass Partition Wall Market share, by Application, 2019 & 2026 (Million Sq. Meters)
        FIG. 14 Global Commercial Buildings Glass Partition Wall Market, 2016-2026 (USD Million)
        FIG. 15 Global Commercial Buildings Glass Partition Wall  Market, 2016-2026 (Million Sq. Meters)
        FIG. 16 Global Institutional Buildings Glass Partition Wall Market, 2016-2026 (USD Million)
        FIG. 17 Global Institutional Buildings Glass Partition Wall  Market, 2016-2026 (Million Sq. Meters)
        FIG. 18 Global Industrial Buildings Glass Partition Wall Market, 2016-2026 (USD Million)
        FIG. 19 Global Industrial Buildings Glass Partition Wall  Market, 2016-2026 (Million Sq. Meters)
        FIG. 20 Global Others Glass Partition Wall Market, 2016-2026 (USD Million)
        FIG. 21 Global Others Glass Partition Wall  Market, 2016-2026 (Million Sq. Meters)
        FIG. 22 Global Glass Partition Wall Market Share, by Region, 2019 & 2026
        FIG. 23 Global Glass Partition Wall Market Share, by Region, 2019 & 2026
        FIG. 24 North America Glass Partition Wall Market, 2016-2026
        FIG. 25 North America Glass Partition Wall  Market, 2016-2026 (Million Sq. Meters)
        FIG. 26 U.S. Glass Partition Wall Market, 2016-2026
        FIG. 27 U.S. Glass Partition Wall  Market, 2016-2026 (Million Sq. Meters)
        FIG. 28 Canada Glass Partition Wall Market, 2016-2026
        FIG. 29 Canada Glass Partition Wall  Market, 2016-2026 (Million Sq. Meters)
        FIG. 30 Europe Glass Partition Wall Market, 2016-2026
        FIG. 31 Europe Glass Partition Wall  Market, 2016-2026 (Million Sq. Meters)
        FIG. 32 Germany Glass Partition Wall Market, 2016-2026
        FIG. 33 Germany Glass Partition Wall  Market, 2016-2026 (Million Sq. Meters)
        FIG. 34 France Glass Partition Wall Market, 2016-2026
        FIG. 35 France Glass Partition Wall  Market, 2016-2026 (Million Sq. Meters)
        FIG. 36 U.K. Glass Partition Wall Market, 2016-2026
        FIG. 37 U.K. Glass Partition Wall  Market, 2016-2026 (Million Sq. Meters)
        FIG. 38 Italy Glass Partition Wall Market, 2016-2026
        FIG. 39 Italy Glass Partition Wall  Market, 2016-2026 (Million Sq. Meters)
        FIG. 40 Spain Glass Partition Wall Market, 2016-2026
        FIG. 41 Spain Glass Partition Wall  Market, 2016-2026 (Million Sq. Meters)
        FIG. 42 Rest of Europe Glass Partition Wall Market, 2016-2026
        FIG. 43 Rest of Europe Glass Partition Wall  Market, 2016-2026 (Million Sq. Meters)
        FIG. 44 Asia Pacific Glass Partition Wall Market, 2016-2026
        FIG. 45 Asia Pacific Glass Partition Wall  Market, 2016-2026 (Million Sq. Meters)
        FIG. 46 China Glass Partition Wall Market, 2016-2026
        FIG. 47 China Glass Partition Wall  Market, 2016-2026 (Million Sq. Meters)
        FIG. 48 Japan Glass Partition Wall Market, 2016-2026
        FIG. 49 Japan Glass Partition Wall  Market, 2016-2026 (Million Sq. Meters)
        FIG. 50 India Glass Partition Wall Market, 2016-2026
        FIG. 51 India Glass Partition Wall  Market, 2016-2026 (Million Sq. Meters)
        FIG. 52 South  Korea Glass Partition Wall Market, 2016-2026
        FIG. 53 South  Korea Glass Partition Wall  Market, 2016-2026 (Million Sq. Meters)
        FIG. 54 South-East Asia Glass Partition Wall Market, 2016-2026
        FIG. 55 South-East Asia Glass Partition Wall  Market, 2016-2026 (Million Sq. Meters)
        FIG. 56 Rest of Asia Pacific Glass Partition Wall Market, 2016-2026
        FIG. 57 Rest of Asia Pacific Glass Partition Wall  Market, 2016-2026 (Million Sq. Meters)
        FIG. 58 Latin America Glass Partition Wall Market, 2016-2026
        FIG. 59 Latin America Glass Partition Wall  Market, 2016-2026 (Million Sq. Meters)
        FIG. 60 Brazil Glass Partition Wall Market, 2016-2026
        FIG. 61 Brazil Glass Partition Wall  Market, 2016-2026 (Million Sq. Meters)
        FIG. 62 Mexico Glass Partition Wall Market, 2016-2026
        FIG. 63 Mexico Glass Partition Wall  Market, 2016-2026 (Million Sq. Meters)
        FIG. 64 Rest of Latin America Glass Partition Wall Market, 2016-2026
        FIG. 65 Rest of Latin America Glass Partition Wall  Market, 2016-2026 (Million Sq. Meters)
        FIG. 66 The Middle-East and Africa Glass Partition Wall Market, 2016-2026
        FIG. 67 The Middle-East and Africa Glass Partition Wall  Market, 2016-2026 (Million Sq. Meters)
        FIG. 68 GCC Countries Glass Partition Wall Market, 2016-2026
        FIG. 69 GCC Countries Glass Partition Wall  Market, 2016-2026 (Million Sq. Meters)
        FIG. 70 South Africa Glass Partition Wall Market, 2016-2026
        FIG. 71 South Africa Glass Partition Wall  Market, 2016-2026 (Million Sq. Meters)
        FIG. 72 Rest of Middle-East Africa Glass Partition Wall Market, 2016-2026
        FIG. 73 Rest of Middle-East Africa Glass Partition Wall  Market, 2016-2026 (Million Sq. Meters)
        FIG. 74 Global Glass Partition Wall production and revenue, 2016-2026 (USD Million) (Million Sq. Meters)
        FIG. 75 North America Glass Partition Wall production and revenue, 2016-2026 (USD Million) (Million Sq. Meters)
        FIG. 76 Europe Glass Partition Wall production and revenue, 2016-2026 (USD Million) (Million Sq. Meters)
        FIG. 77 Asia Pacific Glass Partition Wall production and revenue, 2016-2026 (USD Million) (Million Sq. Meters)
        FIG. 78 Latin America Glass Partition Wall production and revenue, 2016-2026 (USD Million) (Million Sq. Meters)
        FIG. 79 Middle East and Africa Glass Partition Wall production and revenue, 2016-2026 (USD Million) (Million Sq. Meters)
        FIG. 80 Competitor Market Share – Revenue
        FIG. 81 Competitor Market Share – Volume
        FIG. 82 Lindner Group Revenue and Growth Rate
        FIG. 83 Lindner Group Market Share
        FIG. 84 Optima Revenue and Growth Rate
        FIG. 85 Optima Market Share
        FIG. 86 Dormakaba Revenue and Growth Rate
        FIG. 87 Dormakaba Market Share
        FIG. 88 Hufcor Revenue and Growth Rate
        FIG. 89 Hufcor Market Share
        FIG. 90 AXIS Revenue and Growth Rate
        FIG. 91 AXIS Market Share
        FIG. 92 Jeld Wen Revenue and Growth Rate
        FIG. 93 Jeld Wen Market Share
        FIG. 94 Maars Revenue and Growth Rate
        FIG. 95 Maars Market Share
        FIG. 96 IMT Revenue and Growth Rate
        FIG. 97 IMT Market Share
        FIG. 98 CARVART Revenue and Growth Rate
        FIG. 99 CARVART Market Share
        FIG. 100 Lizzanno Partitions Revenue and Growth Rate
        FIG. 101 Lizzanno Partitions Market Share
        FIG. 102 JEB Revenue and Growth Rate
        FIG. 103 JEB Market Share
        FIG. 104 Nanawall Revenue and Growth Rate
        FIG. 105 Nanawall Market Share
        FIG. 106 Lacantina Revenue and Growth Rate
        FIG. 107 Lacantina Market Share
        FIG. 108 Panda Revenue and Growth Rate
        FIG. 109 Panda Market Share
        FIG. 110 DIRTT Environmental Solutions Revenue and Growth Rate
        FIG. 111 DIRTT Environmental Solutions Market Share
        FIG. 112 CR Laurence Revenue and Growth Rate
        FIG. 113 CR Laurence Market Share
        FIG. 114 Klein Revenue and Growth Rate
        FIG. 115 Klein Market Share
        FIG. 116 Apton Partitioning (UK Revenue and Growth Rate
        FIG. 117 Apton Partitioning (UK Market Share
        FIG. 118 Interwand (Netherlands) Revenue and Growth Rate
        FIG. 119 Interwand (Netherlands) Market Share
        FIG. 120 Clestra Hauserman (France) Revenue and Growth Rate
        FIG. 121 Clestra Hauserman (France) Market Share
        FIG. 122 Dalai (Hong Kong) Partition Industrial Co., Ltd Revenue and Growth Rate
        FIG. 123 Dalai (Hong Kong) Partition Industrial Co., Ltd Market Share
        FIG. 124 U-Team Corporate Office Solution Revenue and Growth Rate
        FIG. 125 U-Team Corporate Office Solution Market Share
        FIG. 126 Obspace Wall Partition Co., Ltd Revenue and Growth Rate
        FIG. 127 Obspace Wall Partition Co., Ltd Market Share
        FIG. 128 Halumm (Hangzhou) Furniture Co., Ltd Revenue and Growth Rate
        FIG. 129 Halumm (Hangzhou) Furniture Co., Ltd Market Share
        FIG. 130 Avanti Systems USA Revenue and Growth Rate
        FIG. 131 Avanti Systems USA Market Share
        FIG. 132 Neuwall Movable Partition Wall Solution Revenue and Growth Rate
        FIG. 133 Neuwall Movable Partition Wall Solution Market Share
        FIG. 134 Market Dynamics
        FIG. 135 Global Glass Partition Wall – Value Chain Analysis
        FIG. 136 Key Mandates and Regulations
        FIG. 137 Technology Roadmap and Timeline
        FIG. 138 Market Attractiveness Analysis – By Types
        FIG. 139 Market Attractiveness Analysis – By Application
        FIG. 140 Market Attractiveness Analysis – By Region
        FIG. 141 Manufacturing Cost Structure of Glass Partition Wall
        FIG. 142 Glass Partition Wall Industrial Chain Analysis
        FIG. 143 Market Channel
        FIG. 144 Marketing Channel Development Trend
        FIG. 145 Growth in World Gross Product, 2008-2019

        List of Tables

        TABLE 1 Global Glass Partition Wall market, 2019 & 2026 (USD Million)
        TABLE 2 Global Glass Partition Wall market, by Types, 2016-2026 (USD Million)
        TABLE 3 Global Glass Partition Wall market, by Types, 2016-2026 (Million Sq. Meters)
        TABLE 4 Global Glass Partition Wall market, by Application, 2016-2026 (USD Million)
        TABLE 5 Global Glass Partition Wall market, by Application, 2016-2026 (Million Sq. Meters)
        TABLE 6 Global Glass Partition Wall market, by region, 2016-2026 (USD Million)
        TABLE 7 Global Glass Partition Wall market, by region, 2016-2026 (Million Sq. Meters)
        TABLE 8 North America Glass Partition Wall Market, by Types, 2016-2026 (USD Million)
        TABLE 9 North America Glass Partition Wall Market, by Types, 2016-2026 (Million Sq. Meters)
        TABLE 10 North America Glass Partition Wall Market, by Application, 2016-2026 (USD Million)
        TABLE 11 North America Glass Partition Wall Market, by Application, 2016-2026 (Million Sq. Meters)
        TABLE 12 Europe Glass Partition Wall Market, by Types, 2016-2026 (USD Million)
        TABLE 13 Europe Glass Partition Wall Market, by Types, 2016-2026 (Million Sq. Meters)
        TABLE 14 Europe Glass Partition Wall Market, by Application, 2016-2026 (USD Million)
        TABLE 15 Europe Glass Partition Wall Market, by Application, 2016-2026 (Million Sq. Meters)
        TABLE 16 Asia Pacific Glass Partition Wall Market, by Types, 2016-2026 (USD Million)
        TABLE 17 Asia Pacific Glass Partition Wall Market, by Types, 2016-2026 (Million Sq. Meters)
        TABLE 18 Asia Pacific Glass Partition Wall Market, by Application, 2016-2026 (USD Million)
        TABLE 19 Asia Pacific Glass Partition Wall Market, by Application, 2016-2026 (Million Sq. Meters)
        TABLE 20 Latin America Glass Partition Wall Market, by Types, 2016-2026 (USD Million)
        TABLE 21 Latin America Glass Partition Wall Market, by Types, 2016-2026 (Million Sq. Meters)
        TABLE 22 Latin America Glass Partition Wall Market, by Application, 2016-2026 (USD Million)
        TABLE 23 Latin America Glass Partition Wall Market, by Application, 2016-2026 (Million Sq. Meters)
        TABLE 24 The Middle-East and Africa Glass Partition Wall Market, by Types, 2016-2026 (USD Million)
        TABLE 25 The Middle-East and Africa Glass Partition Wall Market, by Types, 2016-2026 (Million Sq. Meters)
        TABLE 26 The Middle-East and Africa Glass Partition Wall Market, by Application, 2016-2026 (USD Million)
        TABLE 27 The Middle-East and Africa Glass Partition Wall Market, by Application, 2016-2026 (Million Sq. Meters)
        TABLE 28 North America Glass Partition Wall Production, Consumption, Export, Import, 2016-2019
        TABLE 29 Europe Glass Partition Wall Production, Consumption, Export, Import, 2016-2019
        TABLE 30 Asia Pacific Glass Partition Wall Production, Consumption, Export, Import, 2016-2019
        TABLE 31 Latin America Glass Partition Wall Production, Consumption, Export, Import, 2016-2019
        TABLE 32 Middle East & Africa Glass Partition Wall Production, Consumption, Export, Import, 2016-2019
        TABLE 33 Global Glass Partition Wall Market - Company Revenue Analysis 2016-2019 (USD Million)
        TABLE 34 Global Glass Partition Wall Market - Company Revenue Share Analysis 2016-2019(%)
        TABLE 35 Global Glass Partition Wall Market - Company Volume Analysis 2016-2019 (Million Sq. Meters)
        TABLE 36 Global Glass Partition Wall Market - Company Volume Share Analysis 2016-2019(%)
        TABLE 37 Acquisitions and Mergers
        TABLE 38 New Product/Service Launch
        TABLE 39 Research & Development Activities
        TABLE 40 Market Drivers
        TABLE 41 Market Restraints
        TABLE 42 Market Opportunities
        TABLE 43 Production Base and Market Concentration Rate of Raw Material
        TABLE 44 Key Suppliers of Raw Materials
        TABLE 45 Raw Materials Sources of Glass Partition Wall Major Manufacturers in 2016
        TABLE 46 Major Buyers of Glass Partition Wall
        TABLE 47 Distributors/Traders of Glass Partition Wall by Region
        

Industry Major Market Players

  •  Lindner Group
  •  Optima
  •  Dormakaba
  •  Hufcor
  •  AXIS
  •  Jeld Wen
  •  Maars
  •  IMT
  •  CARVART
  •  Lizzanno Partitions
  •  JEB
  •  Nanawall
  •  Lacantina
  •  Panda
  •  DIRTT Environmental Solutions
  •  CR Laurence
  •  Klein
  •  Apton Partitioning
  •  Interwand (Netherlands)
  •  Clestra Hauserman (France)
  •  Dalai (Hong Kong) Partition Industrial Co.Ltd
  •  U-Team Corporate Office Solution
  •  Obspace Wall Partition Co.Ltd
  •  Halumm (Hangzhou) Furniture Co.Ltd
  •  Avanti Systems USA
  •  Neuwall Movable Partition Wall Solution