Search Market Research Report

Discover Our Latest Reports
Discover Our Featured Reports
Discover Top Selling Reports

Glass Fiber Market Size, Share Global Analysis Report, 2020–2026

report img

Glass Fiber Market By Type (Single-End Roving, Multi-End Roving, Fabrics, Woven Roving, CFM, CSM, CS, DUCS, and Others), Manufacturing Process (Spray Up, Hand Lay-Up, Injection Molding, PrepregLay-Up, Pultrusion, Resin Infusion, Compression Molding, and Others) and By Application (Transportation, Construction, Pipe & Tank, Aerospace, Electrical & Electronics, Wind Energy, Consumer Goods, and Others): Global Industry Outlook, Market Size, Business Intelligence, Consumer Preferences, Statistical Surveys, Comprehensive Analysis, Historical Developments, Current Trends, and Forecast 2020–2026

Industry Insights

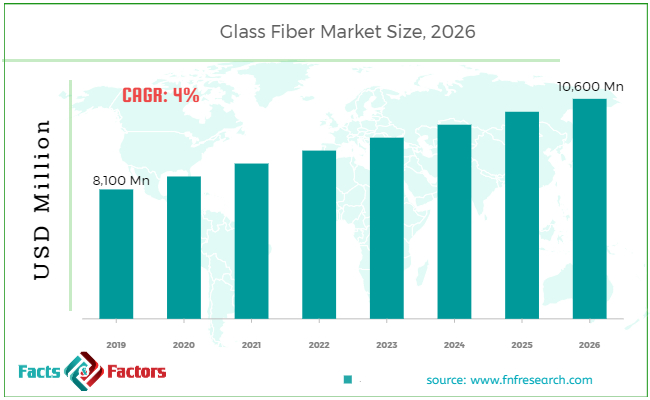
[220+ Pages Report] According to the report published by Facts Factors, the global glass fiber market size was worth around USD 8,100 million in 2019 and is predicted to grow to around USD 10,600 million by 2026 with a compound annual growth rate (CAGR) of roughly 4% between 2020 and 2026. The report analyzes the global glass fiber market drivers, restraints/challenges, and the effect they have on the demands during the projection period. In addition, the report explores emerging opportunities in the glass fiber market.

Glass Fiber Market Size

To know more about this report | Request Free Sample Copy

This specialized and expertise-oriented industry research report scrutinizes the technical and commercial business outlook of the glass fiber industry. The report analyzes and declares the historical and current trends analysis of the glass fiber industry and subsequently recommends the projected trends anticipated to be observed in the glass fiber market during the upcoming years.

The glass fiber market report analyzes and notifies the industry statistics at the global as well as regional and country levels in order to acquire a thorough perspective of the entire glass fiber market. The historical and past insights are provided for FY 2016 to FY 2019 whereas projected trends are delivered for FY 2020 to FY 2026. The quantitative and numerical data is represented in terms of both volume (Kilo Tons) and value (USD Million) from FY 2016 – 2026.


logoKey Insights from Primary Research

  • According to the primary respondents, the global glass fiber market is set to grow annually at a rate of around 4%
  • The market was valued at around USD 8,100 million, in 2019 and is projected to reach around USD 10,600 million, in 2026.
  • In 2019, the “multi-end roving” category dominated the type segmentation of the market and is projected to continue its dominance throughout the forecast period.
  • “Injection molding” category of the manufacturing process is expected to grow significantly during the forecast period owing to its design flexibility, low labor cost, and high-output production rate.
  • Based on the application segmentation, the “transportation and construction” category held a significant share, in 2019.
  • The Asia Pacific accounted for the largest market share of the global glass fiber market, in 2019.

logoKey Recommendations from Analysts

  • As per our analysts, the global glass fiber market is anticipated to witness significant growth in the future. The growing adoption of glass fibers in the transportation and construction sectors is boosting the market growth.
  • The rise in the demand for glass fibers in the automotive industry owing to the lightweight property is expected to offer lucrative growth opportunities in the forecast period.   
  • The Asia Pacific is the potential region for the global glass fibers market. The surging construction industry in emerging countries like India, China, Japan, Philippines, and Indonesia is increasing the demand for glass fiber materials.
  • Growing at a CAGR around 4%, the global glass fibers market provides several opportunities for suppliers and manufacturers.
  • Our analysts have identified “construction” and “transportation” categories are the major consumers of the glass fibers across the globe.
  • The key market players are focusing on product innovation and strategic alliances for increasing their market share in the industry. For instance, Owens Corning has announced that the company will be investing USD 110 million to expand its Compositescapacity in India. Therefore, this investment is expected to grow its glass fiber market in India.

The quantitative data is further underlined and reinforced by comprehensive qualitative data which comprises various across-the-board market dynamics. The rationales which directly or indirectly impact the glass fiber industry are exemplified through parameters such as growth drivers, restraints, challenges, and opportunities among other impacting factors.

Throughout our research report, we have encompassed all the proven models and tools of industry analysis and extensively illustrated all the key business strategies and business models adopted in the glass fiber industry. The report provides an all-inclusive and detailed competitive landscape prevalent in the glass fiber market.

The report utilizes established industry analysis tools and models such as Porter’s Five Forces framework to analyze and recognize critical business strategies adopted by various stakeholders involved in the entire value chain of the glass fiber industry. The glass fiber market report additionally employs SWOT analysis and PESTLE analysis models for further in-depth analysis.

The report study further includes an in-depth analysis of industry players' market shares and provides an overview of leading players' market position in the glass fiber sector. Key strategic developments in the glass fiber market competitive landscape such as acquisitions & mergers, inaugurations of different products and services, partnerships & joint ventures, MoU agreements, VC & funding activities, R&D activities, and geographic expansion among other noteworthy activities by key players of the glass fiber market are appropriately highlighted in the report.

The rapid growth in the construction and transportation industries is the major factor driving the global glass fiber market. The rising construction activities in developing countries like Brazil, China, India, and South Africa is further projected to boost the adoption of glass fiber, thereby propelling the market growth. Moreover, multi-end roving glass fibers are projected to dominate the global glass fiber market owing to the increasing use of this type of fiber in the automotive and construction industry.

The glass fiber market research report delivers an acute valuation and taxonomy of the glass fiber industry by practically splitting the market on the basis of different types, applications, and regions. Through the analysis of the historical and projected trends, all the segments and sub-segments were evaluated through the bottom-up approach, and different market sizes have been projected for FY 2020 to FY 2026. The regional segmentation of the glass fiber industry includes the complete classification of all the major continents including North America, Latin America, Europe, Asia Pacific, and Middle East & Africa. Further, country-wise data for the glass fiber industry is provided for the leading economies of the world.

The glass fiber market is segmented based on Type and Application.  On the basis of type segmentation, the market is classified into single-end roving, multi-end roving, fabrics, woven roving, CFM, CSM, CS, DUCS, and others. Based on the manufacturing process, the market is segregated into spray up, hand lay-up, injection molding, prepreg lay-up, pultrusion, resin infusion, compression molding, and others In terms of Application segmentation, the market is bifurcated into transportation, construction, pipe & tank, aerospace, electrical & electronics, wind energy, consumer goods, and others.

logoReport Scope

Report Attribute

Details

Market Size in 2019

USD 8,100 Million

Projected Market Size in 2026

USD 10,600 Million

CAGR Growth Rate

4% CAGR

Base Year

2021

Forecast Years

2022-2028

Key Market Players

Owens Corning, BGF Industries, Nitto Boseki Co. Ltd., Saint-Gobain Vetrotex, Asahi Glass Company Limited, Johns Manville, Knauf, Jushi Group Co. Ltd., Advanced Glassfiber Yarns LLC, PPG Industries, Chomarat Group, and Nippon Sheet Glass among others.

Key Segment

By Manufacturing Process, By Application, and By Region

Major Regions Covered

North America, Europe, Asia Pacific, Latin America, and the Middle East & Africa

Purchase Options

Request customized purchase options to meet your research needs. Explore purchase options

logoSome of the essential players operating in the glass fiber market, but not restricted to include

  • Owens Corning
  • BGF Industries
  • Nitto Boseki Co. Ltd.
  • Saint-Gobain Vetrotex
  • Asahi Glass Company Limited
  • Johns Manville
  • Knauf
  • Jushi Group Co. Ltd.
  • Advanced Glassfiber Yarns LLC
  • PPG Industries
  • Chomarat Group
  • Nippon Sheet Glass

The taxonomy of the glass fiber market by its scope and segmentation is as follows:

logoBy Product Type Segmentation Analysis

  • Single-End Roving
  • Multi-End Roving
  • Fabrics
  • Woven Roving
  • CFM
  • CSM
  • CS
  • DUCS
  • Others

logoBy Manufacturing ProcessSegmentation Analysis

  • Spray Up
  • Hand Lay-Up
  • Injection Molding
  • Prepreg Lay-Up
  • Pultrusion
  • Resin Infusion
  • Compression Molding
  • Others

logoBy Application Segmentation Analysis

  • Transportation
  • Construction
  • Pipe & Tank
  • Aerospace
  • Electrical & Electronics
  • Wind Energy
  • Consumer Goods
  • Others

logoBy Regional Segmentation Analysis

  • North America
    • The U.S.
    • Canada
  • Europe
    • Germany
    • The UK
    • France
    • Spain
    • Italy
    • Rest of Europe
  • Asia Pacific
    • China
    • Japan
    • India
    • South Korea
    • Southeast Asia
    • Rest of Asia Pacific
  • Latin America
    • Brazil
    • Mexico
    • Rest of Latin America
  • Middle East & Africa
    • GCC
    • South Africa
    • Rest of Middle East & Africa

Table of Content

  1. CHAPTER 1. Executive Summary
  2. CHAPTER 2. Glass Fiber market – Product Type Analysis
    1. 2.1. Global Glass Fiber Market – Product Type Overview
    2. 2.2. Global Glass Fiber Market Share, by Product Type, 2019 & 2026 (USD Million)
    3. 2.3. Global Glass Fiber Market share, by Product Type, 2019 & 2026 (Kilo Tons)
    4. 2.4. Single-End Roving
      1. 2.4.1. Global Single-End Roving Glass Fiber Market, 2016-2026 (USD Million)
      2. 2.4.2. Global Single-End Roving Glass Fiber Market, 2016-2026 (Kilo Tons)
    5. 2.5. Multi-End Roving
      1. 2.5.1. Global Multi-End Roving Glass Fiber Market, 2016-2026 (USD Million)
      2. 2.5.2. Global Multi-End Roving Glass Fiber Market, 2016-2026 (Kilo Tons)
    6. 2.6. Fabrics
      1. 2.6.1. Global Fabrics Glass Fiber Market, 2016-2026 (USD Million)
      2. 2.6.2. Global Fabrics Glass Fiber Market, 2016-2026 (Kilo Tons)
    7. 2.7. Woven Roving
      1. 2.7.1. Global Woven Roving Glass Fiber Market, 2016-2026 (USD Million)
      2. 2.7.2. Global Woven Roving Glass Fiber Market, 2016-2026 (Kilo Tons)
    8. 2.8. CFM
      1. 2.8.1. Global CFM Glass Fiber Market, 2016-2026 (USD Million)
      2. 2.8.2. Global CFM Glass Fiber Market, 2016-2026 (Kilo Tons)
    9. 2.9. CSM
      1. 2.9.1. Global CSM Glass Fiber Market, 2016-2026 (USD Million)
      2. 2.9.2. Global CSM Glass Fiber Market, 2016-2026 (Kilo Tons)
    10. 2.10. CS
      1. 2.10.1. Global CS Glass Fiber Market, 2016-2026 (USD Million)
      2. 2.10.2. Global CS Glass Fiber Market, 2016-2026 (Kilo Tons)
    11. 2.11. DUCS
      1. 2.11.1. Global DUCS Glass Fiber Market, 2016-2026 (USD Million)
      2. 2.11.2. Global DUCS Glass Fiber Market, 2016-2026 (Kilo Tons)
    12. 2.12. Others
      1. 2.12.1. Global Others Glass Fiber Market, 2016-2026 (USD Million)
      2. 2.12.2. Global Others Glass Fiber Market, 2016-2026 (Kilo Tons)
  3. CHAPTER 3. Glass Fiber market – Manufacturing Process Analysis
    1. 3.1. Global Glass Fiber Market – Manufacturing Process Overview
    2. 3.2. Global Glass Fiber Market Share, by Manufacturing Process, 2019 & 2026 (USD Million)
    3. 3.3. Global Glass Fiber Market share, by Manufacturing Process, 2019 & 2026 (Kilo Tons)
    4. 3.4. Spray Up
      1. 3.4.1. Global Spray Up Glass Fiber Market, 2016-2026 (USD Million)
      2. 3.4.2. Global Spray Up Glass Fiber Market, 2016-2026 (Kilo Tons)
    5. 3.5. Hand Lay-Up
      1. 3.5.1. Global Hand Lay-Up Glass Fiber Market, 2016-2026 (USD Million)
      2. 3.5.2. Global Hand Lay-Up Glass Fiber Market, 2016-2026 (Kilo Tons)
    6. 3.6. Injection Molding
      1. 3.6.1. Global Injection Molding Glass Fiber Market, 2016-2026 (USD Million)
      2. 3.6.2. Global Injection Molding Glass Fiber Market, 2016-2026 (Kilo Tons)
    7. 3.7. Prepreg Lay-Up
      1. 3.7.1. Global Prepreg Lay-Up Glass Fiber Market, 2016-2026 (USD Million)
      2. 3.7.2. Global Prepreg Lay-Up Glass Fiber Market, 2016-2026 (Kilo Tons)
    8. 3.8. Pultrusion
      1. 3.8.1. Global Pultrusion Glass Fiber Market, 2016-2026 (USD Million)
      2. 3.8.2. Global Pultrusion Glass Fiber Market, 2016-2026 (Kilo Tons)
    9. 3.9. Resin Infusion
      1. 3.9.1. Global Resin Infusion Glass Fiber Market, 2016-2026 (USD Million)
      2. 3.9.2. Global Resin Infusion Glass Fiber Market, 2016-2026 (Kilo Tons)
    10. 3.10. Compression Molding
      1. 3.10.1. Global Compression Molding Glass Fiber Market, 2016-2026 (USD Million)
      2. 3.10.2. Global Compression Molding Glass Fiber Market, 2016-2026 (Kilo Tons)
    11. 3.11. Others
      1. 3.11.1. Global Others Glass Fiber Market, 2016-2026 (USD Million)
      2. 3.11.2. Global Others Glass Fiber Market, 2016-2026 (Kilo Tons)
  4. CHAPTER 4. Glass Fiber market – Application Analysis
    1. 4.1. Global Glass Fiber Market – Application Overview
    2. 4.2. Global Glass Fiber Market Share, by Application, 2019 & 2026 (USD Million)
    3. 4.3. Global Glass Fiber Market share, by Application, 2019 & 2026 (Kilo Tons)
    4. 4.4. Transportation
      1. 4.4.1. Global Transportation Glass Fiber Market, 2016-2026 (USD Million)
      2. 4.4.2. Global Transportation Glass Fiber Market, 2016-2026 (Kilo Tons)
    5. 4.5. Construction
      1. 4.5.1. Global Construction Glass Fiber Market, 2016-2026 (USD Million)
      2. 4.5.2. Global Construction Glass Fiber Market, 2016-2026 (Kilo Tons)
    6. 4.6. Pipe & Tank
      1. 4.6.1. Global Pipe & Tank Glass Fiber Market, 2016-2026 (USD Million)
      2. 4.6.2. Global Pipe & Tank Glass Fiber Market, 2016-2026 (Kilo Tons)
    7. 4.7. Aerospace
      1. 4.7.1. Global Aerospace Glass Fiber Market, 2016-2026 (USD Million)
      2. 4.7.2. Global Aerospace Glass Fiber Market, 2016-2026 (Kilo Tons)
    8. 4.8. Electrical & Electronics
      1. 4.8.1. Global Electrical & Electronics Glass Fiber Market, 2016-2026 (USD Million)
      2. 4.8.2. Global Electrical & Electronics Glass Fiber Market, 2016-2026 (Kilo Tons)
    9. 4.9. Wind Energy
      1. 4.9.1. Global Wind Energy Glass Fiber Market, 2016-2026 (USD Million)
      2. 4.9.2. Global Wind Energy Glass Fiber Market, 2016-2026 (Kilo Tons)
    10. 4.10. Consumer Goods
      1. 4.10.1. Global Consumer Goods Glass Fiber Market, 2016-2026 (USD Million)
      2. 4.10.2. Global Consumer Goods Glass Fiber Market, 2016-2026 (Kilo Tons)
    11. 4.11. Others
      1. 4.11.1. Global Others Glass Fiber Market, 2016-2026 (USD Million)
      2. 4.11.2. Global Others Glass Fiber Market, 2016-2026 (Kilo Tons)
  5. CHAPTER 5. Glass Fiber market – Regional Analysis
    1. 5.1. Global Glass Fiber Market Regional Overview
    2. 5.2. Global Glass Fiber Market Share, by Region, 2019 & 2026 (Value)
    3. 5.3. Global Glass Fiber Market Share, by Region, 2019 & 2026 (Volume)
    4. 5.4. North America
      1. 5.4.1. North America Glass Fiber Market size and forecast, 2016-2026
      2. 5.4.2. North America Glass Fiber Market, by Country, 2016-2026 (USD Million)
      3. 5.4.3. North America Market size and forecast, 2016-2026 (Kilo Tons)
      4. 5.4.4. North America Glass Fiber Market, by Country, 2016-2026 (Kilo Tons)
      5. 5.4.5. North America Glass Fiber Market, by Product Type, 2016-2026
      6. 5.4.6. North America Glass Fiber Market, by Manufacturing Process, 2016-2026
      7. 5.4.7. North America Glass Fiber Market, by Application, 2016-2026
      8. 5.4.8. U.S.
      9. 5.4.9. Canada
    5. 5.5. Europe
      1. 5.5.1. Europe Glass Fiber Market size and forecast, 2016-2026
      2. 5.5.2. Europe Glass Fiber Market, by Country, 2016-2026 (USD Million)
      3. 5.5.3. Europe Market size and forecast, 2016-2026 (Kilo Tons)
      4. 5.5.4. Europe Glass Fiber Market, by Country, 2016-2026 (Kilo Tons)
      5. 5.5.5. Europe Glass Fiber Market, by Product Type, 2016-2026
      6. 5.5.6. Europe Glass Fiber Market, by Manufacturing Process, 2016-2026
      7. 5.5.7. Europe Glass Fiber Market, by Application, 2016-2026
      8. 5.5.8. Germany
      9. 5.5.9. France
      10. 5.5.10. U.K.
      11. 5.5.11. Italy
      12. 5.5.12. Spain
      13. 5.5.13. Rest of Europe
    6. 5.6. Asia Pacific
      1. 5.6.1. Asia Pacific Glass Fiber Market size and forecast, 2016-2026
      2. 5.6.2. Asia Pacific Glass Fiber Market, by Country, 2016-2026 (USD Million)
      3. 5.6.3. Asia Pacific Market size and forecast, 2016-2026 (Kilo Tons)
      4. 5.6.4. Asia Pacific Glass Fiber Market, by Country, 2016-2026 (Kilo Tons)
      5. 5.6.5. Asia Pacific Glass Fiber Market, by Product Type, 2016-2026
      6. 5.6.6. Asia Pacific Glass Fiber Market, by Manufacturing Process, 2016-2026
      7. 5.6.7. Asia Pacific Glass Fiber Market, by Application, 2016-2026
      8. 5.6.8. China
      9. 5.6.9. Japan
      10. 5.6.10. India
      11. 5.6.11. South Korea
      12. 5.6.12. South-East Asia
      13. 5.6.13. Rest of Asia Pacific
    7. 5.7. Latin America
      1. 5.7.1. Latin America Glass Fiber Market size and forecast, 2016-2026
      2. 5.7.2. Latin America Glass Fiber Market, by Country, 2016-2026 (USD Million)
      3. 5.7.3. Latin America Market size and forecast, 2016-2026 (Kilo Tons)
      4. 5.7.4. Latin America Glass Fiber Market, by Country, 2016-2026 (Kilo Tons)
      5. 5.7.5. Latin America Glass Fiber Market, by Product Type, 2016-2026
      6. 5.7.6. Latin America Glass Fiber Market, by Manufacturing Process, 2016-2026
      7. 5.7.7. Latin America Glass Fiber Market, by Application, 2016-2026
      8. 5.7.8. Brazil
      9. 5.7.9. Mexico
      10. 5.7.10. Rest of Latin America
    8. 5.8. The Middle-East and Africa
      1. 5.8.1. The Middle-East and Africa Glass Fiber Market size and forecast, 2016-2026
      2. 5.8.2. The Middle-East and Africa Glass Fiber Market, by Country, 2016-2026 (USD Million)
      3. 5.8.3. The Middle-East and Africa Market size and forecast, 2016-2026 (Kilo Tons)
      4. 5.8.4. The Middle-East and Africa Glass Fiber Market, by Country, 2016-2026 (Kilo Tons)
      5. 5.8.5. The Middle-East and Africa Glass Fiber Market, by Product Type, 2016-2026
      6. 5.8.6. The Middle-East and Africa Glass Fiber Market, by Manufacturing Process, 2016-2026
      7. 5.8.7. The Middle-East and Africa Glass Fiber Market, by Application, 2016-2026
      8. 5.8.8. GCC Countries
      9. 5.8.9. South Africa
      10. 5.8.10. Rest of Middle-East Africa
  6. CHAPTER 6. Glass Fiber Production, Consumption, Export, Import by Regions
    1. 6.1. Global Glass Fiber production and revenue, 2016-2026 (USD Million) (Kilo Tons)
    2. 6.2. Global Import and Export Analysis, by Region
  7. CHAPTER 7. Glass Fiber market – Competitive Landscape
    1. 7.1. Competitor Market Share – Revenue
    2. 7.2. Market Concentration Rate Analysis, Top 3 and Top 5 Players
    3. 7.3. Competitor Market Share – Volume
    4. 7.4. Strategic Development
      1. 7.4.1. Acquisitions and Mergers
      2. 7.4.2. New Products
      3. 7.4.3. Research & Development Activities
  8. CHAPTER 8. Company Profiles
    1. 8.1. Owens Corning
      1. 8.1.1. Company Overview
      2. 8.1.2. Owens Corning Sales, Revenue, Price, and Gross Margin
      3. 8.1.3. Product portfolio
      4. 8.1.4. Recent initiatives
    2. 8.2. BGF Industries
      1. 8.2.1. Company Overview
      2. 8.2.2. BGF Industries Sales, Revenue, Price, and Gross Margin
      3. 8.2.3. Product portfolio
      4. 8.2.4. Recent initiatives
    3. 8.3. Saint-Gobain Vetrotex
      1. 8.3.1. Company Overview
      2. 8.3.2. Saint-Gobain Vetrotex Sales, Revenue, Price, and Gross Margin
      3. 8.3.3. Product portfolio
      4. 8.3.4. Recent initiatives
    4. 8.4. Asahi Glass Company Limited
      1. 8.4.1. Company Overview
      2. 8.4.2. Asahi Glass Company Limited Sales, Revenue, Price, and Gross Margin
      3. 8.4.3. Product portfolio
      4. 8.4.4. Recent initiatives
    5. 8.5. Knauf
      1. 8.5.1. Company Overview
      2. 8.5.2. Knauf Sales, Revenue, Price, and Gross Margin
      3. 8.5.3. Product portfolio
      4. 8.5.4. Recent initiatives
    6. 8.6. Jushi Group Co. Ltd.
      1. 8.6.1. Company Overview
      2. 8.6.2. Jushi Group Co. Ltd. Sales, Revenue, Price, and Gross Margin
      3. 8.6.3. Product portfolio
      4. 8.6.4. Recent initiatives
    7. 8.7. Advanced Glassfiber Yarns LLC
      1. 8.7.1. Company Overview
      2. 8.7.2. Advanced Glassfiber Yarns LLC Sales, Revenue, Price, and Gross Margin
      3. 8.7.3. Product portfolio
      4. 8.7.4. Recent initiatives
    8. 8.8. PPG Industries
      1. 8.8.1. Company Overview
      2. 8.8.2. PPG Industries Sales, Revenue, Price, and Gross Margin
      3. 8.8.3. Product portfolio
      4. 8.8.4. Recent initiatives
    9. 8.9. Chomarat Group
      1. 8.9.1. Company Overview
      2. 8.9.2. Chomarat Group Sales, Revenue, Price, and Gross Margin
      3. 8.9.3. Product portfolio
      4. 8.9.4. Recent initiatives
    10. 8.10. Johns Manville
      1. 8.10.1. Company Overview
      2. 8.10.2. Johns Manville Sales, Revenue, Price, and Gross Margin
      3. 8.10.3. Product portfolio
      4. 8.10.4. Recent initiatives
    11. 8.11. Nitto Boseki Co. Ltd.
      1. 8.11.1. Company Overview
      2. 8.11.2. Nitto Boseki Co. Ltd. Sales, Revenue, Price, and Gross Margin
      3. 8.11.3. Product portfolio
      4. 8.11.4. Recent initiatives
    12. 8.12. Nippon Sheet Glass
      1. 8.12.1. Company Overview
      2. 8.12.2. Nippon Sheet Glass Sales, Revenue, Price, and Gross Margin
      3. 8.12.3. Product portfolio
      4. 8.12.4. Recent initiatives
    13. 8.13. Others
      1. 8.13.1. Company Overview
      2. 8.13.2. Others Sales, Revenue, Price, and Gross Margin
      3. 8.13.3. Product portfolio
      4. 8.13.4. Recent initiatives
  9. CHAPTER 9. Glass Fiber — Industry Analysis
    1. 9.1. Introduction and Taxonomy
    2. 9.2. Glass Fiber Market – Key Trends
      1. 9.2.1. Market Drivers
      2. 9.2.2. Market Restraints
      3. 9.2.3. Market Opportunities
    3. 9.3. Value Chain Analysis
    4. 9.4. Key Mandates and Regulations
    5. 9.5. Technology Roadmap and Timeline
    6. 9.6. Glass Fiber market – Attractiveness Analysis
      1. 9.6.1. By Product Type
      2. 9.6.2. By Manufacturing Process
      3. 9.6.3. By Application
      4. 9.6.4. By Region
  10. CHAPTER 10. Raw Material analysis
    1. 10.1. Glass Fiber Key Raw Material Analysis
      1. 10.1.1. Key Raw Materials
      2. 10.1.2. Price Trend of Key Raw Materials
    2. 10.2. Key Suppliers of Raw Materials
    3. 10.3. Proportion of Manufacturing Cost Structure
      1. 10.3.1. Raw Materials
      2. 10.3.2. Labor Cost
    4. 10.4. Manufacturing Expenses Analysis of Glass Fiber
  11. CHAPTER 11. Industrial Chain, Sourcing Strategy and Downstream Buyers
    1. 11.1. Glass Fiber Industrial Chain Analysis
    2. 11.2. Upstream Raw Materials Sourcing
      1. 11.2.1. Risk Mitigation:
      2. 11.2.2. Supplier Relationships:
      3. 11.2.3. Business Processes:
      4. 11.2.4. Securing the Product:
    3. 11.3. Raw Materials Sources of Glass Fiber Major Manufacturers in 2016
    4. 11.4. Downstream Buyers
    5. 11.5. Distributors/Traders List
  12. CHAPTER 12. Marketing Strategy Analysis, Distributors
    1. 12.1. Marketing Channel
    2. 12.2. Direct Marketing
    3. 12.3. Indirect Marketing
    4. 12.4. Marketing Channel Development Trend
    5. 12.5. Economic/Political Environmental Change
  13. CHAPTER 13. Report Conclusion
  14. CHAPTER 14. Research Approach & Methodology
    1. 14.1. Report Description
    2. 14.2. Research Scope
    3. 14.3. Research Methodology
      1. 14.3.1. Secondary Research
      2. 14.3.2. Primary Research
      3. 14.3.3. Models

      List of Figures

      FIG. 1 Global Glass Fiber Market, 2016-2026 (USD Million)
      FIG. 2 Global Glass Fiber Market Share, by Product Type, 2019 & 2026 (USD Million)
      FIG. 3 Global Glass Fiber Market share, by Product Type, 2019 & 2026 (Kilo Tons)
      FIG. 4 Global Single-End Roving Glass Fiber Market, 2016-2026 (USD Million)
      FIG. 5 Global Single-End Roving Glass Fiber  Market, 2016-2026 (Kilo Tons)
      FIG. 6 Global Multi-End Roving Glass Fiber Market, 2016-2026 (USD Million)
      FIG. 7 Global Multi-End Roving Glass Fiber  Market, 2016-2026 (Kilo Tons)
      FIG. 8 Global Fabrics Glass Fiber Market, 2016-2026 (USD Million)
      FIG. 9 Global Fabrics Glass Fiber  Market, 2016-2026 (Kilo Tons)
      FIG. 10 Global Woven Roving Glass Fiber Market, 2016-2026 (USD Million)
      FIG. 11 Global Woven Roving Glass Fiber  Market, 2016-2026 (Kilo Tons)
      FIG. 12 Global CFM Glass Fiber Market, 2016-2026 (USD Million)
      FIG. 13 Global CFM Glass Fiber  Market, 2016-2026 (Kilo Tons)
      FIG. 14 Global CSM Glass Fiber Market, 2016-2026 (USD Million)
      FIG. 15 Global CSM Glass Fiber  Market, 2016-2026 (Kilo Tons)
      FIG. 16 Global CS Glass Fiber Market, 2016-2026 (USD Million)
      FIG. 17 Global CS Glass Fiber  Market, 2016-2026 (Kilo Tons)
      FIG. 18 Global DUCS Glass Fiber Market, 2016-2026 (USD Million)
      FIG. 19 Global DUCS Glass Fiber  Market, 2016-2026 (Kilo Tons)
      FIG. 20 Global Others Glass Fiber Market, 2016-2026 (USD Million)
      FIG. 21 Global Others Glass Fiber  Market, 2016-2026 (Kilo Tons)
      FIG. 22 Global Glass Fiber Market Share, by Manufacturing Process, 2019 & 2026 (USD Million)
      FIG. 23 Global Glass Fiber Market share, by Manufacturing Process, 2019 & 2026 (Kilo Tons)
      FIG. 24 Global Spray Up Glass Fiber Market, 2016-2026 (USD Million)
      FIG. 25 Global Spray Up Glass Fiber  Market, 2016-2026 (Kilo Tons)
      FIG. 26 Global Hand Lay-Up Glass Fiber Market, 2016-2026 (USD Million)
      FIG. 27 Global Hand Lay-Up Glass Fiber  Market, 2016-2026 (Kilo Tons)
      FIG. 28 Global Injection Molding Glass Fiber Market, 2016-2026 (USD Million)
      FIG. 29 Global Injection Molding Glass Fiber  Market, 2016-2026 (Kilo Tons)
      FIG. 30 Global Prepreg Lay-Up Glass Fiber Market, 2016-2026 (USD Million)
      FIG. 31 Global Prepreg Lay-Up Glass Fiber  Market, 2016-2026 (Kilo Tons)
      FIG. 32 Global Pultrusion Glass Fiber Market, 2016-2026 (USD Million)
      FIG. 33 Global Pultrusion Glass Fiber  Market, 2016-2026 (Kilo Tons)
      FIG. 34 Global Resin Infusion Glass Fiber Market, 2016-2026 (USD Million)
      FIG. 35 Global Resin Infusion Glass Fiber  Market, 2016-2026 (Kilo Tons)
      FIG. 36 Global Compression Molding Glass Fiber Market, 2016-2026 (USD Million)
      FIG. 37 Global Compression Molding Glass Fiber  Market, 2016-2026 (Kilo Tons)
      FIG. 38 Global Others Glass Fiber Market, 2016-2026 (USD Million)
      FIG. 39 Global Others Glass Fiber  Market, 2016-2026 (Kilo Tons)
      FIG. 40 Global Glass Fiber Market Share, by Application, 2019 & 2026 (USD Million)
      FIG. 41 Global Glass Fiber Market share, by Application, 2019 & 2026 (Kilo Tons)
      FIG. 42 Global Transportation Glass Fiber Market, 2016-2026 (USD Million)
      FIG. 43 Global Transportation Glass Fiber  Market, 2016-2026 (Kilo Tons)
      FIG. 44 Global Construction Glass Fiber Market, 2016-2026 (USD Million)
      FIG. 45 Global Construction Glass Fiber  Market, 2016-2026 (Kilo Tons)
      FIG. 46 Global Pipe & Tank Glass Fiber Market, 2016-2026 (USD Million)
      FIG. 47 Global Pipe & Tank Glass Fiber  Market, 2016-2026 (Kilo Tons)
      FIG. 48 Global Aerospace Glass Fiber Market, 2016-2026 (USD Million)
      FIG. 49 Global Aerospace Glass Fiber  Market, 2016-2026 (Kilo Tons)
      FIG. 50 Global Electrical & Electronics Glass Fiber Market, 2016-2026 (USD Million)
      FIG. 51 Global Electrical & Electronics Glass Fiber  Market, 2016-2026 (Kilo Tons)
      FIG. 52 Global Wind Energy Glass Fiber Market, 2016-2026 (USD Million)
      FIG. 53 Global Wind Energy Glass Fiber  Market, 2016-2026 (Kilo Tons)
      FIG. 54 Global Consumer Goods Glass Fiber Market, 2016-2026 (USD Million)
      FIG. 55 Global Consumer Goods Glass Fiber  Market, 2016-2026 (Kilo Tons)
      FIG. 56 Global Others Glass Fiber Market, 2016-2026 (USD Million)
      FIG. 57 Global Others Glass Fiber  Market, 2016-2026 (Kilo Tons)
      FIG. 58 Global Glass Fiber Market Share, by Region, 2019 & 2026
      FIG. 59 Global Glass Fiber Market Share, by Region, 2019 & 2026
      FIG. 60 North America Glass Fiber Market, 2016-2026
      FIG. 61 North America Glass Fiber  Market, 2016-2026 (Kilo Tons)
      FIG. 62 U.S. Glass Fiber Market, 2016-2026
      FIG. 63 U.S. Glass Fiber  Market, 2016-2026 (Kilo Tons)
      FIG. 64 Canada Glass Fiber Market, 2016-2026
      FIG. 65 Canada Glass Fiber  Market, 2016-2026 (Kilo Tons)
      FIG. 66 Europe Glass Fiber Market, 2016-2026
      FIG. 67 Europe Glass Fiber  Market, 2016-2026 (Kilo Tons)
      FIG. 68 Germany Glass Fiber Market, 2016-2026
      FIG. 69 Germany Glass Fiber  Market, 2016-2026 (Kilo Tons)
      FIG. 70 France Glass Fiber Market, 2016-2026
      FIG. 71 France Glass Fiber  Market, 2016-2026 (Kilo Tons)
      FIG. 72 U.K. Glass Fiber Market, 2016-2026
      FIG. 73 U.K. Glass Fiber  Market, 2016-2026 (Kilo Tons)
      FIG. 74 Italy Glass Fiber Market, 2016-2026
      FIG. 75 Italy Glass Fiber  Market, 2016-2026 (Kilo Tons)
      FIG. 76 Spain Glass Fiber Market, 2016-2026
      FIG. 77 Spain Glass Fiber  Market, 2016-2026 (Kilo Tons)
      FIG. 78 Rest of Europe Glass Fiber Market, 2016-2026
      FIG. 79 Rest of Europe Glass Fiber  Market, 2016-2026 (Kilo Tons)
      FIG. 80 Asia Pacific Glass Fiber Market, 2016-2026
      FIG. 81 Asia Pacific Glass Fiber  Market, 2016-2026 (Kilo Tons)
      FIG. 82 China Glass Fiber Market, 2016-2026
      FIG. 83 China Glass Fiber  Market, 2016-2026 (Kilo Tons)
      FIG. 84 Japan Glass Fiber Market, 2016-2026
      FIG. 85 Japan Glass Fiber  Market, 2016-2026 (Kilo Tons)
      FIG. 86 India Glass Fiber Market, 2016-2026
      FIG. 87 India Glass Fiber  Market, 2016-2026 (Kilo Tons)
      FIG. 88 South  Korea Glass Fiber Market, 2016-2026
      FIG. 89 South  Korea Glass Fiber  Market, 2016-2026 (Kilo Tons)
      FIG. 90 South-East Asia Glass Fiber Market, 2016-2026
      FIG. 91 South-East Asia Glass Fiber  Market, 2016-2026 (Kilo Tons)
      FIG. 92 Rest of Asia Pacific Glass Fiber Market, 2016-2026
      FIG. 93 Rest of Asia Pacific Glass Fiber  Market, 2016-2026 (Kilo Tons)
      FIG. 94 Latin America Glass Fiber Market, 2016-2026
      FIG. 95 Latin America Glass Fiber  Market, 2016-2026 (Kilo Tons)
      FIG. 96 Brazil Glass Fiber Market, 2016-2026
      FIG. 97 Brazil Glass Fiber  Market, 2016-2026 (Kilo Tons)
      FIG. 98 Mexico Glass Fiber Market, 2016-2026
      FIG. 99 Mexico Glass Fiber  Market, 2016-2026 (Kilo Tons)
      FIG. 100 Rest of Latin America Glass Fiber Market, 2016-2026
      FIG. 101 Rest of Latin America Glass Fiber  Market, 2016-2026 (Kilo Tons)
      FIG. 102 The Middle-East and Africa Glass Fiber Market, 2016-2026
      FIG. 103 The Middle-East and Africa Glass Fiber  Market, 2016-2026 (Kilo Tons)
      FIG. 104 GCC Countries Glass Fiber Market, 2016-2026
      FIG. 105 GCC Countries Glass Fiber  Market, 2016-2026 (Kilo Tons)
      FIG. 106 South Africa Glass Fiber Market, 2016-2026
      FIG. 107 South Africa Glass Fiber  Market, 2016-2026 (Kilo Tons)
      FIG. 108 Rest of Middle-East Africa Glass Fiber Market, 2016-2026
      FIG. 109 Rest of Middle-East Africa Glass Fiber  Market, 2016-2026 (Kilo Tons)
      FIG. 110 Global Glass Fiber production and revenue, 2016-2026 (USD Million) (Kilo Tons)
      FIG. 111 North America Glass Fiber production and revenue, 2016-2026 (USD Million) (Kilo Tons)
      FIG. 112 Europe Glass Fiber production and revenue, 2016-2026 (USD Million) (Kilo Tons)
      FIG. 113 Asia Pacific Glass Fiber production and revenue, 2016-2026 (USD Million) (Kilo Tons)
      FIG. 114 Latin America Glass Fiber production and revenue, 2016-2026 (USD Million) (Kilo Tons)
      FIG. 115 Middle East and Africa Glass Fiber production and revenue, 2016-2026 (USD Million) (Kilo Tons)
      FIG. 116 Competitor Market Share – Revenue
      FIG. 117 Competitor Market Share – Volume
      FIG. 118 Owens Corning Revenue and Growth Rate
      FIG. 119 Owens Corning Market Share
      FIG. 120 BGF Industries Revenue and Growth Rate
      FIG. 121 BGF Industries Market Share
      FIG. 122 Saint-Gobain Vetrotex Revenue and Growth Rate
      FIG. 123 Saint-Gobain Vetrotex Market Share
      FIG. 124 Asahi Glass Company Limited Revenue and Growth Rate
      FIG. 125 Asahi Glass Company Limited Market Share
      FIG. 126 Knauf Revenue and Growth Rate
      FIG. 127 Knauf Market Share
      FIG. 128 Jushi Group Co. Ltd. Revenue and Growth Rate
      FIG. 129 Jushi Group Co. Ltd. Market Share
      FIG. 130 Advanced Glassfiber Yarns LLC Revenue and Growth Rate
      FIG. 131 Advanced Glassfiber Yarns LLC Market Share
      FIG. 132 PPG Industries Revenue and Growth Rate
      FIG. 133 PPG Industries Market Share
      FIG. 134 Chomarat Group Revenue and Growth Rate
      FIG. 135 Chomarat Group Market Share
      FIG. 136 Johns Manville Revenue and Growth Rate
      FIG. 137 Johns Manville Market Share
      FIG. 138 Nitto Boseki Co. Ltd. Revenue and Growth Rate
      FIG. 139 Nitto Boseki Co. Ltd. Market Share
      FIG. 140 Nippon Sheet Glass Revenue and Growth Rate
      FIG. 141 Nippon Sheet Glass Market Share
      FIG. 142 Others Revenue and Growth Rate
      FIG. 143 Others Market Share
      FIG. 144 Market Dynamics
      FIG. 145 Global Glass Fiber – Value Chain Analysis
      FIG. 146 Key Mandates and Regulations
      FIG. 147 Technology Roadmap and Timeline
      FIG. 148 Market Attractiveness Analysis – By Product Type
      FIG. 149 Market Attractiveness Analysis – By Manufacturing Process
      FIG. 150 Market Attractiveness Analysis – By Application
      FIG. 151 Market Attractiveness Analysis – By Region
      FIG. 152 Manufacturing Cost Structure of Glass Fiber
      FIG. 153 Glass Fiber Industrial Chain Analysis
      FIG. 154 Market Channel
      FIG. 155 Marketing Channel Development Trend
      FIG. 156 Growth in World Gross Product, 2008-2018

      List of Tables

      TABLE 1 Global Glass Fiber market, 2019 & 2026 (USD Million)
      TABLE 2 Global Glass Fiber market, by Product Type, 2016-2026 (USD Million)
      TABLE 3 Global Glass Fiber market, by Product Type, 2016-2026 (Kilo Tons)
      TABLE 4 Global Glass Fiber market, by Manufacturing Process, 2016-2026 (USD Million)
      TABLE 5 Global Glass Fiber market, by Manufacturing Process, 2016-2026 (Kilo Tons)
      TABLE 6 Global Glass Fiber market, by Application, 2016-2026 (USD Million)
      TABLE 7 Global Glass Fiber market, by Application, 2016-2026 (Kilo Tons)
      TABLE 8 Global Glass Fiber market, by region, 2016-2026 (USD Million)
      TABLE 9 Global Glass Fiber market, by region, 2016-2026 (Kilo Tons)
      TABLE 10 North America Glass Fiber Market, by Product Type, 2016-2026 (USD Million)
      TABLE 11 North America Glass Fiber Market, by Product Type, 2016-2026 (Kilo Tons)
      TABLE 12 North America Glass Fiber Market, by Manufacturing Process, 2016-2026 (USD Million)
      TABLE 13 North America Glass Fiber Market, by Manufacturing Process, 2016-2026 (Kilo Tons)
      TABLE 14 North America Glass Fiber Market, by Application, 2016-2026 (USD Million)
      TABLE 15 North America Glass Fiber Market, by Application, 2016-2026 (Kilo Tons)
      TABLE 16 Europe Glass Fiber Market, by Product Type, 2016-2026 (USD Million)
      TABLE 17 Europe Glass Fiber Market, by Product Type, 2016-2026 (Kilo Tons)
      TABLE 18 Europe Glass Fiber Market, by Manufacturing Process, 2016-2026 (USD Million)
      TABLE 19 Europe Glass Fiber Market, by Manufacturing Process, 2016-2026 (Kilo Tons)
      TABLE 20 Europe Glass Fiber Market, by Application, 2016-2026 (USD Million)
      TABLE 21 Europe Glass Fiber Market, by Application, 2016-2026 (Kilo Tons)
      TABLE 22 Asia Pacific Glass Fiber Market, by Product Type, 2016-2026 (USD Million)
      TABLE 23 Asia Pacific Glass Fiber Market, by Product Type, 2016-2026 (Kilo Tons)
      TABLE 24 Asia Pacific Glass Fiber Market, by Manufacturing Process, 2016-2026 (USD Million)
      TABLE 25 Asia Pacific Glass Fiber Market, by Manufacturing Process, 2016-2026 (Kilo Tons)
      TABLE 26 Asia Pacific Glass Fiber Market, by Application, 2016-2026 (USD Million)
      TABLE 27 Asia Pacific Glass Fiber Market, by Application, 2016-2026 (Kilo Tons)
      TABLE 28 Latin America Glass Fiber Market, by Product Type, 2016-2026 (USD Million)
      TABLE 29 Latin America Glass Fiber Market, by Product Type, 2016-2026 (Kilo Tons)
      TABLE 30 Latin America Glass Fiber Market, by Manufacturing Process, 2016-2026 (USD Million)
      TABLE 31 Latin America Glass Fiber Market, by Manufacturing Process, 2016-2026 (Kilo Tons)
      TABLE 32 Latin America Glass Fiber Market, by Application, 2016-2026 (USD Million)
      TABLE 33 Latin America Glass Fiber Market, by Application, 2016-2026 (Kilo Tons)
      TABLE 34 The Middle-East and Africa Glass Fiber Market, by Product Type, 2016-2026 (USD Million)
      TABLE 35 The Middle-East and Africa Glass Fiber Market, by Product Type, 2016-2026 (Kilo Tons)
      TABLE 36 The Middle-East and Africa Glass Fiber Market, by Manufacturing Process, 2016-2026 (USD Million)
      TABLE 37 The Middle-East and Africa Glass Fiber Market, by Manufacturing Process, 2016-2026 (Kilo Tons)
      TABLE 38 The Middle-East and Africa Glass Fiber Market, by Application, 2016-2026 (USD Million)
      TABLE 39 The Middle-East and Africa Glass Fiber Market, by Application, 2016-2026 (Kilo Tons)
      TABLE 40 North America Glass Fiber Production, Consumption, Export, Import, 2016-2019
      TABLE 41 Europe Glass Fiber Production, Consumption, Export, Import, 2016-2019
      TABLE 42 Asia Pacific Glass Fiber Production, Consumption, Export, Import, 2016-2019
      TABLE 43 Latin America Glass Fiber Production, Consumption, Export, Import, 2016-2019
      TABLE 44 Middle East & Africa Glass Fiber Production, Consumption, Export, Import, 2016-2019
      TABLE 45 Global Glass Fiber Market - Company Revenue Analysis 2016-2019 (USD Million)
      TABLE 46 Global Glass Fiber Market - Company Revenue Share Analysis 2016-2019(%)
      TABLE 47 Global Glass Fiber Market - Company Volume Analysis 2016-2019 (Kilo Tons)
      TABLE 48 Global Glass Fiber Market - Company Volume Share Analysis 2016-2019(%)
      TABLE 49 Acquisitions and Mergers
      TABLE 50 New Product/Service Launch
      TABLE 51 Research & Development Activities
      TABLE 52 Market Drivers
      TABLE 53 Market Restraints
      TABLE 54 Market Opportunities
      TABLE 55 Production Base and Market Concentration Rate of Raw Material
      TABLE 56 Key Suppliers of Raw Materials
      TABLE 57 Raw Materials Sources of Glass Fiber Major Manufacturers in 2016
      TABLE 58 Major Buyers of Glass Fiber
      TABLE 59 Distributors/Traders of Glass Fiber by Region
      

Industry Major Market Players

  • Owens Corning
  •  BGF Industries
  •  Nitto Boseki Co. Ltd.
  •  Saint-Gobain Vetrotex
  •  Asahi Glass Company Limited