Search Market Research Report

Discover Our Latest Reports
Discover Our Featured Reports
Discover Top Selling Reports

Gelatin Market Size, Share Global Analysis Report, 2020–2026

report img

Gelatin Market By Raw Material (Pig Skin, Cattle Bones, Bovine Hides, Others) By Function (Stabilizer, Thickener, Gelling Agent, Others) and By Application (Personal Care, Pharmaceutical, Nutraceutical, Photography, Food & Beverage, Others): Global Industry Outlook, Market Size, Business Intelligence, Consumer Preferences, Statistical Surveys, Comprehensive Analysis, Historical Developments, Current Trends, and Forecast 2020–2026

Industry Insights

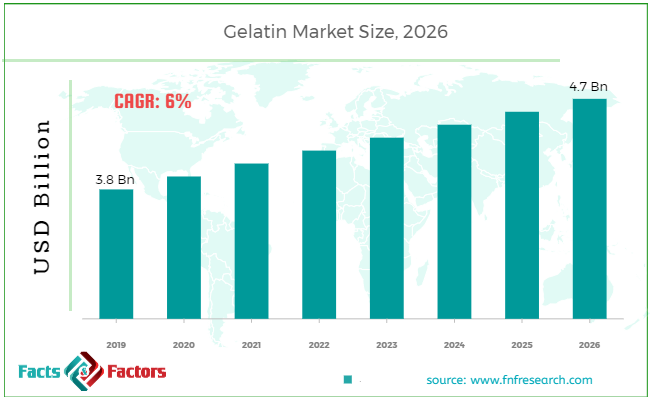
[210+ Pages Report] According to the report published by Facts Factors, the global gelatin market size was worth around USD 3.8 billion in 2019 and is predicted to grow to around USD 4.7 billion by 2026 with a compound annual growth rate (CAGR) of roughly 6% between 2020 and 2026. The report analyzes the global gelatin market drivers, restraints/challenges, and the effect they have on the demands during the projection period. In addition, the report explores emerging opportunities in the gelatin market.

Gelatin Market Size

To know more about this report | Request Free Sample Copy

This specialized and expertise oriented industry research report scrutinizes the technical and commercial business outlook of the Gelatin industry. The report analyzes and declares the historical and current trends analysis of the Gelatin industry and subsequently recommends the projected trends anticipated to be observed in the Gelatin market during the upcoming years.


logoKey Insights from Primary Research

  • As per our primary respondents, the Gelatin market is set to grow annually at a rate of around 6%.
  • It was established through primary research that the Gelatin market was valued at around USD 3.8 Billion in 2019.
  • The “Pig Skin” category, based on raw material segmentation, is expected to share the maximum revenue in 2019.
  • The “Stabilizer” based on function segmentation, is anticipated to have the maximum revenue value in 2019.
  • On the basis of application segmentation, the “food & beverage” category is expected to have a maximum share in 2019.

logoKey Recommendations from Analysts

  • As per our analysts, the Gelatin market is likely to gain a huge market in the coming years as it is widely used in multiple applications like pharmaceuticals, food & beverage, personal care, and cosmetics.
  • Growing at a CAGR of around 6%, the gelatin market provides abundant opportunities for all of the involved sponsors across the entire value chain.
  • The increasing demand for sports nutrition provides several chances for the manufacturers in manufacturing sports nutrition products that are ideal for athletes and consists of high protein and variability of taste and flavor.
  • The usage of gelatin in the 3D printing of human organs has helped in gaining investments from many prominent investors for improving the technology by making it more easy and economical.
  • Our analysts have identified “thickener” and “nutraceutical” categories as the leading investment pockets for the gelatin market in terms of function and application segmentation respectively.

The Gelatin market report analyzes and notifies the industry statistics at the global as well as regional and country levels in order to acquire a thorough perspective of the entire Gelatin market. The historical and past insights are provided for FY 2016 to FY 2019 whereas projected trends are delivered for FY 2020 to FY 2026. The quantitative and numerical data is represented in terms of both volume (Kilo Tons) and value (USD Million) from FY 2016 – 2026.

The quantitative data is further underlined and reinforced by comprehensive qualitative data which comprises various across-the-board market dynamics. The rationales which directly or indirectly impact the Gelatin industry are exemplified through parameters such as growth drivers, restraints, challenges, and opportunities among other impacting factors.

Throughout our research report, we have encompassed all the proven models and tools of industry analysis and extensively illustrated all the key business strategies and business models adopted in the Gelatin industry. The report provides an all-inclusive and detailed competitive landscape prevalent in the Gelatin market.

The report utilizes established industry analysis tools and models such as Porter’s Five Forces framework to analyze and recognize critical business strategies adopted by various stakeholders involved in the entire value chain of the Gelatin industry. The Gelatin market report additionally employs SWOT analysis and PESTLE analysis models for further in-depth analysis.

The report study further includes an in-depth analysis of industry players' market shares and provides an overview of leading players' market position in the Gelatin sector. Key strategic developments in the Gelatin market competitive landscape such as acquisitions & mergers, inaugurations of different products and services, partnerships & joint ventures, MoU agreements, VC & funding activities, R&D activities, and geographic expansion among other noteworthy activities by key players of the Gelatin market are appropriately highlighted in the report.

With the rising food & beverage industry, the market for gelatin is significantly in demand. Increasing gelatin usage in the pharmaceutical industry is expected to fuel demand over the forecasted period. The excellent gelling, stabilization and foaming properties make this a perfect dessert choice. There is no adulteration of foodstuffs due to the stringent laws.

The Gelatin market research report delivers an acute valuation and taxonomy of the Gelatin industry by practically splitting the market on the basis of different types, applications, and regions. Through the analysis of the historical and projected trends, all the segments and sub-segments were evaluated through the bottom-up approach, and different market sizes have been projected for FY 2020 to FY 2026. The regional segmentation of the Gelatin industry includes the complete classification of all the major continents including North America, Latin America, Europe, Asia Pacific, and Middle East & Africa. Further, country-wise data for the Gelatin industry is provided for the leading economies of the world.

The Gelatin market is segmented based on Raw Material, Function, and Application. On the basis of raw material segmentation, the market is classified into Pig Skin, Cattle Bones, Bovine Hides, Others. In terms of Function segmentation, the market is divided into Stabilizer, Thickener, Gelling Agent, Others. In terms of Application segmentation, the market is bifurcated into Personal Care, Pharmaceutical, Nutraceutical, Photography, Food & Beverage, Others.

logoReport Scope

Report Attribute

Details

Market Size in 2019

USD 3.8 Billion

Projected Market Size in 2026

USD 4.7 Billion

CAGR Growth Rate

6% CAGR

Base Year

2019

Forecast Years

2020-2026

Key Market Players

Gelita AG, Darling Ingredients Inc., Nitta Gelatin Inc., Sterling Gelatin, Tessenderlo Group, Gelita AG, Nitta Gelatin Inc., and Others.

Key Segment

By Raw Material, By Function, By Application, By Region

Major Regions Covered

North America, Europe, Asia Pacific, Latin America, and the Middle East & Africa

Purchase Options

Request customized purchase options to meet your research needs. Explore purchase options

logoSome of the essential players operating in the Gelatin market, but not restricted to include

  • Gelita AG
  • Darling Ingredients Inc.
  • Nitta Gelatin Inc.
  • Sterling Gelatin
  • Tessenderlo Group
  • Gelita AG
  • Nitta Gelatin Inc.

The taxonomy of the Gelatin market by its scope and segmentation is as follows:

logoBy Raw Material Segmentation Analysis 

  • Pig Skin
  • Cattle Bones
  • Bovine Hides
  • Others

logoBy Function Segmentation Analysis

  • Stabilizer
  • Thickener
  • Gelling Agent
  • Others

logoBy Application Segmentation Analysis

  •  
  • Personal Care
  • Pharmaceutical
  • Nutraceutical
  • Photography
  • Food & Beverage
  • Others

logoBy Regional Segmentation Analysis

  • North America
    • The U.S.
    • Canada
  • Europe
    • Germany
    • The UK
    • France
    • Spain
    • Italy
    • Rest of Europe
  • Asia Pacific
    • China
    • Japan
    • India
    • South Korea
    • Southeast Asia
    • Rest of Asia Pacific
  • Latin America
    • Brazil
    • Mexico
    • Rest of Latin America
  • Middle East & Africa
    • GCC
    • South Africa
    • Rest of Middle East & Africa

Table of Content

  1. CHAPTER 1. Executive Summary
  2. CHAPTER 2. Gelatin market – Raw Material Analysis
    1. 2.1. Global Gelatin Market – Raw Material Overview
    2. 2.2. Global Gelatin Market Share, by Raw Material, 2018 & 2025 (USD Million)
    3. 2.3. Global Gelatin Market share, by Raw Material, 2018 & 2025 (Kilo Tons)
    4. 2.4. Pig Skin
      1. 2.4.1. Global Pig Skin Gelatin Market, 2016-2026 (USD Million)
      2. 2.4.2. Global Pig Skin Gelatin Market, 2016-2026 (Kilo Tons)
    5. 2.5. Cattle Bones
      1. 2.5.1. Global Cattle Bones Gelatin Market, 2016-2026 (USD Million)
      2. 2.5.2. Global Cattle Bones Gelatin Market, 2016-2026 (Kilo Tons)
    6. 2.6. Bovine Hides
      1. 2.6.1. Global Bovine Hides Gelatin Market, 2016-2026 (USD Million)
      2. 2.6.2. Global Bovine Hides Gelatin Market, 2016-2026 (Kilo Tons)
    7. 2.7. Others
      1. 2.7.1. Global Others Gelatin Market, 2016-2026 (USD Million)
      2. 2.7.2. Global Others Gelatin Market, 2016-2026 (Kilo Tons)
  3. CHAPTER 3. Gelatin market – Function Analysis
    1. 3.1. Global Gelatin Market – Function Overview
    2. 3.2. Global Gelatin Market Share, by Function, 2018 & 2025 (USD Million)
    3. 3.3. Global Gelatin Market share, by Function, 2018 & 2025 (Kilo Tons)
    4. 3.4. Stabilizer
      1. 3.4.1. Global Stabilizer Gelatin Market, 2016-2026 (USD Million)
      2. 3.4.2. Global Stabilizer Gelatin Market, 2016-2026 (Kilo Tons)
    5. 3.5. Thickener
      1. 3.5.1. Global Thickener Gelatin Market, 2016-2026 (USD Million)
      2. 3.5.2. Global Thickener Gelatin Market, 2016-2026 (Kilo Tons)
    6. 3.6. Gelling Agent
      1. 3.6.1. Global Gelling Agent Gelatin Market, 2016-2026 (USD Million)
      2. 3.6.2. Global Gelling Agent Gelatin Market, 2016-2026 (Kilo Tons)
    7. 3.7. Others
      1. 3.7.1. Global Others Gelatin Market, 2016-2026 (USD Million)
      2. 3.7.2. Global Others Gelatin Market, 2016-2026 (Kilo Tons)
  4. CHAPTER 4. Gelatin market – Application Analysis
    1. 4.1. Global Gelatin Market – Application Overview
    2. 4.2. Global Gelatin Market Share, by Application, 2018 & 2025 (USD Million)
    3. 4.3. Global Gelatin Market share, by Application, 2018 & 2025 (Kilo Tons)
    4. 4.4. Personal Care
      1. 4.4.1. Global Personal Care Gelatin Market, 2016-2026 (USD Million)
      2. 4.4.2. Global Personal Care Gelatin Market, 2016-2026 (Kilo Tons)
    5. 4.5. Personal Care
      1. 4.5.1. Global Personal Care Gelatin Market, 2016-2026 (USD Million)
      2. 4.5.2. Global Personal Care Gelatin Market, 2016-2026 (Kilo Tons)
    6. 4.6. Nutraceutical
      1. 4.6.1. Global Nutraceutical Gelatin Market, 2016-2026 (USD Million)
      2. 4.6.2. Global Nutraceutical Gelatin Market, 2016-2026 (Kilo Tons)
    7. 4.7. Photography
      1. 4.7.1. Global Photography Gelatin Market, 2016-2026 (USD Million)
      2. 4.7.2. Global Photography Gelatin Market, 2016-2026 (Kilo Tons)
    8. 4.8. Food & Beverage
      1. 4.8.1. Global Food & Beverage Gelatin Market, 2016-2026 (USD Million)
      2. 4.8.2. Global Food & Beverage Gelatin Market, 2016-2026 (Kilo Tons)
    9. 4.9. Others
      1. 4.9.1. Global Others Gelatin Market, 2016-2026 (USD Million)
      2. 4.9.2. Global Others Gelatin Market, 2016-2026 (Kilo Tons)
  5. CHAPTER 5. Gelatin market – Regional Analysis
    1. 5.1. Global Gelatin Market Regional Overview
    2. 5.2. Global Gelatin Market Share, by Region, 2018 & 2025 (Value)
    3. 5.3. Global Gelatin Market Share, by Region, 2018 & 2025 (Volume)
    4. 5.4. North America
      1. 5.4.1. North America Gelatin Market size and forecast, 2016-2026
      2. 5.4.2. North America Gelatin Market, by Country, 2018 - 2025 (USD Million)
      3. 5.4.3. North America Market size and forecast, 2016-2026 (Kilo Tons)
      4. 5.4.4. North America Gelatin Market, by Country, 2018 - 2025 (Kilo Tons)
      5. 5.4.5. North America Gelatin Market, by Raw Material, 2016-2026
        1. 5.4.5.1. North America Gelatin Market, by Raw Material, 2016-2026 (USD Million)
        2. 5.4.5.2. North America Gelatin Market, by Raw Material, 2016-2026 (Kilo Tons)
      6. 5.4.6. North America Gelatin Market, by Function, 2016-2026
        1. 5.4.6.1. North America Gelatin Market, by Function, 2016-2026 (USD Million)
        2. 5.4.6.2. North America Gelatin Market, by Function, 2016-2026 (Kilo Tons)
      7. 5.4.7. North America Gelatin Market, by Application, 2016-2026
        1. 5.4.7.1. North America Gelatin Market, by Application, 2016-2026 (USD Million)
        2. 5.4.7.2. North America Gelatin Market, by Application, 2016-2026 (Kilo Tons)
      8. 5.4.8. U.S.
        1. 5.4.8.1. U.S. Market size and forecast, 2016-2026 (USD Million)
        2. 5.4.8.2. U.S. Market size and forecast, 2016-2026 (Kilo Tons)
      9. 5.4.9. Canada
        1. 5.4.9.1. Canada Market size and forecast, 2016-2026 (USD Million)
        2. 5.4.9.2. Canada Market size and forecast, 2016-2026 (Kilo Tons)
    5. 5.5. Europe
      1. 5.5.1. Europe Gelatin Market size and forecast, 2016-2026
      2. 5.5.2. Europe Gelatin Market, by Country, 2018 - 2025 (USD Million)
      3. 5.5.3. Europe Market size and forecast, 2016-2026 (Kilo Tons)
      4. 5.5.4. Europe Gelatin Market, by Country, 2018 - 2025 (Kilo Tons)
      5. 5.5.5. Europe Gelatin Market, by Raw Material, 2016-2026
        1. 5.5.5.1. Europe Gelatin Market, by Raw Material, 2016-2026 (USD Million)
        2. 5.5.5.2. Europe Gelatin Market, by Raw Material, 2016-2026 (Kilo Tons)
      6. 5.5.6. Europe Gelatin Market, by Function, 2016-2026
        1. 5.5.6.1. Europe Gelatin Market, by Function, 2016-2026 (USD Million)
        2. 5.5.6.2. Europe Gelatin Market, by Function, 2016-2026 (Kilo Tons)
      7. 5.5.7. Europe Gelatin Market, by Application, 2016-2026
        1. 5.5.7.1. Europe Gelatin Market, by Application, 2016-2026 (USD Million)
        2. 5.5.7.2. Europe Gelatin Market, by Application, 2016-2026 (Kilo Tons)
      8. 5.5.8. Germany
        1. 5.5.8.1. Germany Market size and forecast, 2016-2026 (USD Million)
        2. 5.5.8.2. Germany Market size and forecast, 2016-2026 (Kilo Tons)
      9. 5.5.9. France
        1. 5.5.9.1. France Market size and forecast, 2016-2026 (USD Million)
        2. 5.5.9.2. France Market size and forecast, 2016-2026 (Kilo Tons)
      10. 5.5.10. U.K.
        1. 5.5.10.1. U.K. Market size and forecast, 2016-2026 (USD Million)
        2. 5.5.10.2. U.K. Market size and forecast, 2016-2026 (Kilo Tons)
      11. 5.5.11. Italy
        1. 5.5.11.1. Italy Market size and forecast, 2016-2026 (USD Million)
        2. 5.5.11.2. Italy Market size and forecast, 2016-2026 (Kilo Tons)
      12. 5.5.12. Spain
        1. 5.5.12.1. Spain Market size and forecast, 2016-2026 (USD Million)
        2. 5.5.12.2. Spain Market size and forecast, 2016-2026 (Kilo Tons)
      13. 5.5.13. Rest of Europe
        1. 5.5.13.1. Rest of Europe Market size and forecast, 2016-2026 (USD Million)
        2. 5.5.13.2. Rest of Europe Market size and forecast, 2016-2026 (Kilo Tons)
    6. 5.6. Asia Pacific
      1. 5.6.1. Asia Pacific Gelatin Market size and forecast, 2016-2026
      2. 5.6.2. Asia Pacific Gelatin Market, by Country, 2018 - 2025 (USD Million)
      3. 5.6.3. Asia Pacific Market size and forecast, 2016-2026 (Kilo Tons)
      4. 5.6.4. Asia Pacific Gelatin Market, by Country, 2018 - 2025 (Kilo Tons)
      5. 5.6.5. Asia Pacific Gelatin Market, by Raw Material, 2016-2026
        1. 5.6.5.1. Asia Pacific Gelatin Market, by Raw Material, 2016-2026 (USD Million)
        2. 5.6.5.2. Asia Pacific Gelatin Market, by Raw Material, 2016-2026 (Kilo Tons)
      6. 5.6.6. Asia Pacific Gelatin Market, by Function, 2016-2026
        1. 5.6.6.1. Asia Pacific Gelatin Market, by Function, 2016-2026 (USD Million)
        2. 5.6.6.2. Asia Pacific Gelatin Market, by Function, 2016-2026 (Kilo Tons)
      7. 5.6.7. Asia Pacific Gelatin Market, by Application, 2016-2026
        1. 5.6.7.1. Asia Pacific Gelatin Market, by Application, 2016-2026 (USD Million)
        2. 5.6.7.2. Asia Pacific Gelatin Market, by Application, 2016-2026 (Kilo Tons)
      8. 5.6.8. China
        1. 5.6.8.1. China Market size and forecast, 2016-2026 (USD Million)
        2. 5.6.8.2. China Market size and forecast, 2016-2026 (Kilo Tons)
      9. 5.6.9. Japan
        1. 5.6.9.1. Japan Market size and forecast, 2016-2026 (USD Million)
        2. 5.6.9.2. Japan Market size and forecast, 2016-2026 (Kilo Tons)
      10. 5.6.10. India
        1. 5.6.10.1. India Market size and forecast, 2016-2026 (USD Million)
        2. 5.6.10.2. India Market size and forecast, 2016-2026 (Kilo Tons)
      11. 5.6.11. South Korea
        1. 5.6.11.1. South Korea Market size and forecast, 2016-2026 (USD Million)
        2. 5.6.11.2. South Korea Market size and forecast, 2016-2026 (Kilo Tons)
      12. 5.6.12. South-East Asia
        1. 5.6.12.1. South-East Asia Market size and forecast, 2016-2026 (USD Million)
        2. 5.6.12.2. South-East Asia Market size and forecast, 2016-2026 (Kilo Tons)
      13. 5.6.13. Rest of Asia Pacific
        1. 5.6.13.1. Rest of Asia Pacific Market size and forecast, 2016-2026 (USD Million)
        2. 5.6.13.2. Rest of Asia Pacific Market size and forecast, 2016-2026 (Kilo Tons)
    7. 5.7. Latin America
      1. 5.7.1. Latin America Gelatin Market size and forecast, 2016-2026
      2. 5.7.2. Latin America Gelatin Market, by Country, 2018 - 2025 (USD Million)
      3. 5.7.3. Latin America Market size and forecast, 2016-2026 (Kilo Tons)
      4. 5.7.4. Latin America Gelatin Market, by Country, 2018 - 2025 (Kilo Tons)
      5. 5.7.5. Latin America Gelatin Market, by Raw Material, 2016-2026
        1. 5.7.5.1. Latin America Gelatin Market, by Raw Material, 2016-2026 (USD Million)
        2. 5.7.5.2. Latin America Gelatin Market, by Raw Material, 2016-2026 (Kilo Tons)
      6. 5.7.6. Latin America Gelatin Market, by Function, 2016-2026
        1. 5.7.6.1. Latin America Gelatin Market, by Function, 2016-2026 (USD Million)
        2. 5.7.6.2. Latin America Gelatin Market, by Function, 2016-2026 (Kilo Tons)
      7. 5.7.7. Latin America Gelatin Market, by Application, 2016-2026
        1. 5.7.7.1. Latin America Gelatin Market, by Application, 2016-2026 (USD Million)
        2. 5.7.7.2. Latin America Gelatin Market, by Application, 2016-2026 (Kilo Tons)
      8. 5.7.8. Brazil
        1. 5.7.8.1. Brazil Market size and forecast, 2016-2026 (USD Million)
        2. 5.7.8.2. Brazil Market size and forecast, 2016-2026 (Kilo Tons)
      9. 5.7.9. Mexico
        1. 5.7.9.1. Mexico Market size and forecast, 2016-2026 (USD Million)
        2. 5.7.9.2. Mexico Market size and forecast, 2016-2026 (Kilo Tons)
      10. 5.7.10. Rest of Latin America
        1. 5.7.10.1. Rest of Latin America Market size and forecast, 2016-2026 (USD Million)
        2. 5.7.10.2. Rest of Latin America Market size and forecast, 2016-2026 (Kilo Tons)
    8. 5.8. The Middle-East and Africa
      1. 5.8.1. The Middle-East and Africa Gelatin Market size and forecast, 2016-2026
      2. 5.8.2. The Middle-East and Africa Gelatin Market, by Country, 2018 - 2025 (USD Million)
      3. 5.8.3. The Middle-East and Africa Market size and forecast, 2016-2026 (Kilo Tons)
      4. 5.8.4. The Middle-East and Africa Gelatin Market, by Country, 2018 - 2025 (Kilo Tons)
      5. 5.8.5. The Middle-East and Africa Gelatin Market, by Raw Material, 2016-2026
        1. 5.8.5.1. The Middle-East and Africa Gelatin Market, by Raw Material, 2016-2026 (USD Million)
        2. 5.8.5.2. The Middle-East and Africa Gelatin Market, by Raw Material, 2016-2026 (Kilo Tons)
      6. 5.8.6. The Middle-East and Africa Gelatin Market, by Function, 2016-2026
        1. 5.8.6.1. The Middle-East and Africa Gelatin Market, by Function, 2016-2026 (USD Million)
        2. 5.8.6.2. The Middle-East and Africa Gelatin Market, by Function, 2016-2026 (Kilo Tons)
      7. 5.8.7. The Middle-East and Africa Gelatin Market, by Application, 2016-2026
        1. 5.8.7.1. The Middle-East and Africa Gelatin Market, by Application, 2016-2026 (USD Million)
        2. 5.8.7.2. The Middle-East and Africa Gelatin Market, by Application, 2016-2026 (Kilo Tons)
      8. 5.8.8. GCC Countries
        1. 5.8.8.1. GCC Countries Market size and forecast, 2016-2026 (USD Million)
        2. 5.8.8.2. GCC Countries Market size and forecast, 2016-2026 (Kilo Tons)
      9. 5.8.9. South Africa
        1. 5.8.9.1. South Africa Market size and forecast, 2016-2026 (USD Million)
        2. 5.8.9.2. South Africa Market size and forecast, 2016-2026 (Kilo Tons)
      10. 5.8.10. Rest of Middle-East Africa
        1. 5.8.10.1. Rest of Middle-East Africa Market size and forecast, 2016-2026 (USD Million)
        2. 5.8.10.2. Rest of Middle-East Africa Market size and forecast, 2016-2026 (Kilo Tons)
  6. CHAPTER 6. Gelatin Production, Consumption, Export, Import by Regions
    1. 6.1. Global Gelatin production and revenue, 2015-2025 (USD Million) (Kilo Tons)
    2. 6.2. Global Import and Export Analysis, by Region
  7. CHAPTER 7. Gelatin market – Competitive Landscape
    1. 7.1. Competitor Market Share – Revenue
    2. 7.2. Market Concentration Rate Analysis, Top 3 and Top 5 Players
    3. 7.3. Competitor Market Share – Volume
    4. 7.4. Strategic Development
      1. 7.4.1. Acquisitions and Mergers
      2. 7.4.2. New Products
      3. 7.4.3. Research & Development Activities
  8. CHAPTER 8. Company Profiles
    1. 8.1. Gelita AG
      1. 8.1.1. Company Overview
      2. 8.1.2. Gelita AG Sales, Revenue, Price, and Gross Margin
      3. 8.1.3. Product portfolio
      4. 8.1.4. Recent initiatives
    2. 8.2. Darling Ingredients Inc.
      1. 8.2.1. Company Overview
      2. 8.2.2. Darling Ingredients Inc. Sales, Revenue, Price, and Gross Margin
      3. 8.2.3. Product portfolio
      4. 8.2.4. Recent initiatives
    3. 8.3. Nitta Gelatin Inc.
      1. 8.3.1. Company Overview
      2. 8.3.2. Nitta Gelatin Inc. Sales, Revenue, Price, and Gross Margin
      3. 8.3.3. Product portfolio
      4. 8.3.4. Recent initiatives
    4. 8.4. Sterling Gelatin
      1. 8.4.1. Company Overview
      2. 8.4.2. Sterling Gelatin Sales, Revenue, Price, and Gross Margin
      3. 8.4.3. Product portfolio
      4. 8.4.4. Recent initiatives
    5. 8.5. Tessenderlo Group
      1. 8.5.1. Company Overview
      2. 8.5.2. Tessenderlo Group Sales, Revenue, Price, and Gross Margin
      3. 8.5.3. Product portfolio
      4. 8.5.4. Recent initiatives
    6. 8.6. Gelita AG
      1. 8.6.1. Company Overview
      2. 8.6.2. Gelita AG Sales, Revenue, Price, and Gross Margin
      3. 8.6.3. Product portfolio
      4. 8.6.4. Recent initiatives
    7. 8.7. Nitta Gelatin Inc.
      1. 8.7.1. Company Overview
      2. 8.7.2. Nitta Gelatin Inc. Sales, Revenue, Price, and Gross Margin
      3. 8.7.3. Product portfolio
      4. 8.7.4. Recent initiatives
    8. 8.8. Others
      1. 8.8.1. Company Overview
      2. 8.8.2. Others Sales, Revenue, Price, and Gross Margin
      3. 8.8.3. Product portfolio
      4. 8.8.4. Recent initiatives
  9. CHAPTER 9. Gelatin — Industry Analysis
    1. 9.1. Introduction and Taxonomy
    2. 9.2. Gelatin Market – Key Trends
      1. 9.2.1. Market Drivers
      2. 9.2.2. Market Restraints
      3. 9.2.3. Market Opportunities
    3. 9.3. Value Chain Analysis
    4. 9.4. Key Mandates and Regulations
    5. 9.5. Technology Roadmap and Timeline
    6. 9.6. Gelatin market – Attractiveness Analysis
      1. 9.6.1. By Raw Material
      2. 9.6.2. By Function
      3. 9.6.3. By Application
      4. 9.6.4. By Region
  10. CHAPTER 10. Raw Material analysis
    1. 10.1. Gelatin Key Raw Material Analysis
      1. 10.1.1. Key Raw Materials
      2. 10.1.2. Price Trend of Key Raw Materials
    2. 10.2. Key Suppliers of Raw Materials
    3. 10.3. Proportion of Manufacturing Cost Structure
      1. 10.3.1. Raw Materials
      2. 10.3.2. Labor Cost
    4. 10.4. Manufacturing Expenses Analysis of Gelatin
  11. CHAPTER 11. Industrial Chain, Sourcing Strategy and Downstream Buyers
    1. 11.1. Gelatin Industrial Chain Analysis
    2. 11.2. Upstream Raw Materials Sourcing
      1. 11.2.1. Risk Mitigation:
      2. 11.2.2. Supplier Relationships:
      3. 11.2.3. Business Processes:
      4. 11.2.4. Securing the Product:
    3. 11.3. Raw Materials Sources of Gelatin Major Manufacturers in 2016
    4. 11.4. Downstream Buyers
    5. 11.5. Distributors/Traders List
  12. CHAPTER 12. Marketing Strategy Analysis, Distributors
    1. 12.1. Marketing Channel
    2. 12.2. Direct Marketing
    3. 12.3. Indirect Marketing
    4. 12.4. Marketing Channel Development Trend
    5. 12.5. Economic/Political Environmental Change
  13. CHAPTER 13. Report Conclusion
  14. CHAPTER 14. Research Approach & Methodology
    1. 14.1. Report Description
    2. 14.2. Research Scope
    3. 14.3. Research Methodology
      1. 14.3.1. Secondary Research
      2. 14.3.2. Primary Research
      3. 14.3.3. Models
        1. 14.3.3.1. Company Share Analysis Model
        2. 14.3.3.2. Revenue Based Modeling
        3. 14.3.3.3. Research Limitations

  • List of Figures

    FIG. 1 Global Gelatin Market, 2016-2026 (USD Million)
    FIG. 2 Global Gelatin Market Share, by  Raw Material, 2018 & 2025 (USD Million)
    FIG. 3 Global Gelatin Market share, by  Raw Material, 2018 & 2025 (Kilo Tons)
    FIG. 4 Global Pig Skin Gelatin Market, 2016-2026 (USD Million)
    FIG. 5 Global Pig Skin Gelatin  Market, 2016-2026 (Kilo Tons)
    FIG. 6 Global Cattle Bones Gelatin Market, 2016-2026 (USD Million)
    FIG. 7 Global Cattle Bones Gelatin  Market, 2016-2026 (Kilo Tons)
    FIG. 8 Global Bovine Hides Gelatin Market, 2016-2026 (USD Million)
    FIG. 9 Global Bovine Hides Gelatin  Market, 2016-2026 (Kilo Tons)
    FIG. 10 Global Others Gelatin Market, 2016-2026 (USD Million)
    FIG. 11 Global Others Gelatin  Market, 2016-2026 (Kilo Tons)
    FIG. 12 Global Gelatin Market Share, by Function, 2018 & 2025 (USD Million)
    FIG. 13 Global Gelatin Market share, by Function, 2018 & 2025 (Kilo Tons)
    FIG. 14 Global Stabilizer Gelatin Market, 2016-2026 (USD Million)
    FIG. 15 Global Stabilizer Gelatin  Market, 2016-2026 (Kilo Tons)
    FIG. 16 Global Thickener Gelatin Market, 2016-2026 (USD Million)
    FIG. 17 Global Thickener Gelatin  Market, 2016-2026 (Kilo Tons)
    FIG. 18 Global Gelling Agent Gelatin Market, 2016-2026 (USD Million)
    FIG. 19 Global Gelling Agent Gelatin  Market, 2016-2026 (Kilo Tons)
    FIG. 20 Global Others Gelatin Market, 2016-2026 (USD Million)
    FIG. 21 Global Others Gelatin  Market, 2016-2026 (Kilo Tons)
    FIG. 22 Global Gelatin Market Share, by Application, 2018 & 2025 (USD Million)
    FIG. 23 Global Gelatin Market share, by Application, 2018 & 2025 (Kilo Tons)
    FIG. 24 Global Personal Care Gelatin Market, 2016-2026 (USD Million)
    FIG. 25 Global Personal Care Gelatin  Market, 2016-2026 (Kilo Tons)
    FIG. 26 Global Personal Care Gelatin Market, 2016-2026 (USD Million)
    FIG. 27 Global Personal Care Gelatin  Market, 2016-2026 (Kilo Tons)
    FIG. 28 Global Nutraceutical Gelatin Market, 2016-2026 (USD Million)
    FIG. 29 Global Nutraceutical Gelatin  Market, 2016-2026 (Kilo Tons)
    FIG. 30 Global Photography Gelatin Market, 2016-2026 (USD Million)
    FIG. 31 Global Photography Gelatin  Market, 2016-2026 (Kilo Tons)
    FIG. 32 Global Food & Beverage Gelatin Market, 2016-2026 (USD Million)
    FIG. 33 Global Food & Beverage Gelatin  Market, 2016-2026 (Kilo Tons)
    FIG. 34 Global Others Gelatin Market, 2016-2026 (USD Million)
    FIG. 35 Global Others Gelatin  Market, 2016-2026 (Kilo Tons)
    FIG. 36 Global Gelatin Market Share, by Region, 2018 & 2025
    FIG. 37 Global Gelatin Market Share, by Region, 2018 & 2025
    FIG. 38 North America Gelatin Market, 2016-2026
    FIG. 39 North America Gelatin  Market, 2016-2026 (Kilo Tons)
    FIG. 40 U.S. Gelatin Market, 2016-2026
    FIG. 41 U.S. Gelatin  Market, 2016-2026 (Kilo Tons)
    FIG. 42 Canada Gelatin Market, 2016-2026
    FIG. 43 Canada Gelatin  Market, 2016-2026 (Kilo Tons)
    FIG. 44 Europe Gelatin Market, 2016-2026
    FIG. 45 Europe Gelatin  Market, 2016-2026 (Kilo Tons)
    FIG. 46 Germany Gelatin Market, 2016-2026
    FIG. 47 Germany Gelatin  Market, 2016-2026 (Kilo Tons)
    FIG. 48 France Gelatin Market, 2016-2026
    FIG. 49 France Gelatin  Market, 2016-2026 (Kilo Tons)
    FIG. 50 U.K. Gelatin Market, 2016-2026
    FIG. 51 U.K. Gelatin  Market, 2016-2026 (Kilo Tons)
    FIG. 52 Italy Gelatin Market, 2016-2026
    FIG. 53 Italy Gelatin  Market, 2016-2026 (Kilo Tons)
    FIG. 54 Spain Gelatin Market, 2016-2026
    FIG. 55 Spain Gelatin  Market, 2016-2026 (Kilo Tons)
    FIG. 56 Rest of Europe Gelatin Market, 2016-2026
    FIG. 57 Rest of Europe Gelatin  Market, 2016-2026 (Kilo Tons)
    FIG. 58 Asia Pacific Gelatin Market, 2016-2026
    FIG. 59 Asia Pacific Gelatin  Market, 2016-2026 (Kilo Tons)
    FIG. 60 China Gelatin Market, 2016-2026
    FIG. 61 China Gelatin  Market, 2016-2026 (Kilo Tons)
    FIG. 62 Japan Gelatin Market, 2016-2026
    FIG. 63 Japan Gelatin  Market, 2016-2026 (Kilo Tons)
    FIG. 64 India Gelatin Market, 2016-2026
    FIG. 65 India Gelatin  Market, 2016-2026 (Kilo Tons)
    FIG. 66 South  Korea Gelatin Market, 2016-2026
    FIG. 67 South  Korea Gelatin  Market, 2016-2026 (Kilo Tons)
    FIG. 68 South-East Asia Gelatin Market, 2016-2026
    FIG. 69 South-East Asia Gelatin  Market, 2016-2026 (Kilo Tons)
    FIG. 70 Rest of Asia Pacific Gelatin Market, 2016-2026
    FIG. 71 Rest of Asia Pacific Gelatin  Market, 2016-2026 (Kilo Tons)
    FIG. 72 Latin America Gelatin Market, 2016-2026
    FIG. 73 Latin America Gelatin  Market, 2016-2026 (Kilo Tons)
    FIG. 74 Brazil Gelatin Market, 2016-2026
    FIG. 75 Brazil Gelatin  Market, 2016-2026 (Kilo Tons)
    FIG. 76 Mexico Gelatin Market, 2016-2026
    FIG. 77 Mexico Gelatin  Market, 2016-2026 (Kilo Tons)
    FIG. 78 Rest of Latin America Gelatin Market, 2016-2026
    FIG. 79 Rest of Latin America Gelatin  Market, 2016-2026 (Kilo Tons)
    FIG. 80 The Middle-East and Africa Gelatin Market, 2016-2026
    FIG. 81 The Middle-East and Africa Gelatin  Market, 2016-2026 (Kilo Tons)
    FIG. 82 GCC Countries Gelatin Market, 2016-2026
    FIG. 83 GCC Countries Gelatin  Market, 2016-2026 (Kilo Tons)
    FIG. 84 South Africa Gelatin Market, 2016-2026
    FIG. 85 South Africa Gelatin  Market, 2016-2026 (Kilo Tons)
    FIG. 86 Rest of Middle-East Africa Gelatin Market, 2016-2026
    FIG. 87 Rest of Middle-East Africa Gelatin  Market, 2016-2026 (Kilo Tons)
    FIG. 88 Global Gelatin production and revenue, 2015-2025 (USD Million) (Kilo Tons)
    FIG. 89 North America Gelatin production and revenue, 2015-2025 (USD Million) (Kilo Tons)
    FIG. 90 Europe Gelatin production and revenue, 2015-2025 (USD Million) (Kilo Tons)
    FIG. 91 Asia Pacific Gelatin production and revenue, 2015-2025 (USD Million) (Kilo Tons)
    FIG. 92 Latin America Gelatin production and revenue, 2015-2025 (USD Million) (Kilo Tons)
    FIG. 93 Middle East and Africa Gelatin production and revenue, 2015-2025 (USD Million) (Kilo Tons)
    FIG. 94 Competitor Market Share – Revenue
    FIG. 95 Competitor Market Share – Volume
    FIG. 96 Gelita AG Revenue and Growth Rate
    FIG. 97 Gelita AG Market Share
    FIG. 98 Darling Ingredients Inc. Revenue and Growth Rate
    FIG. 99 Darling Ingredients Inc. Market Share
    FIG. 100 Nitta Gelatin Inc. Revenue and Growth Rate
    FIG. 101 Nitta Gelatin Inc. Market Share
    FIG. 102 Sterling Gelatin Revenue and Growth Rate
    FIG. 103 Sterling Gelatin Market Share
    FIG. 104 Tessenderlo Group Revenue and Growth Rate
    FIG. 105 Tessenderlo Group Market Share
    FIG. 106 Gelita AG Revenue and Growth Rate
    FIG. 107 Gelita AG Market Share
    FIG. 108 Nitta Gelatin Inc. Revenue and Growth Rate
    FIG. 109 Nitta Gelatin Inc. Market Share
    FIG. 110 Others Revenue and Growth Rate
    FIG. 111 Others Market Share
    FIG. 112 Market Dynamics
    FIG. 113 Global Gelatin – Value Chain Analysis
    FIG. 114 Key Mandates and Regulations
    FIG. 115 Technology Roadmap and Timeline
    FIG. 116 Market Attractiveness Analysis – By  Raw Material
    FIG. 117 Market Attractiveness Analysis – By Function
    FIG. 118 Market Attractiveness Analysis – By Application
    FIG. 119 Market Attractiveness Analysis – By Region
    FIG. 120 Manufacturing Cost Structure of Gelatin
    FIG. 121 Gelatin Industrial Chain Analysis
    FIG. 122 Market Channel
    FIG. 123 Marketing Channel Development Trend
    FIG. 124 Growth in World Gross Product, 2008-2018
    

    List of Tables

    TABLE 1 Global Gelatin market, 2018 & 2025 (USD Million)
    TABLE 2 Global Gelatin market, by  Raw Material, 2016-2026 (USD Million)
    TABLE 3 Global Gelatin market, by  Raw Material, 2016-2026 (Kilo Tons)
    TABLE 4 Global Gelatin market, by Function, 2016-2026 (USD Million)
    TABLE 5 Global Gelatin market, by Function, 2016-2026 (Kilo Tons)
    TABLE 6 Global Gelatin market, by Application, 2016-2026 (USD Million)
    TABLE 7 Global Gelatin market, by Application, 2016-2026 (Kilo Tons)
    TABLE 8 Global Gelatin market, by region, 2016-2026 (USD Million)
    TABLE 9 Global Gelatin market, by region, 2016-2026 (Kilo Tons)
    TABLE 10 North America Gelatin Market, by  Raw Material, 2016-2026 (USD Million)
    TABLE 11 North America Gelatin Market, by  Raw Material, 2016-2026 (Kilo Tons)
    TABLE 12 North America Gelatin Market, by Function, 2016-2026 (USD Million)
    TABLE 13 North America Gelatin Market, by Function, 2016-2026 (Kilo Tons)
    TABLE 14 North America Gelatin Market, by Application, 2016-2026 (USD Million)
    TABLE 15 North America Gelatin Market, by Application, 2016-2026 (Kilo Tons)
    TABLE 16 Europe Gelatin Market, by  Raw Material, 2016-2026 (USD Million)
    TABLE 17 Europe Gelatin Market, by  Raw Material, 2016-2026 (Kilo Tons)
    TABLE 18 Europe Gelatin Market, by Function, 2016-2026 (USD Million)
    TABLE 19 Europe Gelatin Market, by Function, 2016-2026 (Kilo Tons)
    TABLE 20 Europe Gelatin Market, by Application, 2016-2026 (USD Million)
    TABLE 21 Europe Gelatin Market, by Application, 2016-2026 (Kilo Tons)
    TABLE 22 Asia Pacific Gelatin Market, by  Raw Material, 2016-2026 (USD Million)
    TABLE 23 Asia Pacific Gelatin Market, by  Raw Material, 2016-2026 (Kilo Tons)
    TABLE 24 Asia Pacific Gelatin Market, by Function, 2016-2026 (USD Million)
    TABLE 25 Asia Pacific Gelatin Market, by Function, 2016-2026 (Kilo Tons)
    TABLE 26 Asia Pacific Gelatin Market, by Application, 2016-2026 (USD Million)
    TABLE 27 Asia Pacific Gelatin Market, by Application, 2016-2026 (Kilo Tons)
    TABLE 28 Latin America Gelatin Market, by  Raw Material, 2016-2026 (USD Million)
    TABLE 29 Latin America Gelatin Market, by  Raw Material, 2016-2026 (Kilo Tons)
    TABLE 30 Latin America Gelatin Market, by Function, 2016-2026 (USD Million)
    TABLE 31 Latin America Gelatin Market, by Function, 2016-2026 (Kilo Tons)
    TABLE 32 Latin America Gelatin Market, by Application, 2016-2026 (USD Million)
    TABLE 33 Latin America Gelatin Market, by Application, 2016-2026 (Kilo Tons)
    TABLE 34 The Middle-East and Africa Gelatin Market, by  Raw Material, 2016-2026 (USD Million)
    TABLE 35 The Middle-East and Africa Gelatin Market, by  Raw Material, 2016-2026 (Kilo Tons)
    TABLE 36 The Middle-East and Africa Gelatin Market, by Function, 2016-2026 (USD Million)
    TABLE 37 The Middle-East and Africa Gelatin Market, by Function, 2016-2026 (Kilo Tons)
    TABLE 38 The Middle-East and Africa Gelatin Market, by Application, 2016-2026 (USD Million)
    TABLE 39 The Middle-East and Africa Gelatin Market, by Application, 2016-2026 (Kilo Tons)
    TABLE 40 North America Gelatin Production, Consumption, Export, Import, 2016-2019
    TABLE 41 Europe Gelatin Production, Consumption, Export, Import, 2016-2019
    TABLE 42 Asia Pacific Gelatin Production, Consumption, Export, Import, 2016-2019
    TABLE 43 Latin America Gelatin Production, Consumption, Export, Import, 2016-2019
    TABLE 44 Middle East & Africa Gelatin Production, Consumption, Export, Import, 2016-2019
    TABLE 45 Global Gelatin Market - Company Revenue Analysis 2016-2019 (USD Million)
    TABLE 46 Global Gelatin Market - Company Revenue Share Analysis 2016-2019(%)
    TABLE 47 Global Gelatin Market - Company Volume Analysis 2016-2019 (Kilo Tons)
    TABLE 48 Global Gelatin Market - Company Volume Share Analysis 2016-2019(%)
    TABLE 49 Acquisitions and Mergers
    TABLE 50 New Product/Service Launch
    TABLE 51 Research & Development Activities
    TABLE 52 Market Drivers
    TABLE 53 Market Restraints
    TABLE 54 Market Opportunities
    TABLE 55 Production Base and Market Concentration Rate of Raw Material
    TABLE 56 Key Suppliers of Raw Materials
    TABLE 57 Raw Materials Sources of Gelatin Major Manufacturers in 2016
    TABLE 58 Major Buyers of Gelatin
    TABLE 59 Distributors/Traders of Gelatin by Region
  •  

    Industry Major Market Players

    • Gelita AG
    • Darling Ingredients Inc.
    • Nitta Gelatin Inc.
    • Sterling Gelatin
    • Tessenderlo Group
    • Gelita AG
    • Nitta Gelatin Inc.