Search Market Research Report

Discover Our Latest Reports
Discover Our Featured Reports
Discover Top Selling Reports

Galacto-Oligosaccharide (GOS) Market Size, Share Global Analysis Report, 2020–2026

report img

Galacto-Oligosaccharide (GOS) Market By Product Type (Liquid, Powder), By Function (Prebiotics, Sweetner), By Application (Prebiotic Food and Beverages, Prebiotic Dietary Supplements, Animal Feed, Pharmaceuticals, Others): Global Industry Outlook, Market Size, Business Intelligence, Consumer Preferences, Statistical Surveys, Comprehensive Analysis, Historical Developments, Current Trends, and Forecast 2020–2026

Industry Insights

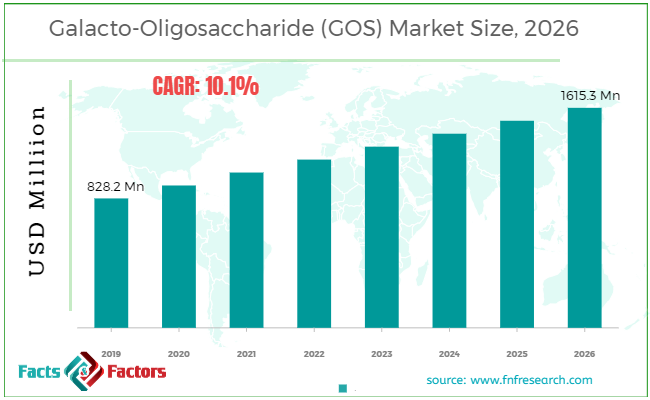
[175+ Pages Report] According to the report published by Facts Factors, the global galacto-oligosaccharide (GOS) market size was worth around USD 828.2 Million in 2019 and is predicted to grow to around USD 1615.3 Million by 2026 with a compound annual growth rate (CAGR) of roughly 10.1% between 2020 and 2026. The report analyzes the global galacto-oligosaccharide (GOS) market drivers, restraints/challenges, and the effect they have on the demands during the projection period. In addition, the report explores emerging opportunities in the galacto-oligosaccharide (GOS) market.

Galacto-Oligosaccharide (GOS) Market

To know more about this report | Request Free Sample Copy

The galacto-oligosaccharide (GOS) market report analyzes and notifies the industry statistics at the global as well as regional and country levels in order to acquire a thorough perspective of the entire galacto-oligosaccharide (GOS) market. The historical and past insights are provided for FY 2016 to FY 2019 whereas projected trends are delivered for FY 2020 to FY 2026. The quantitative and numerical data is represented in terms of value (Million) from FY 2016 – 2026.


logoKey Insights from Primary Research

  • Wide-ranging interviews with CXOs of the major companies operating in the global galacto-oligosaccharide market, the primary research analysis predicts that the global galacto-oligosaccharide market to witness exponential growth of nearly 10.1% over the forecast period.
  • In the year 2019, the market was valued at approximately USD 828.2 Million, 2019 and is expected to be valued at over USD 1615.3 Million by 2026.
  • On the basis of the application segment, prebiotic food and beverages are expected to continue to occupy a significant market share during the forecast period. Prebiotic food and beverages are also expected to witness the highest CAGR during the forecast period.
  • North America region is expected to be the largest revenue-generating region for galacto-oligosaccharide over the forecast period. The North American market is also expected to exhibit the highest growth in the global galacto-oligosaccharide market.

logoKey Recommendations from Analysts

  • Our analysts recommend an increased focus on the Asia Pacific market as it has great potential for market growth. The presence of highly populous economies like China and India provides immense potential for growth in the region.
  • Strategic developments such as regional expansion and product innovations by the major companies are likely to boom the global galacto-oligosaccharide sale over the upcoming years.
  • Our analysts recommend that the Asia Pacific region is predicted to witness significant growth attributed to the growing demand for galacto-oligosaccharide from China and India. 
  • Rising economic conditions, high disposable incomes, and a large population in the Asia Pacific region are anticipated to fuel the food and beverage and pharmaceutical industries thereby propelling the galacto-oligosaccharide market growth over the foreseeable future.
  • North America and the European region are expected to remain the primary source of significant revenue during the studied period. Regional dominance in these regions is expected to provide additional capital capabilities for expansion beyond the borders.

The quantitative data is further underlined and reinforced by comprehensive qualitative data which comprises various across-the-board market dynamics. The rationales which directly or indirectly impact the galacto-oligosaccharide (GOS) industry are exemplified through parameters such as growth drivers, restraints, challenges, and opportunities among other impacting factors.

Throughout our research report, we have encompassed all the proven models and tools of industry analysis and extensively illustrated all the key business strategies and business models adopted in the galacto-oligosaccharide (GOS) industry. The report provides an all-inclusive and detailed competitive landscape prevalent in the galacto-oligosaccharide (GOS) market.

The report utilizes established industry analysis tools and models such as Porter’s Five Forces framework to analyze and recognize critical business strategies adopted by various stakeholders involved in the entire value chain of the galacto-oligosaccharide (GOS) industry. The galacto-oligosaccharide (GOS) market report additionally employs SWOT analysis and PESTLE analysis models for further in-depth analysis.

The report study further includes an in-depth analysis of industry players' market shares and provides an overview of leading players' market position in the galacto-oligosaccharide (GOS) sector. Key strategic developments in the galacto-oligosaccharide (GOS) market competitive landscape such as acquisitions & mergers, inaugurations of different products and services, partnerships & joint ventures, MoU agreements, VC & funding activities, R&D activities, and geographic expansion among other noteworthy activities by key players of the galacto-oligosaccharide (GOS) market are appropriately highlighted in the report.

The rising usage of galacto-oligosaccharide in infant nutrition products by the food and beverages industry has been the major driving factor for the growth of galacto-oligosaccharide market. The perception of the therapeutic effect on immunity development and gut health has led to increase in the demand for GOS.

Additionally, the FDA approval is expected to play important role in the market expansion of GOS in the near future. The use of galacto-oligosaccharides in nutraceuticals is also providing promising growth for the global GOS market.

logoReport Scope

Report Attribute

Details

Market Size in 2019

USD 828.2 Million

Projected Market Size in 2026

USD 1615.3 Million

CAGR Growth Rate

10.1% CAGR

Base Year

2019

Forecast Years

2020-2026

Key Market Players

Nissin Sugar Co., Ltd., Royal Friesland Campina N.V, Baolingbao Biology Co., Yakult Pharmaceuticals Pvt Ltd, Quantum Hi-Tech (China) Biological Co., Ltd., Ingredion Incorporated, Kerry Inc., New Francisco Biotech Company, Ltd., Samyang, and Dairy Crest., and Others

Key Segment

By Product, Type, Application, and Region

Major Regions Covered

North America, Europe, Asia Pacific, Latin America, and the Middle East & Africa

Purchase Options

Request customized purchase options to meet your research needs. Explore purchase options

The galacto-oligosaccharide (GOS) market research report delivers an acute valuation and taxonomy of the galacto-oligosaccharide (GOS) industry by practically splitting the market based on application and regions. Through the analysis of the historical and projected trends, all the segments and sub-segments were evaluated through the bottom-up approach, and different market sizes have been projected for FY 2020 to FY 2026. The regional segmentation of the galacto-oligosaccharide (GOS) industry includes the complete classification of all the major continents including North America, Latin America, Europe, Asia Pacific, and the Middle East & Africa. Further, country-wise data for the galacto-oligosaccharide (GOS) industry is provided for the leading economies of the world.

The galacto-oligosaccharide (GOS) market is segmented based on product, function, application, and region. On the basis of product, the market is segmented into liquid and powder. In terms of function, the market is segmented into prebiotics and sweeteners. On the basis of application, the market is classified into prebiotic food and beverages, prebiotic dietary supplements, animal feed, pharmaceuticals, and others.

logoSome of the essential players operating in the galacto-oligosaccharide (GOS) market, but not restricted to include:

  • Royal Friesland Campina N.V
  • Yakult Pharmaceuticals Pvt Ltd
  • Baolingbao Biology Co.
  • Nissin Sugar Co. Ltd.
  • Kerry Inc.
  • Quantum Hi-Tech (China) Biological Co. Ltd.
  • Ingredion Incorporated
  • Dairy Crest.
  • New Francisco Biotech Company Ltd. and
  • Samyang Corporation.

The taxonomy of the galacto-oligosaccharide (GOS) industry by its scope and segmentation is as follows:

logo By Product Type Segmentation Analysis

  • Liquid
  • Powder

logo By Product Type Segmentation Analysis

  • Prebiotics
  • Sweetner

logo By Application Segmentation Analysis

  • Prebiotic Food and Beverages
  • Prebiotic Dietary Supplements
  • Animal Feed
  • Pharmaceuticals
  • Others

logoGlobal Galacto-Oligosaccharide (GOS) Market: Regional Segmentation Analysis

  • North America
    • The U.S. `
    • Canada
  • Europe
    • Germany
    • The UK
    • France
    • Spain
    • Italy
    • Rest of Europe
  • Asia Pacific
    • China
    • Japan
    • India
    • South Korea
    • Southeast Asia
    • Rest of Asia Pacific
  • Latin America
    • Brazil
    • Mexico
    • Rest of Latin America
  • Middle East & Africa
    • GCC
    • South Africa
    • Rest of Middle East & Africa

Table of Content

  1. CHAPTER 1. Executive Summary
  2. CHAPTER 2. Galacto-Oligosaccharide (GOS) market – Application Analysis
    1. 2.1. Global Galacto-Oligosaccharide (GOS) Market – Application Overview
    2. 2.2. Global Galacto-Oligosaccharide (GOS) Market Share, by Application, 2019 & 2026 (USD Million)
    3. 2.3. Detergent Packaging
      1. 2.3.1. Global Detergent Packaging Galacto-Oligosaccharide (GOS) Market, 2016-2026 (USD Million)
    4. 2.4. Agrochemical Packaging
      1. 2.4.1. Global Agrochemical Packaging Galacto-Oligosaccharide (GOS) Market, 2016-2026 (USD Million)
    5. 2.5. Laundry Bags
      1. 2.5.1. Global Laundry Bags Galacto-Oligosaccharide (GOS) Market, 2016-2026 (USD Million)
    6. 2.6. Embroidery
      1. 2.6.1. Global Embroidery Galacto-Oligosaccharide (GOS) Market, 2016-2026 (USD Million)
  3. CHAPTER 3. Galacto-Oligosaccharide (GOS) market – Product Type Analysis
    1. 3.1. Global Galacto-Oligosaccharide (GOS) Market – Product Type Overview
    2. 3.2. Global Galacto-Oligosaccharide (GOS) Market Share, by Product Type, 2019 & 2026 (USD Million)
    3. 3.3. Liquid
      1. 3.3.1. Global Liquid Galacto-Oligosaccharide (GOS) Market, 2016-2026 (USD Million)
    4. 3.4. Powder
      1. 3.4.1. Global Powder Galacto-Oligosaccharide (GOS) Market, 2016-2026 (USD Million)
  4. CHAPTER 4. Galacto-Oligosaccharide (GOS) market – Function Analysis
    1. 4.1. Global Galacto-Oligosaccharide (GOS) Market – Function Overview
    2. 4.2. Global Galacto-Oligosaccharide (GOS) Market Share, by Function, 2019 & 2026 (USD Million)
    3. 4.3. Prebiotics
      1. 4.3.1. Global Prebiotics Galacto-Oligosaccharide (GOS) Market, 2016-2026 (USD Million)
    4. 4.4. Sweetner
      1. 4.4.1. Global Sweetner Galacto-Oligosaccharide (GOS) Market, 2016-2026 (USD Million)
  5. CHAPTER 5. Galacto-Oligosaccharide (GOS) market – Application Analysis
    1. 5.1. Global Galacto-Oligosaccharide (GOS) Market – Application Overview
    2. 5.2. Global Galacto-Oligosaccharide (GOS) Market Share, by Application, 2019 & 2026 (USD Million)
    3. 5.3. Prebiotic Food and Beverages
      1. 5.3.1. Global Prebiotic Food and Beverages Galacto-Oligosaccharide (GOS) Market, 2016-2026 (USD Million)
    4. 5.4. Prebiotic Dietary Supplements
      1. 5.4.1. Global Prebiotic Dietary Supplements Galacto-Oligosaccharide (GOS) Market, 2016-2026 (USD Million)
    5. 5.5. Animal Feed
      1. 5.5.1. Global Animal Feed Galacto-Oligosaccharide (GOS) Market, 2016-2026 (USD Million)
    6. 5.6. Pharmaceuticals
      1. 5.6.1. Global Pharmaceuticals Galacto-Oligosaccharide (GOS) Market, 2016-2026 (USD Million)
    7. 5.7. Others
      1. 5.7.1. Global Others Galacto-Oligosaccharide (GOS) Market, 2016-2026 (USD Million)
  6. CHAPTER 6. Galacto-Oligosaccharide (GOS) market – Regional Analysis
    1. 6.1. Global Galacto-Oligosaccharide (GOS) Market Regional Overview
    2. 6.2. Global Galacto-Oligosaccharide (GOS) Market Share, by Region, 2019 & 2026 (Value)
    3. 6.3. North America
      1. 6.3.1. North America Galacto-Oligosaccharide (GOS) Market size and forecast, 2016-2026
      2. 6.3.2. North America Galacto-Oligosaccharide (GOS) Market, by Country, 2019 & 2026 (USD Million)
      3. 6.3.3. North America Galacto-Oligosaccharide (GOS) Market, by Application, 2016-2026
        1. 6.3.3.1. North America Galacto-Oligosaccharide (GOS) Market, by Application, 2016-2026 (USD Million)
      4. 6.3.4. North America Galacto-Oligosaccharide (GOS) Market, by Product Type, 2016-2026
        1. 6.3.4.1. North America Galacto-Oligosaccharide (GOS) Market, by Product Type, 2016-2026 (USD Million)
      5. 6.3.5. North America Galacto-Oligosaccharide (GOS) Market, by Function, 2016-2026
        1. 6.3.5.1. North America Galacto-Oligosaccharide (GOS) Market, by Function, 2016-2026 (USD Million)
      6. 6.3.6. North America Galacto-Oligosaccharide (GOS) Market, by Application, 2016-2026
        1. 6.3.6.1. North America Galacto-Oligosaccharide (GOS) Market, by Application, 2016-2026 (USD Million)
          1. 6.3.7. U.S.
            1. 6.3.7.1. U.S. Market size and forecast, 2016-2026 (USD Million)
      7. 6.3.8. Canada
        1. 6.3.8.1. Canada Market size and forecast, 2016-2026 (USD Million)
    4. 6.4. Europe
      1. 6.4.1. Europe Galacto-Oligosaccharide (GOS) Market size and forecast, 2016-2026
      2. 6.4.2. Europe Galacto-Oligosaccharide (GOS) Market, by Country, 2019 & 2026 (USD Million)
      3. 6.4.3. Europe Galacto-Oligosaccharide (GOS) Market, by Application, 2016-2026
        1. 6.4.3.1. Europe Galacto-Oligosaccharide (GOS) Market, by Application, 2016-2026 (USD Million)
      4. 6.4.4. Europe Galacto-Oligosaccharide (GOS) Market, by Product Type, 2016-2026
        1. 6.4.4.1. Europe Galacto-Oligosaccharide (GOS) Market, by Product Type, 2016-2026 (USD Million)
      5. 6.4.5. Europe Galacto-Oligosaccharide (GOS) Market, by Function, 2016-2026
        1. 6.4.5.1. Europe Galacto-Oligosaccharide (GOS) Market, by Function, 2016-2026 (USD Million)
      6. 6.4.6. Europe Galacto-Oligosaccharide (GOS) Market, by Application, 2016-2026
        1. 6.4.6.1. Europe Galacto-Oligosaccharide (GOS) Market, by Application, 2016-2026 (USD Million)
      7. 6.4.7. Germany
        1. 6.4.7.1. Germany Market size and forecast, 2016-2026 (USD Million)
      8. 6.4.8. France
        1. 6.4.8.1. France Market size and forecast, 2016-2026 (USD Million)
          1. 6.4.9. U.K.
            1. 6.4.9.1. U.K. Market size and forecast, 2016-2026 (USD Million)
      9. 6.4.10. Italy
        1. 6.4.10.1. Italy Market size and forecast, 2016-2026 (USD Million)
      10. 6.4.11. Spain
        1. 6.4.11.1. Spain Market size and forecast, 2016-2026 (USD Million)
      11. 6.4.12. Rest of Europe
        1. 6.4.12.1. Rest of Europe Market size and forecast, 2016-2026 (USD Million)
    5. 6.5. Asia Pacific
      1. 6.5.1. Asia Pacific Galacto-Oligosaccharide (GOS) Market size and forecast, 2016-2026
      2. 6.5.2. Asia Pacific Galacto-Oligosaccharide (GOS) Market, by Country, 2019 & 2026 (USD Million)
      3. 6.5.3. Asia Pacific Galacto-Oligosaccharide (GOS) Market, by Application, 2016-2026
        1. 6.5.3.1. Asia Pacific Galacto-Oligosaccharide (GOS) Market, by Application, 2016-2026 (USD Million)
      4. 6.5.4. Asia Pacific Galacto-Oligosaccharide (GOS) Market, by Product Type, 2016-2026
        1. 6.5.4.1. Asia Pacific Galacto-Oligosaccharide (GOS) Market, by Product Type, 2016-2026 (USD Million)
      5. 6.5.5. Asia Pacific Galacto-Oligosaccharide (GOS) Market, by Function, 2016-2026
        1. 6.5.5.1. Asia Pacific Galacto-Oligosaccharide (GOS) Market, by Function, 2016-2026 (USD Million)
      6. 6.5.6. Asia Pacific Galacto-Oligosaccharide (GOS) Market, by Application, 2016-2026
        1. 6.5.6.1. Asia Pacific Galacto-Oligosaccharide (GOS) Market, by Application, 2016-2026 (USD Million)
      7. 6.5.7. China
        1. 6.5.7.1. China Market size and forecast, 2016-2026 (USD Million)
      8. 6.5.8. Japan
        1. 6.5.8.1. Japan Market size and forecast, 2016-2026 (USD Million)
      9. 6.5.9. India
        1. 6.5.9.1. India Market size and forecast, 2016-2026 (USD Million)
      10. 6.5.10. South Korea
        1. 6.5.10.1. South Korea Market size and forecast, 2016-2026 (USD Million)
      11. 6.5.11. South-East Asia
        1. 6.5.11.1. South-East Asia Market size and forecast, 2016-2026 (USD Million)
      12. 6.5.12. Rest of Asia Pacific
        1. 6.5.12.1. Rest of Asia Pacific Market size and forecast, 2016-2026 (USD Million)
    6. 6.6. Latin America
      1. 6.6.1. Latin America Galacto-Oligosaccharide (GOS) Market size and forecast, 2016-2026
      2. 6.6.2. Latin America Galacto-Oligosaccharide (GOS) Market, by Country, 2019 & 2026 (USD Million)
      3. 6.6.3. Latin America Galacto-Oligosaccharide (GOS) Market, by Application, 2016-2026
        1. 6.6.3.1. Latin America Galacto-Oligosaccharide (GOS) Market, by Application, 2016-2026 (USD Million)
      4. 6.6.4. Latin America Galacto-Oligosaccharide (GOS) Market, by Product Type, 2016-2026
        1. 6.6.4.1. Latin America Galacto-Oligosaccharide (GOS) Market, by Product Type, 2016-2026 (USD Million)
      5. 6.6.5. Latin America Galacto-Oligosaccharide (GOS) Market, by Function, 2016-2026
        1. 6.6.5.1. Latin America Galacto-Oligosaccharide (GOS) Market, by Function, 2016-2026 (USD Million)
      6. 6.6.6. Latin America Galacto-Oligosaccharide (GOS) Market, by Application, 2016-2026
        1. 6.6.6.1. Latin America Galacto-Oligosaccharide (GOS) Market, by Application, 2016-2026 (USD Million)
      7. 6.6.7. Brazil
        1. 6.6.7.1. Brazil Market size and forecast, 2016-2026 (USD Million)
      8. 6.6.8. Mexico
        1. 6.6.8.1. Mexico Market size and forecast, 2016-2026 (USD Million)
      9. 6.6.9. Rest of Latin America
        1. 6.6.9.1. Rest of Latin America Market size and forecast, 2016-2026 (USD Million)
    7. 6.7. The Middle-East and Africa
      1. 6.7.1. The Middle-East and Africa Galacto-Oligosaccharide (GOS) Market size and forecast, 2016-2026
      2. 6.7.2. The Middle-East and Africa Galacto-Oligosaccharide (GOS) Market, by Country, 2019 & 2026 (USD Million)
      3. 6.7.3. The Middle-East and Africa Galacto-Oligosaccharide (GOS) Market, by Application, 2016-2026
        1. 6.7.3.1. The Middle-East and Africa Galacto-Oligosaccharide (GOS) Market, by Application, 2016-2026 (USD Million)
      4. 6.7.4. The Middle-East and Africa Galacto-Oligosaccharide (GOS) Market, by Product Type, 2016-2026
        1. 6.7.4.1. The Middle-East and Africa Galacto-Oligosaccharide (GOS) Market, by Product Type, 2016-2026 (USD Million)
      5. 6.7.5. The Middle-East and Africa Galacto-Oligosaccharide (GOS) Market, by Function, 2016-2026
        1. 6.7.5.1. The Middle-East and Africa Galacto-Oligosaccharide (GOS) Market, by Function, 2016-2026 (USD Million)
      6. 6.7.6. The Middle-East and Africa Galacto-Oligosaccharide (GOS) Market, by Application, 2016-2026
        1. 6.7.6.1. The Middle-East and Africa Galacto-Oligosaccharide (GOS) Market, by Application, 2016-2026 (USD Million)
      7. 6.7.7. GCC Countries
        1. 6.7.7.1. GCC Countries Market size and forecast, 2016-2026 (USD Million)
      8. 6.7.8. South Africa
        1. 6.7.8.1. South Africa Market size and forecast, 2016-2026 (USD Million)
      9. 6.7.9. Rest of Middle-East Africa
        1. 6.7.9.1. Rest of Middle-East Africa Market size and forecast, 2016-2026 (USD Million)
  7. CHAPTER 7. Galacto-Oligosaccharide (GOS) market – Competitive Landscape
    1. 7.1. Competitor Market Share – Revenue
    2. 7.2. Market Concentration Rate Analysis, Top 3 and Top 5 Players
    3. 7.3. Strategic Development
      1. 7.3.1. Acquisitions and Mergers
      2. 7.3.2. New Products
      3. 7.3.3. Research & Development Activities
  8. CHAPTER 8. Company Profiles
    1. 8.1. Royal Friesland Campina N.V
      1. 8.1.1. Company Overview
      2. 8.1.2. Royal Friesland Campina N.V Revenue and Gross Margin
      3. 8.1.3. Product portfolio
      4. 8.1.4. Recent initiatives
    2. 8.2. Yakult Pharmaceuticals Pvt Ltd
      1. 8.2.1. Company Overview
      2. 8.2.2. Yakult Pharmaceuticals Pvt Ltd Revenue and Gross Margin
      3. 8.2.3. Product portfolio
      4. 8.2.4. Recent initiatives
    3. 8.3. Baolingbao Biology Co
      1. 8.3.1. Company Overview
      2. 8.3.2. Baolingbao Biology Co Revenue and Gross Margin
      3. 8.3.3. Product portfolio
      4. 8.3.4. Recent initiatives
    4. 8.4. Nissin Sugar Co., Ltd.
      1. 8.4.1. Company Overview
      2. 8.4.2. Nissin Sugar Co., Ltd. Revenue and Gross Margin
      3. 8.4.3. Product portfolio
      4. 8.4.4. Recent initiatives
    5. 8.5. Kerry Inc.
      1. 8.5.1. Company Overview
      2. 8.5.2. Kerry Inc. Revenue and Gross Margin
      3. 8.5.3. Product portfolio
      4. 8.5.4. Recent initiatives
    6. 8.6. Quantum Hi-Tech (China) Biological Co., Ltd.
      1. 8.6.1. Company Overview
      2. 8.6.2. Quantum Hi-Tech (China) Biological Co., Ltd. Revenue and Gross Margin
      3. 8.6.3. Product portfolio
      4. 8.6.4. Recent initiatives
    7. 8.7. Ingredion Incorporated
      1. 8.7.1. Company Overview
      2. 8.7.2. Ingredion Incorporated Revenue and Gross Margin
      3. 8.7.3. Product portfolio
      4. 8.7.4. Recent initiatives
    8. 8.8. Dairy Crest
      1. 8.8.1. Company Overview
      2. 8.8.2. Dairy Crest Revenue and Gross Margin
      3. 8.8.3. Product portfolio
      4. 8.8.4. Recent initiatives
    9. 8.9. New Francisco Biotech Company, Ltd
      1. 8.9.1. Company Overview
      2. 8.9.2. New Francisco Biotech Company, Ltd Revenue and Gross Margin
      3. 8.9.3. Product portfolio
      4. 8.9.4. Recent initiatives
    10. 8.10. Samyang Corporation.
      1. 8.10.1. Company Overview
      2. 8.10.2. Samyang Corporation. Revenue and Gross Margin
      3. 8.10.3. Product portfolio
      4. 8.10.4. Recent initiatives
  9. CHAPTER 9. Galacto-Oligosaccharide (GOS) — Industry Analysis
    1. 9.1. Galacto-Oligosaccharide (GOS) Market – Key Trends
      1. 9.1.1. Market Drivers
      2. 9.1.2. Market Restraints
      3. 9.1.3. Market Opportunities
    2. 9.2. Value Chain Analysis
    3. 9.3. Technology Roadmap and Timeline
    4. 9.4. Galacto-Oligosaccharide (GOS) Market – Attractiveness Analysis
      1. 9.4.1. By Application
      2. 9.4.2. By Product Type
      3. 9.4.3. By Function
      4. 9.4.4. By Application
      5. 9.4.5. By Region
  10. CHAPTER 10. Marketing Strategy Analysis, Distributors
    1. 10.1. Marketing Channel
    2. 10.2. Direct Marketing
    3. 10.3. Indirect Marketing
    4. 10.4. Marketing Channel Development Trend
    5. 10.5. Economic/Political Environmental Change
  11. CHAPTER 11. Report Conclusion
  12. CHAPTER 12. Research Approach & Methodology
    1. 12.1. Report Description
    2. 12.2. Research Scope
    3. 12.3. Research Methodology
      1. 12.3.1. Secondary Research
      2. 12.3.2. Primary Research
      3. 12.3.3. Models
        1. 12.3.3.1. Company Share Analysis Model
        2. 12.3.3.2. Revenue Based Modeling
        3. 12.3.3.3. Research Limitations
  •  

    List of Figures

    FIG. 1 Global Galacto-Oligosaccharide (GOS) Market, 2016-2026 (USD Million)
    FIG. 2 Global Galacto-Oligosaccharide (GOS) Market Share, by Application, 2019 & 2026 (USD Million)
    FIG. 3 Global Detergent Packaging Galacto-Oligosaccharide (GOS) Market, 2016-2026 (USD Million)
    FIG. 4 Global Agrochemical Packaging Galacto-Oligosaccharide (GOS) Market, 2016-2026 (USD Million)
    FIG. 5 Global Laundry Bags Galacto-Oligosaccharide (GOS) Market, 2016-2026 (USD Million)
    FIG. 6 Global Embroidery Galacto-Oligosaccharide (GOS) Market, 2016-2026 (USD Million)
    FIG. 7 Global Galacto-Oligosaccharide (GOS) Market Share, by Product Type, 2019 & 2026 (USD Million)
    FIG. 8 Global Liquid Galacto-Oligosaccharide (GOS) Market, 2016-2026 (USD Million)
    FIG. 9 Global Powder Galacto-Oligosaccharide (GOS) Market, 2016-2026 (USD Million)
    FIG. 10 Global Galacto-Oligosaccharide (GOS) Market Share, by Function, 2019 & 2026 (USD Million)
    FIG. 11 Global Prebiotics Galacto-Oligosaccharide (GOS) Market, 2016-2026 (USD Million)
    FIG. 12 Global Sweetner Galacto-Oligosaccharide (GOS) Market, 2016-2026 (USD Million)
    FIG. 13 Global Galacto-Oligosaccharide (GOS) Market Share, by Application, 2019 & 2026 (USD Million)
    FIG. 14 Global Prebiotic Food and Beverages Galacto-Oligosaccharide (GOS) Market, 2016-2026 (USD Million)
    FIG. 15 Global Prebiotic Dietary Supplements Galacto-Oligosaccharide (GOS) Market, 2016-2026 (USD Million)
    FIG. 16 Global Animal Feed Galacto-Oligosaccharide (GOS) Market, 2016-2026 (USD Million)
    FIG. 17 Global Pharmaceuticals Galacto-Oligosaccharide (GOS) Market, 2016-2026 (USD Million)
    FIG. 18 Global Others Galacto-Oligosaccharide (GOS) Market, 2016-2026 (USD Million)
    FIG. 19 Global Galacto-Oligosaccharide (GOS) Market Share, by Region, 2019 & 2026
    FIG. 20 North America Galacto-Oligosaccharide (GOS) Market, 2016-2026
    FIG. 21 U.S. Galacto-Oligosaccharide (GOS) Market, 2016-2026
    FIG. 22 Canada Galacto-Oligosaccharide (GOS) Market, 2016-2026
    FIG. 23 Europe Galacto-Oligosaccharide (GOS) Market, 2016-2026
    FIG. 24 Germany Galacto-Oligosaccharide (GOS) Market, 2016-2026
    FIG. 25 France Galacto-Oligosaccharide (GOS) Market, 2016-2026
    FIG. 26 U.K. Galacto-Oligosaccharide (GOS) Market, 2016-2026
    FIG. 27 Italy Galacto-Oligosaccharide (GOS) Market, 2016-2026
    FIG. 28 Spain Galacto-Oligosaccharide (GOS) Market, 2016-2026
    FIG. 29 Rest of Europe Galacto-Oligosaccharide (GOS) Market, 2016-2026
    FIG. 30 Asia Pacific Galacto-Oligosaccharide (GOS) Market, 2016-2026
    FIG. 31 China Galacto-Oligosaccharide (GOS) Market, 2016-2026
    FIG. 32 Japan Galacto-Oligosaccharide (GOS) Market, 2016-2026
    FIG. 33 India Galacto-Oligosaccharide (GOS) Market, 2016-2026
    FIG. 34 South  Korea Galacto-Oligosaccharide (GOS) Market, 2016-2026
    FIG. 35 South-East Asia Galacto-Oligosaccharide (GOS) Market, 2016-2026
    FIG. 36 Rest of Asia Pacific Galacto-Oligosaccharide (GOS) Market, 2016-2026
    FIG. 37 Latin America Galacto-Oligosaccharide (GOS) Market, 2016-2026
    FIG. 38 Brazil Galacto-Oligosaccharide (GOS) Market, 2016-2026
    FIG. 39 Mexico Galacto-Oligosaccharide (GOS) Market, 2016-2026
    FIG. 40 Rest of Latin America Galacto-Oligosaccharide (GOS) Market, 2016-2026
    FIG. 41 The Middle-East and Africa Galacto-Oligosaccharide (GOS) Market, 2016-2026
    FIG. 42 GCC Countries Galacto-Oligosaccharide (GOS) Market, 2016-2026
    FIG. 43 South Africa Galacto-Oligosaccharide (GOS) Market, 2016-2026
    FIG. 44 Rest of Middle-East Africa Galacto-Oligosaccharide (GOS) Market, 2016-2026
    FIG. 45 Competitor Market Share – Revenue
    FIG. 46 Royal Friesland Campina N.V Revenue and Growth Rate
    FIG. 47 Royal Friesland Campina N.V Market Share
    FIG. 48 Yakult Pharmaceuticals Pvt Ltd Revenue and Growth Rate
    FIG. 49 Yakult Pharmaceuticals Pvt Ltd Market Share
    FIG. 50 Baolingbao Biology Co Revenue and Growth Rate
    FIG. 51 Baolingbao Biology Co Market Share
    FIG. 52 Nissin Sugar Co., Ltd. Revenue and Growth Rate
    FIG. 53 Nissin Sugar Co., Ltd. Market Share
    FIG. 54 Kerry Inc. Revenue and Growth Rate
    FIG. 55 Kerry Inc. Market Share
    FIG. 56 Quantum Hi-Tech (China) Biological Co., Ltd. Revenue and Growth Rate
    FIG. 57 Quantum Hi-Tech (China) Biological Co., Ltd. Market Share
    FIG. 58 Ingredion Incorporated Revenue and Growth Rate
    FIG. 59 Ingredion Incorporated Market Share
    FIG. 60 Dairy Crest Revenue and Growth Rate
    FIG. 61 Dairy Crest Market Share
    FIG. 62 New Francisco Biotech Company, Ltd Revenue and Growth Rate
    FIG. 63 New Francisco Biotech Company, Ltd Market Share
    FIG. 64 Samyang Corporation. Revenue and Growth Rate
    FIG. 65 Samyang Corporation. Market Share
    FIG. 66 Market Dynamics
    FIG. 67 Global Galacto-Oligosaccharide (GOS) – Value Chain Analysis
    FIG. 68 Technology Roadmap and Timeline
    FIG. 69 Market Attractiveness Analysis – By Application
    FIG. 70 Market Attractiveness Analysis – By Product Type
    FIG. 71 Market Attractiveness Analysis – By Function
    FIG. 72 Market Attractiveness Analysis – By Application
    FIG. 73 Market Attractiveness Analysis – By Region
    FIG. 74 Market Channel
    FIG. 75 Marketing Channel Development Trend
    FIG. 76 Growth in World Gross Product, 2008-2019

    List of Tables

    TABLE 1 Global Galacto-Oligosaccharide (GOS) Market, 2019 & 2026 (USD Million)
    TABLE 2 Global Galacto-Oligosaccharide (GOS) market, by Application, 2016-2026 (USD Million)
    TABLE 3 Global Galacto-Oligosaccharide (GOS) market, by Product Type, 2016-2026 (USD Million)
    TABLE 4 Global Galacto-Oligosaccharide (GOS) market, by Function, 2016-2026 (USD Million)
    TABLE 5 Global Galacto-Oligosaccharide (GOS) market, by Application, 2016-2026 (USD Million)
    TABLE 6 Global Galacto-Oligosaccharide (GOS) market, by Region, 2016-2026 (USD Million)
    TABLE 7 North America Galacto-Oligosaccharide (GOS) Market, by Application, 2016-2026 (USD Million)
    TABLE 8 North America Galacto-Oligosaccharide (GOS) Market, by Product Type, 2016-2026 (USD Million)
    TABLE 9 North America Galacto-Oligosaccharide (GOS) Market, by Function, 2016-2026 (USD Million)
    TABLE 10 North America Galacto-Oligosaccharide (GOS) Market, by Application, 2016-2026 (USD Million)
    TABLE 11 Europe Galacto-Oligosaccharide (GOS) Market, by Application, 2016-2026 (USD Million)
    TABLE 12 Europe Galacto-Oligosaccharide (GOS) Market, by Product Type, 2016-2026 (USD Million)
    TABLE 13 Europe Galacto-Oligosaccharide (GOS) Market, by Function, 2016-2026 (USD Million)
    TABLE 14 Europe Galacto-Oligosaccharide (GOS) Market, by Application, 2016-2026 (USD Million)
    TABLE 15 Asia Pacific Galacto-Oligosaccharide (GOS) Market, by Application, 2016-2026 (USD Million)
    TABLE 16 Asia Pacific Galacto-Oligosaccharide (GOS) Market, by Product Type, 2016-2026 (USD Million)
    TABLE 17 Asia Pacific Galacto-Oligosaccharide (GOS) Market, by Function, 2016-2026 (USD Million)
    TABLE 18 Asia Pacific Galacto-Oligosaccharide (GOS) Market, by Application, 2016-2026 (USD Million)
    TABLE 19 Latin America Galacto-Oligosaccharide (GOS) Market, by Application, 2016-2026 (USD Million)
    TABLE 20 Latin America Galacto-Oligosaccharide (GOS) Market, by Product Type, 2016-2026 (USD Million)
    TABLE 21 Latin America Galacto-Oligosaccharide (GOS) Market, by Function, 2016-2026 (USD Million)
    TABLE 22 Latin America Galacto-Oligosaccharide (GOS) Market, by Application, 2016-2026 (USD Million)
    TABLE 23 The Middle-East and Africa Galacto-Oligosaccharide (GOS) Market, by Application, 2016-2026 (USD Million)
    TABLE 24 The Middle-East and Africa Galacto-Oligosaccharide (GOS) Market, by Product Type, 2016-2026 (USD Million)
    TABLE 25 The Middle-East and Africa Galacto-Oligosaccharide (GOS) Market, by Function, 2016-2026 (USD Million)
    TABLE 26 The Middle-East and Africa Galacto-Oligosaccharide (GOS) Market, by Application, 2016-2026 (USD Million)
    TABLE 27 Global Galacto-Oligosaccharide (GOS) Market - Company Revenue Analysis 2016-2019 (USD Million)
    TABLE 28 Global Galacto-Oligosaccharide (GOS) Market - Company Revenue Share Analysis 2016-2019(%)
    TABLE 29 Acquisitions and Mergers
    TABLE 30 New Product/Service Launch
    TABLE 31 Research & Development Activities
    TABLE 32 Market Drivers
    TABLE 33 Market Restraints
    TABLE 34 Market Opportunities
  • Industry Major Market Players

    • Royal Friesland Campina N.V
    • Yakult Pharmaceuticals Pvt Ltd
    • Baolingbao Biology Co.
    • Nissin Sugar Co. Ltd.
    • Kerry Inc.
    • Quantum Hi-Tech (China) Biological Co. Ltd.
    • Ingredion Incorporated
    • Dairy Crest.
    • New Francisco Biotech Company Ltd. and Samyang Corporation.