Search Market Research Report

Discover Our Latest Reports
Discover Our Featured Reports
Discover Top Selling Reports

Fungicides Market Size, Share Global Analysis Report, 2021 - 2026

report img

Fungicides Market By Type (Chemical & Biological), By Crop Type (Cereals, Oilseeds & Pulses, Fruits & vegetables, & Others), By Application (Foliar Treatment, Chemigation, Seed Treatment, & Others), And By Regions - Global & Regional Industry Perspective, Comprehensive Analysis, and Forecast 2021 - 2026

Industry Insights

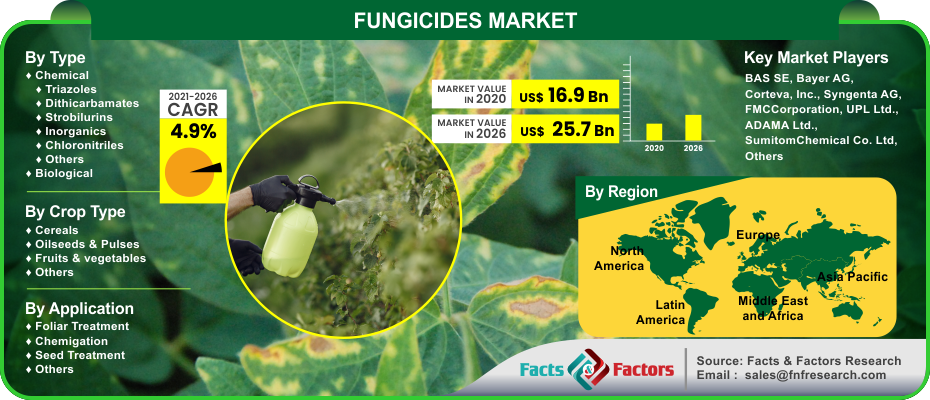
[198+ Pages Report] Facts & Factors published “Global Fungicides Market” report encompasses the spectacle of the market in an analytical and comprehensive manner. In this report, the global fungicides market is projected to value USD 25.7 Billion by 2026 from an initial value of USD 16.9 Billion in the year 2020 growing at a CAGR value of 4.9%.

logoMarket Overview

Fungicides are biological chemical compounds or biological organisms that are often used for killing parasites fungi and their accompanying spores. A fungicide often surrounds its own growth formations. Fungi are often the main factor causing substantial damage in the sector of agriculture in terms of fighting fungal infections in animals. Chemicals such as oomycetes which belong to the same family as fungicides are required for repairing and protecting infected plants.

logoIndustry Growth Factors

The global fungicides market is expected to register a higher market share during the advent of the forecast period owing to contributing factors such as an increase in demand for food security measures owing to rising population coupled with advancements in farming practices and techniques to name a few. Additionally, changing climatic conditions on a global purview owing to rising occurrences of diseases coupled with increasing instances of growing resistance against fungicides is expected to increase the footprint of the global fungicides market during the advent of the forecast period. Moreover, the introduction of novel fungicide products during the advent of the forecast duration owing to the outbreak of several diseases skyrocketing is expected to fuel the growth of the global fungicides market.

The global fungicides market is driven by the rising amount of countries dependent on agriculturally based GDPs coupled with an increasing amount of agriculturally based global bodies extending support to name a few. Rising usage of organic-based products coupled with an increasing amount of products by the key market participants is expected to boost the growth of the global fungicides market during the advent of the forecast period. However, disruptions in the supply chains due to the ongoing pandemic coupled with rising incidences of fungicides during the advent of the forecast period is expected to decrease the growth of the global fungicides market.

Fungicides Market

To know more about this report | Request Free Sample Copy

logoSegmentation Analysis

The global fungicides market is segmented into product, crop types, application, and region.

On the basis of type, the global fungicides market is divided into chemical and biological. The segment pertaining to chemicals is expected to witness the largest market share during the advent of the forecast period owing to the latter’s immediate effect in controlling and regulating the growth of the fungi coupled with major applications in the sector of cereals and fruits & vegetables to name a few. Based on crop type, the global fungicides market is categorized into cereals, oilseeds & pulses, fruits & vegetables, and others. The cereals segment is expected to occupy the largest market share during the advent of the forecast period owing to the latter being a staple food in regions such as America, Europe, and Asia-Pacific coupled with rising demand arising from increased production and vice versa to name a few. On the basis of application, the global fungicides market is fragmented into foliar treatment, chemigation, seed treatment, and others. The segment pertaining to foliar treatment is expected to witness the largest market share during the advent of the forecast period owing to a uniform application process w.r.t a low fungicide volume per hectare coupled with the latter covering vulnerable plant surfaces while blocking the entry of other pathogens to name a few.

logo Report Scope

Report Attribute

Details

Market Size in 2020

USD 16.9 Billion

Projected Market Size in 2026

USD 25.7 Billion

CAGR Growth Rate

4.9% CAGR

Base Year

2020

Forecast Years

2021-2026

Key Market Players

BAS SE, Bayer AG, Corteva, Inc., Syngenta AG, FMCCorporation, UPL Ltd., ADAMA Ltd., SumitomChemical Co. Ltd, Nufarm, Isagro SpA, CropScience, Dow AgroSciences, Lanxess AG, Monsanto, Adama Agricultural Solutions, Simonis B.V., Drexel Chemical Company, Biostadt India Limited, and Heranba Industries Ltd, among others.

Key Segment

Type, Crop Type, Application, and Region

Major Regions Covered

North America, Europe, Asia Pacific, Latin America, and Middle East & Africa

Purchase Options

Request customized purchase options to meet your research needs. Explore purchase options

logo Regional Analysis

Asia-Pacific is expected to witness the largest market share during the advent of the forecast period owing to a rising population sector, increasing population, and growing rice cultivations to name a few. Additionally, rising instances of post-harvest losses coupled with the region being the home to China which is deemed as the global leader in terms of production and export rates is expected to increase the footprint of the fungicides market during the forecast period. Factors such as increased production such as rice, sugar beet, fruits & vegetables, cereals, and grains coupled with rising consumption patterns is expected to further boost the growth of the fungicides market during the advent of the forecast period. Europe is expected to occupy a substantial market share owing to rising occurrence of climatic changes leading to the onset of various diseases coupled with the region being the home to a stronger market presence in terms of a large number of key market participants.

logo Competitive Players

The key market participants for the global fungicides market are :

  • BAS SE
  • Bayer AG
  • Corteva Inc.
  • Syngenta AG
  • FMCCorporation
  • UPL Ltd.
  • ADAMA Ltd.
  • SumitomChemical Co. Ltd
  • Nufarm
  • Isagro SpA
  • CropScience
  • Dow AgroSciences
  • Lanxess AG
  • Monsanto
  • Adama Agricultural Solutions
  • Simonis B.V.
  • Drexel Chemical Company
  • Biostadt India Limited
  • Heranba Industries Ltd

logo By Type Segment Analysis

  • Chemical
    • Triazoles
    • Dithicarbamates
    • Strobilurins
    • Inorganics
    • Chloronitriles
    • Others
  • Biological

logo By Crop Type Segment Analysis

  • Cereals
  • Oilseeds & Pulses
  • Fruits & vegetables
  • Others

logo By Application Segment Analysis

  • Foliar Treatment
  • Chemigation
  • Seed Treatment
  • Others

logo By Regional Segment Analysis

  • North America
    • U.S.
    • Canada
  • Europe
    • UK
    • France
    • Germany
    • Italy
    • Spain
    • Rest of Europe
  • Asia Pacific
    • China
    • Japan
    • India
    • South Korea
    • Southeast Asia
    • Rest of Asia Pacific
  • Latin America
    • Brazil
    • Mexico
    • Rest of Latin America
  • Middle East and Africa
    • GCC Countries
    • South Africa
    • Rest of MEA

Table of Content

  1. Chapter 1 Executive Summary
    1. 1.1. Introduction of Fungicides
    2. 1.2. Global Fungicides Market, 2019 & 2026 (USD Billion)
    3. 1.3. Global Fungicides Market, 2016 – 2026 (USD Billion)
    4. 1.4. Global Fungicides Market Absolute Revenue Opportunity, 2016 – 2026 (USD Billion)
    5. 1.5. Global Fungicides Market Incremental Revenue Opportunity, 2020 – 2026 (USD Billion)
  2. Chapter 2 Fungicides Market – Type Analysis
    1. 2.1. Global Fungicides Market – Type Overview
    2. 2.2. Global Fungicides Market Share, by Type, 2019 & 2026 (USD Billion)
    3. 2.3. Chemical
      1. 2.3.1. Global Chemical Fungicides Market, 2016 – 2026 (USD Billion)
    4. 2.4. Biological
      1. 2.4.1. Global Biological Fungicides Market, 2016 – 2026 (USD Billion)
  3. Chapter 3 Fungicides Market – Crop Type Analysis
    1. 3.1. Global Fungicides Market – Crop Type Overview
    2. 3.2. Global Fungicides Market Share, by Crop Type, 2019 & 2026 (USD Billion)
    3. 3.3. Cereals
      1. 3.3.1. Global Cereals Fungicides Market, 2016 – 2026 (USD Billion)
    4. 3.4. Oilseeds & Pulses
      1. 3.4.1. Global Oilseeds & Pulses Fungicides Market, 2016 – 2026 (USD Billion)
    5. 3.5. Fruits & vegetables
      1. 3.5.1. Global Fruits & vegetables Fungicides Market, 2016 – 2026 (USD Billion)
    6. 3.6. Others
      1. 3.6.1. Global Others Fungicides Market, 2016 – 2026 (USD Billion)
  4. Chapter 4 Fungicides Market – Application Analysis
    1. 4.1. Global Fungicides Market – Application Overview
    2. 4.2. Global Fungicides Market Share, by Application, 2019 & 2026 (USD Billion)
    3. 4.3. Foliar Treatment
      1. 4.3.1. Global Foliar Treatment Fungicides Market, 2016 – 2026 (USD Billion)
    4. 4.4. Chemigation
      1. 4.4.1. Global Chemigation Fungicides Market, 2016 – 2026 (USD Billion)
    5. 4.5. Seed Treatment
      1. 4.5.1. Global Seed Treatment Fungicides Market, 2016 – 2026 (USD Billion)
    6. 4.6. Others
      1. 4.6.1. Global Others Fungicides Market, 2016 – 2026 (USD Billion)
  5. Chapter 5 Fungicides Market – Regional Analysis
    1. 5.1. Global Fungicides Market Regional Overview
    2. 5.2. Global Fungicides Market Share, by Region, 2019 & 2026 (USD Billion)
    3. 5.3. North America
      1. 5.3.1. North America Fungicides Market, 2016 – 2026 (USD Billion)
        1. 5.3.1.1. North America Fungicides Market, by Country, 2016 - 2026 (USD Billion)
      2. 5.3.2. North America Fungicides Market, by Type, 2016 – 2026
        1. 5.3.2.1. North America Fungicides Market, by Type, 2016 – 2026 (USD Billion)
      3. 5.3.3. North America Fungicides Market, by Crop Type, 2016 – 2026
        1. 5.3.3.1. North America Fungicides Market, by Crop Type, 2016 – 2026 (USD Billion)
      4. 5.3.4. North America Fungicides Market, by Application, 2016 – 2026
        1. 5.3.4.1. North America Fungicides Market, by Application, 2016 – 2026 (USD Billion)
      5. 5.3.5. U.S.
        1. 5.3.5.1. U.S. Fungicides Market, 2016 – 2026 (USD Billion)
      6. 5.3.6. Canada
        1. 5.3.6.1. Canada Fungicides Market, 2016 – 2026 (USD Billion)
    4. 5.4. Europe
      1. 5.4.1. Europe Fungicides Market, 2016 – 2026 (USD Billion)
        1. 5.4.1.1. Europe Fungicides Market, by Country, 2016 - 2026 (USD Billion)
      2. 5.4.2. Europe Fungicides Market, by Type, 2016 – 2026
        1. 5.4.2.1. Europe Fungicides Market, by Type, 2016 – 2026 (USD Billion)
      3. 5.4.3. Europe Fungicides Market, by Crop Type, 2016 – 2026
        1. 5.4.3.1. Europe Fungicides Market, by Crop Type, 2016 – 2026 (USD Billion)
      4. 5.4.4. Europe Fungicides Market, by Application, 2016 – 2026
        1. 5.4.4.1. Europe Fungicides Market, by Application, 2016 – 2026 (USD Billion)
      5. 5.4.5. Germany
        1. 5.4.5.1. Germany Fungicides Market, 2016 – 2026 (USD Billion)
      6. 5.4.6. France
        1. 5.4.6.1. France Fungicides Market, 2016 – 2026 (USD Billion)
      7. 5.4.7. U.K.
        1. 5.4.7.1. U.K. Fungicides Market, 2016 – 2026 (USD Billion)
      8. 5.4.8. Italy
        1. 5.4.8.1. Italy Fungicides Market, 2016 – 2026 (USD Billion)
      9. 5.4.9. Spain
        1. 5.4.9.1. Spain Fungicides Market, 2016 – 2026 (USD Billion)
      10. 5.4.10. Rest of Europe
        1. 5.4.10.1. Rest of Europe Fungicides Market, 2016 – 2026 (USD Billion)
    5. 5.5. Asia Pacific
      1. 5.5.1. Asia Pacific Fungicides Market, 2016 – 2026 (USD Billion)
        1. 5.5.1.1. Asia Pacific Fungicides Market, by Country, 2016 - 2026 (USD Billion)
      2. 5.5.2. Asia Pacific Fungicides Market, by Type, 2016 – 2026
        1. 5.5.2.1. Asia Pacific Fungicides Market, by Type, 2016 – 2026 (USD Billion)
      3. 5.5.3. Asia Pacific Fungicides Market, by Crop Type, 2016 – 2026
        1. 5.5.3.1. Asia Pacific Fungicides Market, by Crop Type, 2016 – 2026 (USD Billion)
      4. 5.5.4. Asia Pacific Fungicides Market, by Application, 2016 – 2026
        1. 5.5.4.1. Asia Pacific Fungicides Market, by Application, 2016 – 2026 (USD Billion)
      5. 5.5.5. China
        1. 5.5.5.1. China Fungicides Market, 2016 – 2026 (USD Billion)
      6. 5.5.6. Japan
        1. 5.5.6.1. Japan Fungicides Market, 2016 – 2026 (USD Billion)
      7. 5.5.7. India
        1. 5.5.7.1. India Fungicides Market, 2016 – 2026 (USD Billion)
      8. 5.5.8. South Korea
        1. 5.5.8.1. South Korea Fungicides Market, 2016 – 2026 (USD Billion)
      9. 5.5.9. South-East Asia
        1. 5.5.9.1. South-East Asia Fungicides Market, 2016 – 2026 (USD Billion)
      10. 5.5.10. Rest of Asia Pacific
        1. 5.5.10.1. Rest of Asia Pacific Fungicides Market, 2016 – 2026 (USD Billion)
    6. 5.6. Latin America
      1. 5.6.1. Latin America Fungicides Market, 2016 – 2026 (USD Billion)
        1. 5.6.1.1. Latin America Fungicides Market, by Country, 2016 - 2026 (USD Billion)
      2. 5.6.2. Latin America Fungicides Market, by Type, 2016 – 2026
        1. 5.6.2.1. Latin America Fungicides Market, by Type, 2016 – 2026 (USD Billion)
      3. 5.6.3. Latin America Fungicides Market, by Crop Type, 2016 – 2026
        1. 5.6.3.1. Latin America Fungicides Market, by Crop Type, 2016 – 2026 (USD Billion)
      4. 5.6.4. Latin America Fungicides Market, by Application, 2016 – 2026
        1. 5.6.4.1. Latin America Fungicides Market, by Application, 2016 – 2026 (USD Billion)
      5. 5.6.5. Brazil
        1. 5.6.5.1. Brazil Fungicides Market, 2016 – 2026 (USD Billion)
      6. 5.6.6. Mexico
        1. 5.6.6.1. Mexico Fungicides Market, 2016 – 2026 (USD Billion)
      7. 5.6.7. Rest of Latin America
        1. 5.6.7.1. Rest of Latin America Fungicides Market, 2016 – 2026 (USD Billion)
    7. 5.7. The Middle-East and Africa
      1. 5.7.1. The Middle-East and Africa Fungicides Market, 2016 – 2026 (USD Billion)
        1. 5.7.1.1. The Middle-East and Africa Fungicides Market, by Country, 2016 - 2026 (USD Billion)
      2. 5.7.2. The Middle-East and Africa Fungicides Market, by Type, 2016 – 2026
        1. 5.7.2.1. The Middle-East and Africa Fungicides Market, by Type, 2016 – 2026 (USD Billion)
      3. 5.7.3. The Middle-East and Africa Fungicides Market, by Crop Type, 2016 – 2026
        1. 5.7.3.1. The Middle-East and Africa Fungicides Market, by Crop Type, 2016 – 2026 (USD Billion)
      4. 5.7.4. The Middle-East and Africa Fungicides Market, by Application, 2016 – 2026
        1. 5.7.4.1. The Middle-East and Africa Fungicides Market, by Application, 2016 – 2026 (USD Billion)
      5. 5.7.5. GCC Countries
        1. 5.7.5.1. GCC Countries Fungicides Market, 2016 – 2026 (USD Billion)
      6. 5.7.6. South Africa
        1. 5.7.6.1. South Africa Fungicides Market, 2016 – 2026 (USD Billion)
      7. 5.7.7. Rest of Middle-East Africa
        1. 5.7.7.1. Rest of Middle-East Africa Fungicides Market, 2016 – 2026 (USD Billion)
  6. Chapter 6 Fungicides Market – Competitive Landscape
    1. 6.1. Competitor Market Share – Revenue
    2. 6.2. Market Concentration Rate Analysis, Top 3 and Top 5 Players
    3. 6.3. Strategic Developments
      1. 6.3.1. Acquisitions and Mergers
      2. 6.3.2. New Products
      3. 6.3.3. Research & Development Activities
  7. Chapter 7 Company Profiles
    1. 7.1. BAS SE
      1. 7.1.1. Company Overview
      2. 7.1.2. Product/Service Portfolio
      3. 7.1.3. BAS SE Sales, Revenue, and Gross Margin
      4. 7.1.4. BAS SE Revenue and Growth Rate
      5. 7.1.5. BAS SE Market Share
      6. 7.1.6. Recent Initiatives, Funding/VC Activities, and Technological Innovations
    2. 7.2. Bayer AG
      1. 7.2.1. Company Overview
      2. 7.2.2. Product/Service Portfolio
      3. 7.2.3. Bayer AG Sales, Revenue, and Gross Margin
      4. 7.2.4. Bayer AG Revenue and Growth Rate
      5. 7.2.5. Bayer AG Market Share
      6. 7.2.6. Recent Initiatives, Funding/VC Activities, and Technological Innovations
    3. 7.3. Corteva Inc
      1. 7.3.1. Company Overview
      2. 7.3.2. Product/Service Portfolio
      3. 7.3.3. Corteva Inc Sales, Revenue, and Gross Margin
      4. 7.3.4. Corteva Inc Revenue and Growth Rate
      5. 7.3.5. Corteva Inc Market Share
      6. 7.3.6. Recent Initiatives, Funding/VC Activities, and Technological Innovations
    4. 7.4. Syngenta AG
      1. 7.4.1. Company Overview
      2. 7.4.2. Product/Service Portfolio
      3. 7.4.3. Syngenta AG Sales, Revenue, and Gross Margin
      4. 7.4.4. Syngenta AG Revenue and Growth Rate
      5. 7.4.5. Syngenta AG Market Share
      6. 7.4.6. Recent Initiatives, Funding/VC Activities, and Technological Innovations
    5. 7.5. FMCCorporation
      1. 7.5.1. Company Overview
      2. 7.5.2. Product/Service Portfolio
      3. 7.5.3. FMCCorporation Sales, Revenue, and Gross Margin
      4. 7.5.4. FMCCorporation Revenue and Growth Rate
      5. 7.5.5. FMCCorporation Market Share
      6. 7.5.6. Recent Initiatives, Funding/VC Activities, and Technological Innovations
    6. 7.6. UPL Ltd
      1. 7.6.1. Company Overview
      2. 7.6.2. Product/Service Portfolio
      3. 7.6.3. UPL Ltd Sales, Revenue, and Gross Margin
      4. 7.6.4. UPL Ltd Revenue and Growth Rate
      5. 7.6.5. UPL Ltd Market Share
      6. 7.6.6. Recent Initiatives, Funding/VC Activities, and Technological Innovations
    7. 7.7. ADAMA Ltd
      1. 7.7.1. Company Overview
      2. 7.7.2. Product/Service Portfolio
      3. 7.7.3. ADAMA Ltd Sales, Revenue, and Gross Margin
      4. 7.7.4. ADAMA Ltd Revenue and Growth Rate
      5. 7.7.5. ADAMA Ltd Market Share
      6. 7.7.6. Recent Initiatives, Funding/VC Activities, and Technological Innovations
    8. 7.8. SumitomChemical Co. Ltd
      1. 7.8.1. Company Overview
      2. 7.8.2. Product/Service Portfolio
      3. 7.8.3. SumitomChemical Co. Ltd Sales, Revenue, and Gross Margin
      4. 7.8.4. SumitomChemical Co. Ltd Revenue and Growth Rate
      5. 7.8.5. SumitomChemical Co. Ltd Market Share
      6. 7.8.6. Recent Initiatives, Funding/VC Activities, and Technological Innovations
    9. 7.9. Nufarm
      1. 7.9.1. Company Overview
      2. 7.9.2. Product/Service Portfolio
      3. 7.9.3. Nufarm Sales, Revenue, and Gross Margin
      4. 7.9.4. Nufarm Revenue and Growth Rate
      5. 7.9.5. Nufarm Market Share
      6. 7.9.6. Recent Initiatives, Funding/VC Activities, and Technological Innovations
    10. 7.10. Isagro SpA
      1. 7.10.1. Company Overview
      2. 7.10.2. Product/Service Portfolio
      3. 7.10.3. Isagro SpA Sales, Revenue, and Gross Margin
      4. 7.10.4. Isagro SpA Revenue and Growth Rate
      5. 7.10.5. Isagro SpA Market Share
      6. 7.10.6. Recent Initiatives, Funding/VC Activities, and Technological Innovations
    11. 7.11. CropScience
      1. 7.11.1. Company Overview
      2. 7.11.2. Product/Service Portfolio
      3. 7.11.3. CropScience Sales, Revenue, and Gross Margin
      4. 7.11.4. CropScience Revenue and Growth Rate
      5. 7.11.5. CropScience Market Share
      6. 7.11.6. Recent Initiatives, Funding/VC Activities, and Technological Innovations
    12. 7.12. Dow AgroSciences
      1. 7.12.1. Company Overview
      2. 7.12.2. Product/Service Portfolio
      3. 7.12.3. Dow AgroSciences Sales, Revenue, and Gross Margin
      4. 7.12.4. Dow AgroSciences Revenue and Growth Rate
      5. 7.12.5. Dow AgroSciences Market Share
      6. 7.12.6. Recent Initiatives, Funding/VC Activities, and Technological Innovations
    13. 7.13. Lanxess AG
      1. 7.13.1. Company Overview
      2. 7.13.2. Product/Service Portfolio
      3. 7.13.3. Lanxess AG Sales, Revenue, and Gross Margin
      4. 7.13.4. Lanxess AG Revenue and Growth Rate
      5. 7.13.5. Lanxess AG Market Share
      6. 7.13.6. Recent Initiatives, Funding/VC Activities, and Technological Innovations
    14. 7.14. Monsanto
      1. 7.14.1. Company Overview
      2. 7.14.2. Product/Service Portfolio
      3. 7.14.3. Monsanto Sales, Revenue, and Gross Margin
      4. 7.14.4. Monsanto Revenue and Growth Rate
      5. 7.14.5. Monsanto Market Share
      6. 7.14.6. Recent Initiatives, Funding/VC Activities, and Technological Innovations
    15. 7.15. Adama Agricultural Solutions
      1. 7.15.1. Company Overview
      2. 7.15.2. Product/Service Portfolio
      3. 7.15.3. Adama Agricultural Solutions Sales, Revenue, and Gross Margin
      4. 7.15.4. Adama Agricultural Solutions Revenue and Growth Rate
      5. 7.15.5. Adama Agricultural Solutions Market Share
      6. 7.15.6. Recent Initiatives, Funding/VC Activities, and Technological Innovations
    16. 7.16. Simonis B.V
      1. 7.16.1. Company Overview
      2. 7.16.2. Product/Service Portfolio
      3. 7.16.3. Simonis B.V Sales, Revenue, and Gross Margin
      4. 7.16.4. Simonis B.V Revenue and Growth Rate
      5. 7.16.5. Simonis B.V Market Share
      6. 7.16.6. Recent Initiatives, Funding/VC Activities, and Technological Innovations
    17. 7.17. Drexel Chemical Company
      1. 7.17.1. Company Overview
      2. 7.17.2. Product/Service Portfolio
      3. 7.17.3. Drexel Chemical Company Sales, Revenue, and Gross Margin
      4. 7.17.4. Drexel Chemical Company Revenue and Growth Rate
      5. 7.17.5. Drexel Chemical Company Market Share
      6. 7.17.6. Recent Initiatives, Funding/VC Activities, and Technological Innovations
    18. 7.18. Biostadt India Limited
      1. 7.18.1. Company Overview
      2. 7.18.2. Product/Service Portfolio
      3. 7.18.3. Biostadt India Limited Sales, Revenue, and Gross Margin
      4. 7.18.4. Biostadt India Limited Revenue and Growth Rate
      5. 7.18.5. Biostadt India Limited Market Share
      6. 7.18.6. Recent Initiatives, Funding/VC Activities, and Technological Innovations
    19. 7.19. Heranba Industries Ltd
      1. 7.19.1. Company Overview
      2. 7.19.2. Product/Service Portfolio
      3. 7.19.3. Heranba Industries Ltd Sales, Revenue, and Gross Margin
      4. 7.19.4. Heranba Industries Ltd Revenue and Growth Rate
      5. 7.19.5. Heranba Industries Ltd Market Share
      6. 7.19.6. Recent Initiatives, Funding/VC Activities, and Technological Innovations
  8. Chapter 8 Fungicides — Industry Analysis
    1. 8.1. Introduction and Taxonomy
    2. 8.2. Fungicides Market – Key Trends
      1. 8.2.1. Market Drivers
      2. 8.2.2. Market Restraints
      3. 8.2.3. Market Opportunities
    3. 8.3. Value Chain Analysis
    4. 8.4. Key Mandates and Regulations
    5. 8.5. Technology Roadmap and Timeline
    6. 8.6. Fungicides Market – Attractiveness Analysis
      1. 8.6.1. By Type
      2. 8.6.2. By Crop Type
      3. 8.6.3. By Application
      4. 8.6.4. By Region
  9. Chapter 9 Industrial Chain, Sourcing Strategy, and Downstream Buyers
    1. 9.1. Fungicides Industrial Chain Analysis
    2. 9.2. Downstream Buyers
    3. 9.3. Distributors/Traders List
  10. Chapter 10 Marketing Strategy Analysis
    1. 10.1. Marketing Channel
    2. 10.2. Direct Marketing
    3. 10.3. Indirect Marketing
    4. 10.4. Marketing Channel Development Trends
    5. 10.5. Economic/Political Environmental Change
  11. Chapter 11 Report Conclusion & Key Insights
    1. 11.1. Key Insights from Primary Interviews & Surveys Respondents
    2. 11.2. Key Takeaways from Analysts, Consultants, and Industry Leaders
  12. Chapter 12 Research Approach & Methodology
    1. 12.1. Report Description
    2. 12.2. Research Scope
    3. 12.3. Research Methodology
      1. 12.3.1. Secondary Research
      2. 12.3.2. Primary Research
      3. 12.3.3. Statistical Models
        1. 12.3.3.1. Company Share Analysis Model
        2. 12.3.3.2. Revenue Based Modeling
      4. 12.3.4. Research Limitations

      List of Figures

      Fig.1	Product Picture of Fungicides
      Fig.2	Global Fungicides Market, 2016 – 2026 (USD Billion)
      Fig.3	Global Fungicides Market Absolute Revenue Opportunity, 2016 – 2026 (USD Billion)
      Fig.4	Global Fungicides Market Incremental Revenue Opportunity, 2020 – 2026 (USD Billion)
      Fig.5	Global Fungicides Market Share, by Type, 2019 & 2026 (USD Billion)
      Fig.6	Global Chemical  Fungicides Market, 2016 – 2026 (USD Billion)
      Fig.7	Global Biological Fungicides Market, 2016 – 2026 (USD Billion)
      Fig.8	Global Fungicides Market Share, by Crop Type, 2019 & 2026 (USD Billion)
      Fig.9	Global Cereals Fungicides Market, 2016 – 2026 (USD Billion)
      Fig.10	Global Oilseeds & Pulses Fungicides Market, 2016 – 2026 (USD Billion)
      Fig.11	Global Fruits & vegetables  Fungicides Market, 2016 – 2026 (USD Billion)
      Fig.12	Global Others Fungicides Market, 2016 – 2026 (USD Billion)
      Fig.13	Global Fungicides Market Share, by Application, 2019 & 2026 (USD Billion)
      Fig.14	Global Foliar Treatment Fungicides Market, 2016 – 2026 (USD Billion)
      Fig.15	Global Chemigation  Fungicides Market, 2016 – 2026 (USD Billion)
      Fig.16	Global Seed Treatment  Fungicides Market, 2016 – 2026 (USD Billion)
      Fig.17	Global Others Fungicides Market, 2016 – 2026 (USD Billion)
      Fig.18	Global Fungicides Market Share, by Region, 2019 & 2026 (USD Billion)
      Fig.19	North America Fungicides Market, 2016 – 2026 (USD Billion)
      Fig.20	U.S. Fungicides Market, 2016 – 2026 (USD Billion)
      Fig.21	Canada Fungicides Market, 2016 – 2026 (USD Billion)
      Fig.22	Europe Fungicides Market, 2016 – 2026 (USD Billion)
      Fig.23	Germany Fungicides Market, 2016 – 2026 (USD Billion)
      Fig.24	France Fungicides Market, 2016 – 2026 (USD Billion)
      Fig.25	U.K. Fungicides Market, 2016 – 2026 (USD Billion)
      Fig.26	Italy Fungicides Market, 2016 – 2026 (USD Billion)
      Fig.27	Spain Fungicides Market, 2016 – 2026 (USD Billion)
      Fig.28	Rest of Europe Fungicides Market, 2016 – 2026 (USD Billion)
      Fig.29	Asia Pacific Fungicides Market, 2016 – 2026 (USD Billion)
      Fig.30	China Fungicides Market, 2016 – 2026 (USD Billion)
      Fig.31	Japan Fungicides Market, 2016 – 2026 (USD Billion)
      Fig.32	India Fungicides Market, 2016 – 2026 (USD Billion)
      Fig.33	South  Korea Fungicides Market, 2016 – 2026 (USD Billion)
      Fig.34	South-East Asia Fungicides Market, 2016 – 2026 (USD Billion)
      Fig.35	Rest of Asia Pacific Fungicides Market, 2016 – 2026 (USD Billion)
      Fig.36	Latin America Fungicides Market, 2016 – 2026 (USD Billion)
      Fig.37	Brazil Fungicides Market, 2016 – 2026 (USD Billion)
      Fig.38	Mexico Fungicides Market, 2016 – 2026 (USD Billion)
      Fig.39	Rest of Latin America Fungicides Market, 2016 – 2026 (USD Billion)
      Fig.40	The Middle-East and Africa Fungicides Market, 2016 – 2026 (USD Billion)
      Fig.41	GCC Countries Fungicides Market, 2016 – 2026 (USD Billion)
      Fig.42	South Africa Fungicides Market, 2016 – 2026 (USD Billion)
      Fig.43	Rest of Middle-East Africa Fungicides Market, 2016 – 2026 (USD Billion)
      Fig.44	Competitor Market Share – Revenue
      Fig.45	BAS SE Revenue and Growth Rate
      Fig.46	BAS SE Market Share
      Fig.47	Bayer AG Revenue and Growth Rate
      Fig.48	Bayer AG Market Share
      Fig.49	Corteva Inc Revenue and Growth Rate
      Fig.50	Corteva Inc Market Share
      Fig.51	Syngenta AG Revenue and Growth Rate
      Fig.52	Syngenta AG Market Share
      Fig.53	FMCCorporation Revenue and Growth Rate
      Fig.54	FMCCorporation Market Share
      Fig.55	UPL Ltd Revenue and Growth Rate
      Fig.56	UPL Ltd Market Share
      Fig.57	ADAMA Ltd Revenue and Growth Rate
      Fig.58	ADAMA Ltd Market Share
      Fig.59	SumitomChemical Co. Ltd Revenue and Growth Rate
      Fig.60	SumitomChemical Co. Ltd Market Share
      Fig.61	Nufarm Revenue and Growth Rate
      Fig.62	Nufarm Market Share
      Fig.63	Isagro SpA Revenue and Growth Rate
      Fig.64	Isagro SpA Market Share
      Fig.65	CropScience Revenue and Growth Rate
      Fig.66	CropScience Market Share
      Fig.67	Dow AgroSciences Revenue and Growth Rate
      Fig.68	Dow AgroSciences Market Share
      Fig.69	Lanxess AG Revenue and Growth Rate
      Fig.70	Lanxess AG Market Share
      Fig.71	Monsanto Revenue and Growth Rate
      Fig.72	Monsanto Market Share
      Fig.73	Adama Agricultural Solutions Revenue and Growth Rate
      Fig.74	Adama Agricultural Solutions Market Share
      Fig.75	Simonis B.V Revenue and Growth Rate
      Fig.76	Simonis B.V Market Share
      Fig.77	Drexel Chemical Company Revenue and Growth Rate
      Fig.78	Drexel Chemical Company Market Share
      Fig.79	Biostadt India Limited Revenue and Growth Rate
      Fig.80	Biostadt India Limited Market Share
      Fig.81	Heranba Industries Ltd Revenue and Growth Rate
      Fig.82	Heranba Industries Ltd Market Share
      Fig.83	Market Dynamics
      Fig.84	Global Fungicides – Value Chain Analysis
      Fig.85	Key Mandates and Regulations
      Fig.86	Technology Roadmap and Timeline
      Fig.87	Market Attractiveness Analysis – By Type
      Fig.88	Market Attractiveness Analysis – By Crop Type
      Fig.89	Market Attractiveness Analysis – By Application
      Fig.90	Market Attractiveness Analysis – By Region
      Fig.91	Fungicides Industrial Chain Analysis
      Fig.92	Market Channels
      Fig.93	Marketing Channel Development Trend
      Fig.94	Growth in World Gross Product, 2008-2018
      

      List of Tables

      Table 1	Global Fungicides Market, 2019 & 2026 (USD Billion)
      Table 2	Global Fungicides Market, by Type, 2016 – 2026 (USD Billion)
      Table 3	Global Fungicides Market, by Crop Type, 2016 – 2026 (USD Billion)
      Table 4	Global Fungicides Market, by Application, 2016 – 2026 (USD Billion)
      Table 5	Global Fungicides Market, by Region, 2016 – 2026 (USD Billion)
      Table 6	North America Fungicides Market, by Country, 2016 – 2026 (USD Billion)
      Table 7	North America Fungicides Market, by Type, 2016 – 2026 (USD Billion)
      Table 8	North America Fungicides Market, by Crop Type, 2016 – 2026 (USD Billion)
      Table 9	North America Fungicides Market, by Application, 2016 – 2026 (USD Billion)
      Table 10 Europe Fungicides Market, by Country, 2016 – 2026 (USD Billion)
      Table 11 Europe Fungicides Market, by Type, 2016 – 2026 (USD Billion)
      Table 12 Europe Fungicides Market, by Crop Type, 2016 – 2026 (USD Billion)
      Table 13 Europe Fungicides Market, by Application, 2016 – 2026 (USD Billion)
      Table 14 Asia Pacific Fungicides Market, by Country, 2016 – 2026 (USD Billion)
      Table 15 Asia Pacific Fungicides Market, by Type, 2016 – 2026 (USD Billion)
      Table 16 Asia Pacific Fungicides Market, by Crop Type, 2016 – 2026 (USD Billion)
      Table 17 Asia Pacific Fungicides Market, by Application, 2016 – 2026 (USD Billion)
      Table 18 Latin America Fungicides Market, by Country, 2016 – 2026 (USD Billion)
      Table 19 Latin America Fungicides Market, by Type, 2016 – 2026 (USD Billion)
      Table 20 Latin America Fungicides Market, by Crop Type, 2016 – 2026 (USD Billion)
      Table 21 Latin America Fungicides Market, by Application, 2016 – 2026 (USD Billion)
      Table 22 The Middle-East and Africa Fungicides Market, by Country, 2016 – 2026 (USD Billion)
      Table 23 The Middle-East and Africa Fungicides Market, by Type, 2016 – 2026 (USD Billion)
      Table 24 The Middle-East and Africa Fungicides Market, by Crop Type, 2016 – 2026 (USD Billion)
      Table 25 The Middle-East and Africa Fungicides Market, by Application, 2016 – 2026 (USD Billion)
      Table 26 Global Fungicides Market - Company Revenue Analysis, 2016 – 2019 (USD Billion)
      Table 27 Global Fungicides Market - Company Revenue Share Analysis, 2016 – 2019 (%)
      Table 28 Acquisitions and Mergers
      Table 29 Market Drivers – Impact Analysis
      Table 30 Market Restraints
      Table 31 Market Opportunities
      Table 32 Major Buyers of Fungicides
      Table 33 Distributors/Traders of Fungicides by Region
      

Industry Major Market Players

  • BAS SE
  • Bayer AG
  • Corteva Inc.
  • Syngenta AG
  • FMCCorporation
  • UPL Ltd.
  • ADAMA Ltd.
  • SumitomChemical Co. Ltd
  • Nufarm
  • Isagro SpA
  • CropScience
  • Dow AgroSciences
  • Lanxess AG
  • Monsanto
  • Adama Agricultural Solutions
  • Simonis B.V.
  • Drexel Chemical Company
  • Biostadt India Limited
  • Heranba Industries Ltd