Search Market Research Report

Discover Our Latest Reports
Discover Our Featured Reports
Discover Top Selling Reports

Fuel Ethanol Market Size, Share Global Analysis Report, 2020–2026

report img

Fuel Ethanol Market By Type (Starch-Based, Sugar-Based, and Cellulosic), and By Application (Conventional Fuel Vehicles, Flexible Fuel Vehicles, and Others): Global Industry Outlook, Market Size, Business Intelligence, Consumer Preferences, Statistical Surveys, Comprehensive Analysis, Historical Developments, Current Trends, and Forecast 2020–2026

Industry Insights

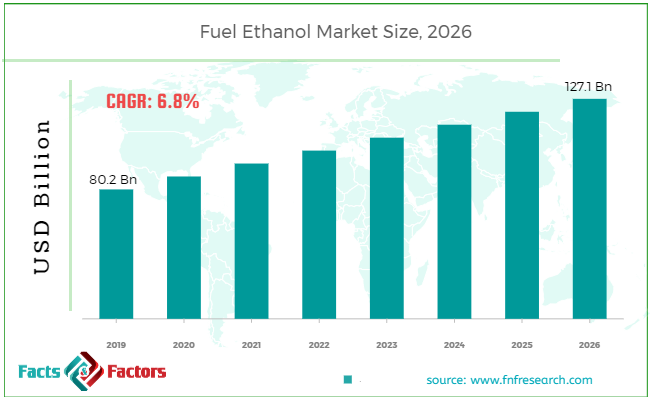
[195+ Pages Report] According to the report published by Facts Factors, the global fuel ethanol market size was worth around USD 80.2 billion in 2019 and is predicted to grow to around USD 127.1 billion by 2026 with a compound annual growth rate (CAGR) of roughly 6.8% between 2020 and 2026. The report analyzes the global fuel ethanol market drivers, restraints/challenges, and the effect they have on the demands during the projection period. In addition, the report explores emerging opportunities in the fuel ethanol market.

Fuel Ethanol Market Size

To know more about this report | Request Free Sample Copy

This specialized and expertise oriented industry research report scrutinizes the technical and commercial business outlook of the fuel ethanol industry. The report analyzes and declares the historical and current trends analysis of the fuel ethanol industry and subsequently recommends the projected trends anticipated to be observed in the fuel ethanol market during the upcoming years.

The fuel ethanol market report analyzes and notifies the industry statistics at the global as well as regional and country levels in order to acquire a thorough perspective of the entire fuel ethanol market. The historical and past insights are provided for FY 2016 to FY 2019 whereas projected trends are delivered for FY 2020 to FY 2026. The quantitative and numerical data is represented in terms of both volume (Kilo Tons) and value (USD Million) from FY 2016 – 2026.


logoKey Insights from Primary Research

  • As per our primary respondents, the fuel ethanol market is set to grow annually at a rate of around 6.8%
  • It was established through primary research that the fuel ethanol market was valued at around USD 80.2 billion in 2019
  • North America held the largest market share of fuel ethanol in terms of revenue in 2019
  • The “Starch-Based” category, on the basis of type segmentation, was the leading revenue-generating category in 2019
  • The “Conventional Fuel Vehicles” category, on the basis of application segmentation, was the leading revenue-generating category in 2019

logoKey Recommendations from Analysts

  • As per our analysts, the rising requirements for minimizing carbon emissions from gasoline in the automotive & transportation industry is likely to boost the usage of ethanol as a bio-based additive over the next couple of years
  • Cellulosic or cellulose-based ethyl alcohol is anticipated to offer significant growth prospects in the market during the forecast period
  • Rapid production of FFVs in Brazil, the U.S., and countries in the European Union is considered to boost the usage of fuel ethanol in the next couple of years
  • The rising requirements of boosting fuel economy of conventional vehicles in countries including the U.S., China, India, and Brazil is expected to boost product consumption in the future
  • Corn-based ethyl alcohol has resulted in minimizing airborne emissions by nearly 20%, as stated by the U.S.

The quantitative data is further underlined and reinforced by comprehensive qualitative data which comprises various across-the-board market dynamics. The rationales which directly or indirectly impact the fuel ethanol industry are exemplified through parameters such as growth drivers, restraints, challenges, and opportunities among other impacting factors.

Throughout our research report, we have encompassed all the proven models and tools of industry analysis and extensively illustrated all the key business strategies and business models adopted in the fuel ethanol industry. The report provides an all-inclusive and detailed competitive landscape prevalent in the fuel ethanol market.

The report utilizes established industry analysis tools and models such as Porter’s Five Forces framework to analyze and recognize critical business strategies adopted by various stakeholders involved in the entire value chain of the fuel ethanol industry. The fuel ethanol market report additionally employs SWOT analysis and PESTLE analysis models for further in-depth analysis.

The report study further includes an in-depth analysis of industry players' market shares and provides an overview of leading players' market position in the fuel ethanol sector. Key strategic developments in the fuel ethanol market competitive landscape such as acquisitions & mergers, inaugurations of different products and services, partnerships & joint ventures, MoU agreements, VC & funding activities, R&D activities, and geographic expansion among other noteworthy activities by key players of the fuel ethanol market are appropriately highlighted in the report.

Conventional vehicles can utilize gasoline with low ethanol blends such as E10 and E15. E10 is a blend of 10% ethanol and 90% gasoline, while E15 comprises 10.5 to 15% ethanol respectively. The rising requirements of boosting fuel economy of conventional vehicles in countries including the U.S., China, India, and Brazil are expected to boost product consumption in the future.

The Flexible Fuel Vehicles (FFVs) segment is projected to illustrate the fastest industry growth during the forecast period. These vehicles consist of internal combustion engines that are capable of operating on both gasoline and ethanol-gasoline blends ranging beyond E10 such as E85, also known as flex-fuel. E85 comprises 51% to 83% ethanol blended with gasoline.

The fuel ethanol market research report delivers an acute valuation and taxonomy of the fuel ethanol industry by practically splitting the market on the basis of different types, applications, and regions. Through the analysis of the historical and projected trends, all the segments and sub-segments were evaluated through the bottom-up approach, and different market sizes have been projected for FY 2020 to FY 2026.

The regional segmentation of the fuel ethanol industry includes the complete classification of all the major continents including North America, Latin America, Europe, Asia Pacific, and Middle East & Africa. Further, country-wise data for the fuel ethanol industry is provided for the leading economies of the world.

The fuel ethanol market is segmented based on type and application. On the basis of type segmentation, the market is classified into starch-based, sugar-based, and cellulosic. In terms of application segmentation, the market is bifurcated into conventional fuel vehicles, flexible fuel vehicles, and others.

logoReport Scope

Report Attribute

Details

Market Size in 2019

USD 80.2 billion

Projected Market Size in 2026

USD 127.1 billion

CAGR Growth Rate

6.8% CAGR

Base Year

2019

Forecast Years

2020-2026

Key Market Players

BlueFire Renewables, Inc., Cargill, Inc., Flint Hills Resources LP, Valero Energy Corporation, Green Plains Renewable, Inc., Wilmar International Ltd., Archer Daniels Midland Company, BP plc, E.I. du Pont de Nemours and Company, Pacific Ethanol, Inc., Raízen S.A., Jilin Fuel Ethanol Co., Ltd., and Others.

Key Segment

By Type, By Application, By Region

Major Regions Covered

North America, Europe, Asia Pacific, Latin America, and the Middle East & Africa

Purchase Options

Request customized purchase options to meet your research needs. Explore purchase options

logoSome of the leading players in the global market include

  • BlueFire Renewables Inc.
  • Cargill Inc.
  • Flint Hills Resources LP
  • Valero Energy Corporation
  • Green Plains Renewable Inc.
  • Wilmar International Ltd.
  • Archer Daniels Midland Company
  • BP plc
  • E.I. du Pont de Nemours and Company
  • Pacific Ethanol Inc.
  • Raízen S.A.
  • Jilin Fuel Ethanol Co. Ltd.

The taxonomy of the fuel ethanol market by its scope and segmentation is as follows:

logoBy Type Segmentation Analysis

  • Starch-Based
  • Sugar-Based
  • Cellulosic

logoBy Application Segmentation Analysis

  • Conventional Fuel Vehicles
  • Flexible Fuel Vehicles
  • Others

logoBy Regional Segmentation Analysis

  • North America
    • The U.S.
    • Canada
  • Europe
    • Germany
    • The UK
    • France
    • Spain
    • Italy
    • Rest of Europe
  • Asia Pacific
    • China
    • Japan
    • India
    • South Korea
    • Southeast Asia
    • Rest of Asia Pacific
  • Latin America
    • Brazil
    • Mexico
    • Rest of Latin America
  • Middle East & Africa
    • GCC
    • South Africa
    • Rest of Middle East & Africa

Table of Content

  1. CHAPTER 1. Executive Summary
  2. CHAPTER 2. Fuel Ethanol market – Type Analysis
    1. 2.1. Global Fuel Ethanol Market – Type Overview
    2. 2.2. Global Fuel Ethanol Market Share, by Type, 2019 & 2026 (USD Million)
    3. 2.3. Global Fuel Ethanol Market share, by Type, 2019 & 2026 (Kilo Tons)
    4. 2.4. Starch-Based
      1. 2.4.1. Global Starch-Based Fuel Ethanol Market, 2016-2026 (USD Million)
      2. 2.4.2. Global Starch-Based Fuel Ethanol Market, 2016-2026 (Kilo Tons)
    5. 2.5. Sugar-Based
      1. 2.5.1. Global Sugar-Based Fuel Ethanol Market, 2016-2026 (USD Million)
      2. 2.5.2. Global Sugar-Based Fuel Ethanol Market, 2016-2026 (Kilo Tons)
    6. 2.6. Cellulosic
      1. 2.6.1. Global Cellulosic Fuel Ethanol Market, 2016-2026 (USD Million)
      2. 2.6.2. Global Cellulosic Fuel Ethanol Market, 2016-2026 (Kilo Tons)
  3. CHAPTER 3. Fuel Ethanol market – Application Analysis
    1. 3.1. Global Fuel Ethanol Market – Application Overview
    2. 3.2. Global Fuel Ethanol Market Share, by Application, 2019 & 2026 (USD Million)
    3. 3.3. Global Fuel Ethanol Market share, by Application, 2019 & 2026 (Kilo Tons)
    4. 3.4. Conventional Fuel Vehicles
      1. 3.4.1. Global Conventional Fuel Vehicles Fuel Ethanol Market, 2016-2026 (USD Million)
      2. 3.4.2. Global Conventional Fuel Vehicles Fuel Ethanol Market, 2016-2026 (Kilo Tons)
    5. 3.5. Flexible Fuel Vehicles
      1. 3.5.1. Global Flexible Fuel Vehicles Fuel Ethanol Market, 2016-2026 (USD Million)
      2. 3.5.2. Global Flexible Fuel Vehicles Fuel Ethanol Market, 2016-2026 (Kilo Tons)
    6. 3.6. Others
      1. 3.6.1. Global Others Fuel Ethanol Market, 2016-2026 (USD Million)
      2. 3.6.2. Global Others Fuel Ethanol Market, 2016-2026 (Kilo Tons)
  4. CHAPTER 4. Fuel Ethanol market – Regional Analysis
    1. 4.1. Global Fuel Ethanol Market Regional Overview
    2. 4.2. Global Fuel Ethanol Market Share, by Region, 2019 & 2026 (Value)
    3. 4.3. Global Fuel Ethanol Market Share, by Region, 2019 & 2026 (Volume)
    4. 4.4. North America
      1. 4.4.1. North America Fuel Ethanol Market size and forecast, 2016-2026
      2. 4.4.2. North America Fuel Ethanol Market, by Country, 2019 - 2026 (USD Million)
      3. 4.4.3. North America Market size and forecast, 2016-2026 (Kilo Tons)
      4. 4.4.4. North America Fuel Ethanol Market, by Country, 2019 - 2026 (Kilo Tons)
      5. 4.4.5. North America Fuel Ethanol Market, by Type, 2016-2026
        1. 4.4.5.1. North America Fuel Ethanol Market, by Type, 2016-2026 (USD Million)
        2. 4.4.5.2. North America Fuel Ethanol Market, by Type, 2016-2026 (Kilo Tons)
      6. 4.4.6. North America Fuel Ethanol Market, by Application, 2016-2026
        1. 4.4.6.1. North America Fuel Ethanol Market, by Application, 2016-2026 (USD Million)
        2. 4.4.6.2. North America Fuel Ethanol Market, by Application, 2016-2026 (Kilo Tons)
      7. 4.4.7. U.S.
        1. 4.4.7.1. U.S. Market size and forecast, 2016-2026 (USD Million)
        2. 4.4.7.2. U.S. Market size and forecast, 2016-2026 (Kilo Tons)
      8. 4.4.8. Canada
        1. 4.4.8.1. Canada Market size and forecast, 2016-2026 (USD Million)
        2. 4.4.8.2. Canada Market size and forecast, 2016-2026 (Kilo Tons)
    5. 4.5. Europe
      1. 4.5.1. Europe Fuel Ethanol Market size and forecast, 2016-2026
      2. 4.5.2. Europe Fuel Ethanol Market, by Country, 2019 - 2026 (USD Million)
      3. 4.5.3. Europe Market size and forecast, 2016-2026 (Kilo Tons)
      4. 4.5.4. Europe Fuel Ethanol Market, by Country, 2019 - 2026 (Kilo Tons)
      5. 4.5.5. Europe Fuel Ethanol Market, by Type, 2016-2026
        1. 4.5.5.1. Europe Fuel Ethanol Market, by Type, 2016-2026 (USD Million)
        2. 4.5.5.2. Europe Fuel Ethanol Market, by Type, 2016-2026 (Kilo Tons)
      6. 4.5.6. Europe Fuel Ethanol Market, by Application, 2016-2026
        1. 4.5.6.1. Europe Fuel Ethanol Market, by Application, 2016-2026 (USD Million)
        2. 4.5.6.2. Europe Fuel Ethanol Market, by Application, 2016-2026 (Kilo Tons)
      7. 4.5.7. Germany
        1. 4.5.7.1. Germany Market size and forecast, 2016-2026 (USD Million)
        2. 4.5.7.2. Germany Market size and forecast, 2016-2026 (Kilo Tons)
      8. 4.5.8. France
        1. 4.5.8.1. France Market size and forecast, 2016-2026 (USD Million)
        2. 4.5.8.2. France Market size and forecast, 2016-2026 (Kilo Tons)
      9. 4.5.9. U.K.
        1. 4.5.9.1. U.K. Market size and forecast, 2016-2026 (USD Million)
        2. 4.5.9.2. U.K. Market size and forecast, 2016-2026 (Kilo Tons)
      10. 4.5.10. Italy
        1. 4.5.10.1. Italy Market size and forecast, 2016-2026 (USD Million)
        2. 4.5.10.2. Italy Market size and forecast, 2016-2026 (Kilo Tons)
      11. 4.5.11. Spain
        1. 4.5.11.1. Spain Market size and forecast, 2016-2026 (USD Million)
        2. 4.5.11.2. Spain Market size and forecast, 2016-2026 (Kilo Tons)
      12. 4.5.12. Rest of Europe
        1. 4.5.12.1. Rest of Europe Market size and forecast, 2016-2026 (USD Million)
        2. 4.5.12.2. Rest of Europe Market size and forecast, 2016-2026 (Kilo Tons)
    6. 4.6. Asia Pacific
      1. 4.6.1. Asia Pacific Fuel Ethanol Market size and forecast, 2016-2026
      2. 4.6.2. Asia Pacific Fuel Ethanol Market, by Country, 2019 - 2026 (USD Million)
      3. 4.6.3. Asia Pacific Market size and forecast, 2016-2026 (Kilo Tons)
      4. 4.6.4. Asia Pacific Fuel Ethanol Market, by Country, 2019 - 2026 (Kilo Tons)
      5. 4.6.5. Asia Pacific Fuel Ethanol Market, by Type, 2016-2026
        1. 4.6.5.1. Asia Pacific Fuel Ethanol Market, by Type, 2016-2026 (USD Million)
        2. 4.6.5.2. Asia Pacific Fuel Ethanol Market, by Type, 2016-2026 (Kilo Tons)
      6. 4.6.6. Asia Pacific Fuel Ethanol Market, by Application, 2016-2026
        1. 4.6.6.1. Asia Pacific Fuel Ethanol Market, by Application, 2016-2026 (USD Million)
        2. 4.6.6.2. Asia Pacific Fuel Ethanol Market, by Application, 2016-2026 (Kilo Tons)
      7. 4.6.7. China
        1. 4.6.7.1. China Market size and forecast, 2016-2026 (USD Million)
        2. 4.6.7.2. China Market size and forecast, 2016-2026 (Kilo Tons)
      8. 4.6.8. Japan
        1. 4.6.8.1. Japan Market size and forecast, 2016-2026 (USD Million)
        2. 4.6.8.2. Japan Market size and forecast, 2016-2026 (Kilo Tons)
      9. 4.6.9. India
        1. 4.6.9.1. India Market size and forecast, 2016-2026 (USD Million)
        2. 4.6.9.2. India Market size and forecast, 2016-2026 (Kilo Tons)
      10. 4.6.10. South Korea
        1. 4.6.10.1. South Korea Market size and forecast, 2016-2026 (USD Million)
        2. 4.6.10.2. South Korea Market size and forecast, 2016-2026 (Kilo Tons)
      11. 4.6.11. South-East Asia
        1. 4.6.11.1. South-East Asia Market size and forecast, 2016-2026 (USD Million)
        2. 4.6.11.2. South-East Asia Market size and forecast, 2016-2026 (Kilo Tons)
      12. 4.6.12. Rest of Asia Pacific
        1. 4.6.12.1. Rest of Asia Pacific Market size and forecast, 2016-2026 (USD Million)
        2. 4.6.12.2. Rest of Asia Pacific Market size and forecast, 2016-2026 (Kilo Tons)
    7. 4.7. Latin America
      1. 4.7.1. Latin America Fuel Ethanol Market size and forecast, 2016-2026
      2. 4.7.2. Latin America Fuel Ethanol Market, by Country, 2019 - 2026 (USD Million)
      3. 4.7.3. Latin America Market size and forecast, 2016-2026 (Kilo Tons)
      4. 4.7.4. Latin America Fuel Ethanol Market, by Country, 2019 - 2026 (Kilo Tons)
      5. 4.7.5. Latin America Fuel Ethanol Market, by Type, 2016-2026
        1. 4.7.5.1. Latin America Fuel Ethanol Market, by Type, 2016-2026 (USD Million)
        2. 4.7.5.2. Latin America Fuel Ethanol Market, by Type, 2016-2026 (Kilo Tons)
      6. 4.7.6. Latin America Fuel Ethanol Market, by Application, 2016-2026
        1. 4.7.6.1. Latin America Fuel Ethanol Market, by Application, 2016-2026 (USD Million)
        2. 4.7.6.2. Latin America Fuel Ethanol Market, by Application, 2016-2026 (Kilo Tons)
      7. 4.7.7. Brazil
        1. 4.7.7.1. Brazil Market size and forecast, 2016-2026 (USD Million)
        2. 4.7.7.2. Brazil Market size and forecast, 2016-2026 (Kilo Tons)
      8. 4.7.8. Mexico
        1. 4.7.8.1. Mexico Market size and forecast, 2016-2026 (USD Million)
        2. 4.7.8.2. Mexico Market size and forecast, 2016-2026 (Kilo Tons)
      9. 4.7.9. Rest of Latin America
        1. 4.7.9.1. Rest of Latin America Market size and forecast, 2016-2026 (USD Million)
        2. 4.7.9.2. Rest of Latin America Market size and forecast, 2016-2026 (Kilo Tons)
    8. 4.8. The Middle-East and Africa
      1. 4.8.1. The Middle-East and Africa Fuel Ethanol Market size and forecast, 2016-2026
      2. 4.8.2. The Middle-East and Africa Fuel Ethanol Market, by Country, 2019 - 2026 (USD Million)
      3. 4.8.3. The Middle-East and Africa Market size and forecast, 2016-2026 (Kilo Tons)
      4. 4.8.4. The Middle-East and Africa Fuel Ethanol Market, by Country, 2019 - 2026 (Kilo Tons)
      5. 4.8.5. The Middle-East and Africa Fuel Ethanol Market, by Type, 2016-2026
        1. 4.8.5.1. The Middle-East and Africa Fuel Ethanol Market, by Type, 2016-2026 (USD Million)
        2. 4.8.5.2. The Middle-East and Africa Fuel Ethanol Market, by Type, 2016-2026 (Kilo Tons)
      6. 4.8.6. The Middle-East and Africa Fuel Ethanol Market, by Application, 2016-2026
        1. 4.8.6.1. The Middle-East and Africa Fuel Ethanol Market, by Application, 2016-2026 (USD Million)
        2. 4.8.6.2. The Middle-East and Africa Fuel Ethanol Market, by Application, 2016-2026 (Kilo Tons)
      7. 4.8.7. GCC Countries
        1. 4.8.7.1. GCC Countries Market size and forecast, 2016-2026 (USD Million)
        2. 4.8.7.2. GCC Countries Market size and forecast, 2016-2026 (Kilo Tons)
      8. 4.8.8. South Africa
        1. 4.8.8.1. South Africa Market size and forecast, 2016-2026 (USD Million)
        2. 4.8.8.2. South Africa Market size and forecast, 2016-2026 (Kilo Tons)
      9. 4.8.9. Rest of Middle-East Africa
        1. 4.8.9.1. Rest of Middle-East Africa Market size and forecast, 2016-2026 (USD Million)
        2. 4.8.9.2. Rest of Middle-East Africa Market size and forecast, 2016-2026 (Kilo Tons)
  5. CHAPTER 5. Fuel Ethanol Production, Consumption, Export, Import by Regions
    1. 5.1. Global Fuel Ethanol production and revenue, 2016-2026 (USD Million) (Kilo Tons)
    2. 5.2. Global Import and Export Analysis, by Region
  6. CHAPTER 6. Fuel Ethanol market – Competitive Landscape
    1. 6.1. Competitor Market Share – Revenue
    2. 6.2. Market Concentration Rate Analysis, Top 3 and Top 5 Players
    3. 6.3. Competitor Market Share – Volume
    4. 6.4. Strategic Development
      1. 6.4.1. Acquisitions and Mergers
      2. 6.4.2. New Products
      3. 6.4.3. Research & Development Activities
  7. CHAPTER 7. Company Profiles
    1. 7.1. BlueFire Renewables, Inc.
      1. 7.1.1. Company Overview
      2. 7.1.2. BlueFire Renewables, Inc. Sales, Revenue, Price, and Gross Margin
      3. 7.1.3. Product portfolio
      4. 7.1.4. Recent initiatives
    2. 7.2. Cargill, Inc.
      1. 7.2.1. Company Overview
      2. 7.2.2. Cargill, Inc. Sales, Revenue, Price, and Gross Margin
      3. 7.2.3. Product portfolio
      4. 7.2.4. Recent initiatives
    3. 7.3. Flint Hills Resources LP
      1. 7.3.1. Company Overview
      2. 7.3.2. Flint Hills Resources LP Sales, Revenue, Price, and Gross Margin
      3. 7.3.3. Product portfolio
      4. 7.3.4. Recent initiatives
    4. 7.4. Jilin Fuel Ethanol Co., Ltd.
      1. 7.4.1. Company Overview
      2. 7.4.2. Jilin Fuel Ethanol Co., Ltd. Sales, Revenue, Price, and Gross Margin
      3. 7.4.3. Product portfolio
      4. 7.4.4. Recent initiatives
    5. 7.5. Valero Energy Corporation
      1. 7.5.1. Company Overview
      2. 7.5.2. Valero Energy Corporation Sales, Revenue, Price, and Gross Margin
      3. 7.5.3. Product portfolio
      4. 7.5.4. Recent initiatives
    6. 7.6. Wilmar International Ltd.
      1. 7.6.1. Company Overview
      2. 7.6.2. Wilmar International Ltd. Sales, Revenue, Price, and Gross Margin
      3. 7.6.3. Product portfolio
      4. 7.6.4. Recent initiatives
    7. 7.7. Archer Daniels Midland Company
      1. 7.7.1. Company Overview
      2. 7.7.2. Archer Daniels Midland Company Sales, Revenue, Price, and Gross Margin
      3. 7.7.3. Product portfolio
      4. 7.7.4. Recent initiatives
    8. 7.8. BP plc
      1. 7.8.1. Company Overview
      2. 7.8.2. BP plc Sales, Revenue, Price, and Gross Margin
      3. 7.8.3. Product portfolio
      4. 7.8.4. Recent initiatives
    9. 7.9. E.I. du Pont de Nemours and Company
      1. 7.9.1. Company Overview
      2. 7.9.2. E.I. du Pont de Nemours and Company Sales, Revenue, Price, and Gross Margin
      3. 7.9.3. Product portfolio
      4. 7.9.4. Recent initiatives
    10. 7.10. Green Plains Renewable, Inc.
      1. 7.10.1. Company Overview
      2. 7.10.2. Green Plains Renewable, Inc. Sales, Revenue, Price, and Gross Margin
      3. 7.10.3. Product portfolio
      4. 7.10.4. Recent initiatives
    11. 7.11. Pacific Ethanol, Inc.
      1. 7.11.1. Company Overview
      2. 7.11.2. Pacific Ethanol, Inc. Sales, Revenue, Price, and Gross Margin
      3. 7.11.3. Product portfolio
      4. 7.11.4. Recent initiatives
    12. 7.12. Raízen S.A.
      1. 7.12.1. Company Overview
      2. 7.12.2. Raízen S.A. Sales, Revenue, Price, and Gross Margin
      3. 7.12.3. Product portfolio
      4. 7.12.4. Recent initiatives
  8. CHAPTER 8. Fuel Ethanol — Industry Analysis
    1. 8.1. Introduction and Taxonomy
    2. 8.2. Fuel Ethanol Market – Key Trends
      1. 8.2.1. Market Drivers
      2. 8.2.2. Market Restraints
      3. 8.2.3. Market Opportunities
    3. 8.3. Value Chain Analysis
    4. 8.4. Key Mandates and Regulations
    5. 8.5. Technology Roadmap and Timeline
    6. 8.6. Fuel Ethanol market – Attractiveness Analysis
      1. 8.6.1. By Type
      2. 8.6.2. By Application
      3. 8.6.3. By Region
  9. CHAPTER 9. Raw Material analysis
    1. 9.1. Fuel Ethanol Key Raw Material Analysis
      1. 9.1.1. Key Raw Materials
      2. 9.1.2. Price Trend of Key Raw Materials
    2. 9.2. Key Suppliers of Raw Materials
    3. 9.3. Proportion of Manufacturing Cost Structure
      1. 9.3.1. Raw Materials
      2. 9.3.2. Labor Cost
    4. 9.4. Manufacturing Expenses Analysis of Fuel Ethanol
  10. CHAPTER 10. Industrial Chain, Sourcing Strategy and Downstream Buyers
    1. 10.1. Fuel Ethanol Industrial Chain Analysis
    2. 10.2. Upstream Raw Materials Sourcing
      1. 10.2.1. Risk Mitigation:
      2. 10.2.2. Supplier Relationships:
      3. 10.2.3. Business Processes:
      4. 10.2.4. Securing the Product:
    3. 10.3. Raw Materials Sources of Fuel Ethanol Major Manufacturers in 2016
    4. 10.4. Downstream Buyers
    5. 10.5. Distributors/Traders List
  11. CHAPTER 11. Marketing Strategy Analysis, Distributors
    1. 11.1. Marketing Channel
    2. 11.2. Direct Marketing
    3. 11.3. Indirect Marketing
    4. 11.4. Marketing Channel Development Trend
    5. 11.5. Economic/Political Environmental Change
  12. CHAPTER 12. Report Conclusion
  13. CHAPTER 13. Research Approach & Methodology
    1. 13.1. Report Description
    2. 13.2. Research Scope
    3. 13.3. Research Methodology
      1. 13.3.1. Secondary Research
      2. 13.3.2. Primary Research
      3. 13.3.3. Models
        1. 13.3.3.1. Company Share Analysis Model
        2. 13.3.3.2. Revenue Based Modeling
        3. 13.3.3.3. Research Limitations

  • List of Figures

    FIG. 1 Global Fuel Ethanol Market, 2016-2026 (USD Million)
    FIG. 2 Global Fuel Ethanol Market Share, by Type, 2019 & 2026 (USD Million)
    FIG. 3 Global Fuel Ethanol Market share, by Type, 2019 & 2026 (Kilo Tons)
    FIG. 4 Global Starch-Based Fuel Ethanol Market, 2016-2026 (USD Million)
    FIG. 5 Global Starch-Based Fuel Ethanol  Market, 2016-2026 (Kilo Tons)
    FIG. 6 Global Sugar-Based Fuel Ethanol Market, 2016-2026 (USD Million)
    FIG. 7 Global Sugar-Based Fuel Ethanol  Market, 2016-2026 (Kilo Tons)
    FIG. 8 Global Cellulosic Fuel Ethanol Market, 2016-2026 (USD Million)
    FIG. 9 Global Cellulosic Fuel Ethanol  Market, 2016-2026 (Kilo Tons)
    FIG. 10 Global Fuel Ethanol Market Share, by Application, 2019 & 2026 (USD Million)
    FIG. 11 Global Fuel Ethanol Market share, by Application, 2019 & 2026 (Kilo Tons)
    FIG. 12 Global Conventional Fuel Vehicles Fuel Ethanol Market, 2016-2026 (USD Million)
    FIG. 13 Global Conventional Fuel Vehicles Fuel Ethanol  Market, 2016-2026 (Kilo Tons)
    FIG. 14 Global Flexible Fuel Vehicles Fuel Ethanol Market, 2016-2026 (USD Million)
    FIG. 15 Global Flexible Fuel Vehicles Fuel Ethanol  Market, 2016-2026 (Kilo Tons)
    FIG. 16 Global Others Fuel Ethanol Market, 2016-2026 (USD Million)
    FIG. 17 Global Others Fuel Ethanol  Market, 2016-2026 (Kilo Tons)
    FIG. 18 Global Fuel Ethanol Market Share, by Region, 2019 & 2026
    FIG. 19 Global Fuel Ethanol Market Share, by Region, 2019 & 2026
    FIG. 20 North America Fuel Ethanol Market, 2016-2026
    FIG. 21 North America Fuel Ethanol  Market, 2016-2026 (Kilo Tons)
    FIG. 22 U.S. Fuel Ethanol Market, 2016-2026
    FIG. 23 U.S. Fuel Ethanol  Market, 2016-2026 (Kilo Tons)
    FIG. 24 Canada Fuel Ethanol Market, 2016-2026
    FIG. 25 Canada Fuel Ethanol  Market, 2016-2026 (Kilo Tons)
    FIG. 26 Europe Fuel Ethanol Market, 2016-2026
    FIG. 27 Europe Fuel Ethanol  Market, 2016-2026 (Kilo Tons)
    FIG. 28 Germany Fuel Ethanol Market, 2016-2026
    FIG. 29 Germany Fuel Ethanol  Market, 2016-2026 (Kilo Tons)
    FIG. 30 France Fuel Ethanol Market, 2016-2026
    FIG. 31 France Fuel Ethanol  Market, 2016-2026 (Kilo Tons)
    FIG. 32 U.K. Fuel Ethanol Market, 2016-2026
    FIG. 33 U.K. Fuel Ethanol  Market, 2016-2026 (Kilo Tons)
    FIG. 34 Italy Fuel Ethanol Market, 2016-2026
    FIG. 35 Italy Fuel Ethanol  Market, 2016-2026 (Kilo Tons)
    FIG. 36 Spain Fuel Ethanol Market, 2016-2026
    FIG. 37 Spain Fuel Ethanol  Market, 2016-2026 (Kilo Tons)
    FIG. 38 Rest of Europe Fuel Ethanol Market, 2016-2026
    FIG. 39 Rest of Europe Fuel Ethanol  Market, 2016-2026 (Kilo Tons)
    FIG. 40 Asia Pacific Fuel Ethanol Market, 2016-2026
    FIG. 41 Asia Pacific Fuel Ethanol  Market, 2016-2026 (Kilo Tons)
    FIG. 42 China Fuel Ethanol Market, 2016-2026
    FIG. 43 China Fuel Ethanol  Market, 2016-2026 (Kilo Tons)
    FIG. 44 Japan Fuel Ethanol Market, 2016-2026
    FIG. 45 Japan Fuel Ethanol  Market, 2016-2026 (Kilo Tons)
    FIG. 46 India Fuel Ethanol Market, 2016-2026
    FIG. 47 India Fuel Ethanol  Market, 2016-2026 (Kilo Tons)
    FIG. 48 South  Korea Fuel Ethanol Market, 2016-2026
    FIG. 49 South  Korea Fuel Ethanol  Market, 2016-2026 (Kilo Tons)
    FIG. 50 South-East Asia Fuel Ethanol Market, 2016-2026
    FIG. 51 South-East Asia Fuel Ethanol  Market, 2016-2026 (Kilo Tons)
    FIG. 52 Rest of Asia Pacific Fuel Ethanol Market, 2016-2026
    FIG. 53 Rest of Asia Pacific Fuel Ethanol  Market, 2016-2026 (Kilo Tons)
    FIG. 54 Latin America Fuel Ethanol Market, 2016-2026
    FIG. 55 Latin America Fuel Ethanol  Market, 2016-2026 (Kilo Tons)
    FIG. 56 Brazil Fuel Ethanol Market, 2016-2026
    FIG. 57 Brazil Fuel Ethanol  Market, 2016-2026 (Kilo Tons)
    FIG. 58 Mexico Fuel Ethanol Market, 2016-2026
    FIG. 59 Mexico Fuel Ethanol  Market, 2016-2026 (Kilo Tons)
    FIG. 60 Rest of Latin America Fuel Ethanol Market, 2016-2026
    FIG. 61 Rest of Latin America Fuel Ethanol  Market, 2016-2026 (Kilo Tons)
    FIG. 62 The Middle-East and Africa Fuel Ethanol Market, 2016-2026
    FIG. 63 The Middle-East and Africa Fuel Ethanol  Market, 2016-2026 (Kilo Tons)
    FIG. 64 GCC Countries Fuel Ethanol Market, 2016-2026
    FIG. 65 GCC Countries Fuel Ethanol  Market, 2016-2026 (Kilo Tons)
    FIG. 66 South Africa Fuel Ethanol Market, 2016-2026
    FIG. 67 South Africa Fuel Ethanol  Market, 2016-2026 (Kilo Tons)
    FIG. 68 Rest of Middle-East Africa Fuel Ethanol Market, 2016-2026
    FIG. 69 Rest of Middle-East Africa Fuel Ethanol  Market, 2016-2026 (Kilo Tons)
    FIG. 70 Global Fuel Ethanol production and revenue, 2016-2026 (USD Million) (Kilo Tons)
    FIG. 71 North America Fuel Ethanol production and revenue, 2016-2026 (USD Million) (Kilo Tons)
    FIG. 72 Europe Fuel Ethanol production and revenue, 2016-2026 (USD Million) (Kilo Tons)
    FIG. 73 Asia Pacific Fuel Ethanol production and revenue, 2016-2026 (USD Million) (Kilo Tons)
    FIG. 74 Latin America Fuel Ethanol production and revenue, 2016-2026 (USD Million) (Kilo Tons)
    FIG. 75 Middle East and Africa Fuel Ethanol production and revenue, 2016-2026 (USD Million) (Kilo Tons)
    FIG. 76 Competitor Market Share – Revenue
    FIG. 77 Competitor Market Share – Volume
    FIG. 78 BlueFire Renewables, Inc. Revenue and Growth Rate
    FIG. 79 BlueFire Renewables, Inc. Market Share
    FIG. 80 Cargill, Inc. Revenue and Growth Rate
    FIG. 81 Cargill, Inc. Market Share
    FIG. 82 Flint Hills Resources LP Revenue and Growth Rate
    FIG. 83 Flint Hills Resources LP Market Share
    FIG. 84 Jilin Fuel Ethanol Co., Ltd. Revenue and Growth Rate
    FIG. 85 Jilin Fuel Ethanol Co., Ltd. Market Share
    FIG. 86 Valero Energy Corporation Revenue and Growth Rate
    FIG. 87 Valero Energy Corporation Market Share
    FIG. 88 Wilmar International Ltd. Revenue and Growth Rate
    FIG. 89 Wilmar International Ltd. Market Share
    FIG. 90 Archer Daniels Midland Company Revenue and Growth Rate
    FIG. 91 Archer Daniels Midland Company Market Share
    FIG. 92 BP plc Revenue and Growth Rate
    FIG. 93 BP plc Market Share
    FIG. 94 E.I. du Pont de Nemours and Company Revenue and Growth Rate
    FIG. 95 E.I. du Pont de Nemours and Company Market Share
    FIG. 96 Green Plains Renewable, Inc. Revenue and Growth Rate
    FIG. 97 Green Plains Renewable, Inc. Market Share
    FIG. 98 Pacific Ethanol, Inc. Revenue and Growth Rate
    FIG. 99 Pacific Ethanol, Inc. Market Share
    FIG. 100 Raízen S.A. Revenue and Growth Rate
    FIG. 101 Raízen S.A. Market Share
    FIG. 102 Market Dynamics
    FIG. 103 Global Fuel Ethanol – Value Chain Analysis
    FIG. 104 Key Mandates and Regulations
    FIG. 105 Technology Roadmap and Timeline
    FIG. 106 Market Attractiveness Analysis – By Type
    FIG. 107 Market Attractiveness Analysis – By Application
    FIG. 108 Market Attractiveness Analysis – By Region
    FIG. 109 Manufacturing Cost Structure of Fuel Ethanol
    FIG. 110 Fuel Ethanol Industrial Chain Analysis
    FIG. 111 Market Channel
    FIG. 112 Marketing Channel Development Trend
    FIG. 113 Growth in World Gross Product, 2008-2019

    List of Tables

    TABLE 1 Global Fuel Ethanol market, 2019 & 2026 (USD Million)
    TABLE 2 Global Fuel Ethanol market, by Type, 2016-2026 (USD Million)
    TABLE 3 Global Fuel Ethanol market, by Type, 2016-2026 (Kilo Tons)
    TABLE 4 Global Fuel Ethanol market, by Application, 2016-2026 (USD Million)
    TABLE 5 Global Fuel Ethanol market, by Application, 2016-2026 (Kilo Tons)
    TABLE 6 Global Fuel Ethanol market, by region, 2016-2026 (USD Million)
    TABLE 7 Global Fuel Ethanol market, by region, 2016-2026 (Kilo Tons)
    TABLE 8 North America Fuel Ethanol Market, by Type, 2016-2026 (USD Million)
    TABLE 9 North America Fuel Ethanol Market, by Type, 2016-2026 (Kilo Tons)
    TABLE 10 North America Fuel Ethanol Market, by Application, 2016-2026 (USD Million)
    TABLE 11 North America Fuel Ethanol Market, by Application, 2016-2026 (Kilo Tons)
    TABLE 12 Europe Fuel Ethanol Market, by Type, 2016-2026 (USD Million)
    TABLE 13 Europe Fuel Ethanol Market, by Type, 2016-2026 (Kilo Tons)
    TABLE 14 Europe Fuel Ethanol Market, by Application, 2016-2026 (USD Million)
    TABLE 15 Europe Fuel Ethanol Market, by Application, 2016-2026 (Kilo Tons)
    TABLE 16 Asia Pacific Fuel Ethanol Market, by Type, 2016-2026 (USD Million)
    TABLE 17 Asia Pacific Fuel Ethanol Market, by Type, 2016-2026 (Kilo Tons)
    TABLE 18 Asia Pacific Fuel Ethanol Market, by Application, 2016-2026 (USD Million)
    TABLE 19 Asia Pacific Fuel Ethanol Market, by Application, 2016-2026 (Kilo Tons)
    TABLE 20 Latin America Fuel Ethanol Market, by Type, 2016-2026 (USD Million)
    TABLE 21 Latin America Fuel Ethanol Market, by Type, 2016-2026 (Kilo Tons)
    TABLE 22 Latin America Fuel Ethanol Market, by Application, 2016-2026 (USD Million)
    TABLE 23 Latin America Fuel Ethanol Market, by Application, 2016-2026 (Kilo Tons)
    TABLE 24 The Middle-East and Africa Fuel Ethanol Market, by Type, 2016-2026 (USD Million)
    TABLE 25 The Middle-East and Africa Fuel Ethanol Market, by Type, 2016-2026 (Kilo Tons)
    TABLE 26 The Middle-East and Africa Fuel Ethanol Market, by Application, 2016-2026 (USD Million)
    TABLE 27 The Middle-East and Africa Fuel Ethanol Market, by Application, 2016-2026 (Kilo Tons)
    TABLE 28 North America Fuel Ethanol Production, Consumption, Export, Import, 2016-2019
    TABLE 29 Europe Fuel Ethanol Production, Consumption, Export, Import, 2016-2019
    TABLE 30 Asia Pacific Fuel Ethanol Production, Consumption, Export, Import, 2016-2019
    TABLE 31 Latin America Fuel Ethanol Production, Consumption, Export, Import, 2016-2019
    TABLE 32 Middle East & Africa Fuel Ethanol Production, Consumption, Export, Import, 2016-2019
    TABLE 33 Global Fuel Ethanol Market - Company Revenue Analysis 2016-2019 (USD Million)
    TABLE 34 Global Fuel Ethanol Market - Company Revenue Share Analysis 2016-2019(%)
    TABLE 35 Global Fuel Ethanol Market - Company Volume Analysis 2016-2019 (Kilo Tons)
    TABLE 36 Global Fuel Ethanol Market - Company Volume Share Analysis 2016-2019(%)
    TABLE 37 Acquisitions and Mergers
    TABLE 38 New Product/Service Launch
    TABLE 39 Research & Development Activities
    TABLE 40 Market Drivers
    TABLE 41 Market Restraints
    TABLE 42 Market Opportunities
    TABLE 43 Production Base and Market Concentration Rate of Raw Material
    TABLE 44 Key Suppliers of Raw Materials
    TABLE 45 Raw Materials Sources of Fuel Ethanol Major Manufacturers in 2016
    TABLE 46 Major Buyers of Fuel Ethanol
    TABLE 47 Distributors/Traders of Fuel Ethanol by Region
  •  

    Industry Major Market Players

    • BlueFire Renewables Inc.
    • Cargill Inc.
    • Flint Hills Resources LP
    • Valero Energy Corporation
    • Green Plains Renewable Inc.
    • Wilmar International Ltd.
    • Archer Daniels Midland Company
    • BP plc
    • E.I. du Pont de Nemours and Company
    • Pacific Ethanol Inc.
    • Raízen S.A.
    • Jilin Fuel Ethanol Co. Ltd.