Search Market Research Report

Discover Our Latest Reports
Discover Our Featured Reports
Discover Top Selling Reports

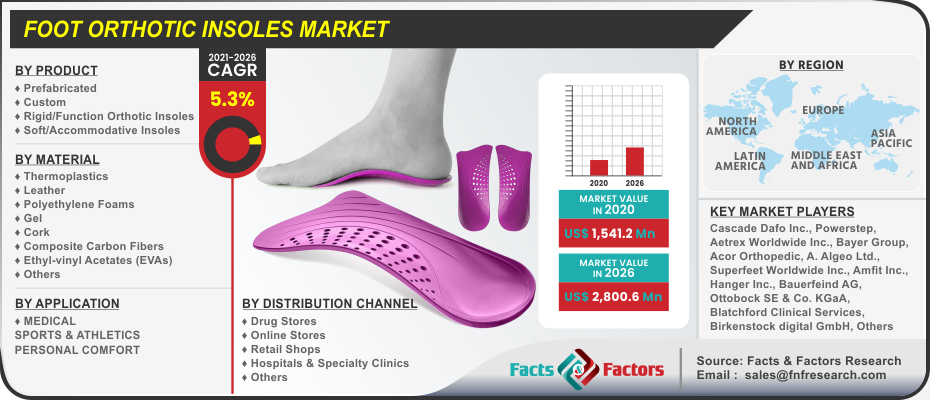
Foot Orthotic Insoles Market Size, Share Global Analysis Report, , 2021 – 2026

report img

Foot Orthotic Insoles Market By Product (Prefabricated and Custom (Rigid/Function Orthotic Insoles and Soft/Accommodative Insoles)), By Material (Thermoplastics, Leather, Polyethylene Foams, Gel, Cork, Composite Carbon Fibers, Ethyl-vinyl Acetates (EVAs), and Others), By Application (Medical, Sports & Athletics, and Personal Comfort), and By Distribution Channel (Drug Stores, Online Stores, Retail Shops, Hospitals & Specialty Clinics, and Others): Global Industry Perspective, Comprehensive Analysis, and Forecast, 2021 – 2026

Industry Insights

According to the report published by the Facts & Factors, global demand for the foot orthotic insoles market was estimated at approximately USD 1,541.2 Million in 2020 and is expected to generate revenue of around USD 2,800.6 Million by the end of 2026, growing at a CAGR of around 5.3% between 2021 and 2026.

logoMarket Overview

Orthotic refers to devices placed inside the shoes for the purpose of restoring our natural foot function. It is also known as orthotic insoles, orthoses, or shoe inserts. The foot orthotic insoles are of two types: prefabricated and customized that are manufactured using several materials like thermoplastics, leather, polyethylene foams, cork, ethyl-vinyl acetates (EVAs), composite carbon fibers, gel, nylon, etc. In addition, they are being used by both pediatric and adult populations intended for medical and other applications. These are in use in many applications like medical, sports & athletics, and personal comfort.

logoIndustry Growth Factor

The global market of foot orthotic insoles market size is anticipated to witness a major growth rate during the forecast period. The increase in the geriatric population and the high incidences of diabetes and plantar fasciitis are key factors driving the global foot orthotic insoles market. Other growth factors such as the technological advancements owing to the increasing ongoing investments in research and development are projected to expand the market size across the globe. In addition, the increasing occurrence of osteoarthritis, rheumatoid arthritis, and juvenile is also increasing the adoption.

Furthermore, the growing demand for custom-made foot orthotics is also propelling the global market of foot orthotic insole. Such products are custom-made after a total costing of the foot structure of the user. Tailor-made orthotics have clinically proven benefits over prefabricated ones regarding better pain management and comfort. There is an escalating requirement for 3D printed orthotics between the end-users. These are thin in comparison to traditional ones and also come with improved pace efficiency and proprioception, fuelling the market development. Conversely, the rising adoption of eco-friendly materials in orthotic insoles manufacturing is creating growth opportunities avenues for the foot orthotic insole industry.

Foot Orthotic Insoles Market

To know more about this report | Request Free Sample Copy

logoSegmentation Analysis

The global foot orthotic insoles market is classified into product, material, application, and distribution channels. Based on the product, the global foot orthotic insoles market is segmented into prefabricated and custom. The custom is further sub-segmented into rigid/function orthotic insoles and soft/accommodative insoles.

On the basis of material, the global foot orthotic insoles market is separated into thermoplastics, leather, polyethylene foams, gel, cork, composite carbon fibers, ethyl-vinyl acetates, and others. The global foot orthotic insoles market based on the application is separated into medical, sports & athletics, and personal comfort. In terms of the distribution channel, the global foot orthotic insoles market is divided into drug stores, online stores, retail shops, hospitals & specialty clinics, and others.

logoReport Scope

Report Attribute

Details

Market Size in 2020

USD 1,541.2 Million

Projected Market Size in 2026

USD 2,800.6 Million

CAGR Growth Rate

5.3% CAGR

Base Year

2020

Forecast Years

2021-2026

Key Market Players

Cascade Dafo Inc., Powerstep, Aetrex Worldwide Inc., Bayer Group, Acor Orthopedic, Superfeet Worldwide Inc., A. Algeo Ltd., Amfit Inc., Hanger Inc., Bauerfeind AG, Ottobock SE & Co. KGaA, Blatchford Clinical Services, Birkenstock digital GmbH, Foot Science International, Salts Techstep, The Foot Lab, Groupe Gorgé, Arden Orthotics, Create O & P, Tynor Orthotics Pvt. Ltd., Bolton Bros, and DOLA – Digital Orthotics Laboratories Australia, among others.

Key Segment

By Product, By Material, By Application, By Distribution Channel, and By Region

Major Regions Covered

North America, Europe, Asia Pacific, Latin America, and the Middle East & Africa

Purchase Options

Request customized purchase options to meet your research needs. Explore purchase options

logo Regional Analysis

The global foot orthotic insoles market is divided into five major regional segments North America, Europe, Asia-Pacific, Latin America, and the Middle East & Africa. North America is contributing to the largest market revenue in the global market. The increasing prevalence of diabetes, the rising sports activities, the technological advancements owing to rising ongoing investments in R&D are some key factors that are likely to contribute significantly to the regional market upsurge. Also, the rising occurrence of conditions like diabetes, arthritis, and obesity further sustains regional expansion. Moreover, the focus of the United States healthcare system on value-based services and quality of care is resulting in favorable surroundings for the market.

The region of Asia-Pacific is estimated to observe beneficial growth in the global foot orthotic insoles. This can be attributed to the increasing target population along with the technological advancements. Additionally, improving health awareness is also profiting the regional market. Besides, the demand for prefabricated and custom insoles is considerably high in this region owing to the rise in the prevalence of chronic diseases such as diabetes and musculoskeletal disorders.

logo Competitive Players

Several companies covered in the global foot orthotic insoles market include :

  • Cascade Dafo Inc.
  • Powerstep
  • Aetrex Worldwide Inc.
  • Bayer Group
  • Acor Orthopedic
  • Superfeet Worldwide Inc.
  • A. Algeo Ltd.
  • Amfit Inc.
  • Hanger Inc.
  • Bauerfeind AG
  • Ottobock SE & Co. KGaA
  • Blatchford Clinical Services
  • Birkenstock digital GmbH
  • Foot Science International
  • Salts Techstep
  • The Foot Lab
  • Groupe Gorgé
  • Arden Orthotics
  • Create O & P
  • Tynor Orthotics Pvt. Ltd.
  • Bolton Bros
  • DOLA – Digital Orthotics Laboratories Australia

In addition, strategic partnerships, mergers, and acquisitions by key industries are driving the market growth.

logo By Product Segment Analysis

  • Prefabricated
  • Custom
  • Rigid/Function Orthotic Insoles
  • Soft/Accommodative Insoles

logo By Material Segment Analysis

  • Thermoplastics
  • Leather
  • Polyethylene Foams
  • Gel
  • Cork
  • Composite Carbon Fibers
  • Ethyl-vinyl Acetates (EVAs)
  • Others

logo By Application Segment Analysis

  • Medical
  • Sports & Athletics
  • Personal Comfort

logo By Distribution Channel Segment Analysis

  • Drug Stores
  • Online Stores
  • Retail Shops
  • Hospitals & Specialty Clinics
  • Others

logo Regional Segment Analysis

  • North America
    • U.S.
    • Canada
  • Europe
    • U.K.
    • France
    • Germany
    • Rest of Europe
  • Asia Pacific
    • China
    • Japan
    • India
    • South Korea
    • Rest of Asia Pacific
  • Latin America
    • Brazil
    • Rest of Latin America
  • The Middle East and Africa
    • GCC Countries
    • South Africa
    • Rest of Middle East Africa

Table of Content

  1. Chapter 1 Executive Summary
    1. 1.1. Introduction of Foot Orthotic Insoles
    2. 1.2. Global Foot Orthotic Insoles Market, 2019 & 2026 (USD Million)
    3. 1.3. Global Foot Orthotic Insoles Market, 2016 – 2026(USD Million)
    4. 1.4. Global Foot Orthotic Insoles MarketAbsolute Revenue Opportunity, 2016 – 2026(USD Million)
    5. 1.5. Global Foot Orthotic Insoles MarketIncremental Revenue Opportunity, 2020 – 2026(USD Million)
  2. Chapter 2 Foot Orthotic Insoles Market – Product Analysis
    1. 2.1. Global Foot Orthotic Insoles Market – Product Overview
    2. 2.2. Global Foot Orthotic Insoles Market Share, by Product, 2019 & 2026(USD Million)
    3. 2.3. Prefabricated
      1. 2.3.1. Global Prefabricated Foot Orthotic Insoles Market, 2016 – 2026(USD Million)
    4. 2.4. Custom
      1. 2.4.1. Global Custom Foot Orthotic Insoles Market, 2016 – 2026(USD Million)
    5. 2.5. Rigid/Function Orthotic Insoles
      1. 2.5.1. Global Rigid/Function Orthotic Insoles Foot Orthotic Insoles Market, 2016 – 2026(USD Million)
    6. 2.6. Soft/Accommodative Insoles
      1. 2.6.1. Global Soft/Accommodative Insoles Foot Orthotic Insoles Market, 2016 – 2026(USD Million)
  3. Chapter 3 Foot Orthotic Insoles Market – Material Analysis
    1. 3.1. Global Foot Orthotic Insoles Market – Material Overview
    2. 3.2. Global Foot Orthotic Insoles Market Share, by Material, 2019 & 2026(USD Million)
    3. 3.3. Thermoplastics
      1. 3.3.1. Global Thermoplastics Foot Orthotic Insoles Market, 2016 – 2026(USD Million)
    4. 3.4. Leather
      1. 3.4.1. Global Leather Foot Orthotic Insoles Market, 2016 – 2026(USD Million)
    5. 3.5. Polyethylene Foams
      1. 3.5.1. Global Polyethylene Foams Foot Orthotic Insoles Market, 2016 – 2026(USD Million)
    6. 3.6. Gel
      1. 3.6.1. Global Gel Foot Orthotic Insoles Market, 2016 – 2026(USD Million)
    7. 3.7. Cork
      1. 3.7.1. Global Cork Foot Orthotic Insoles Market, 2016 – 2026(USD Million)
    8. 3.8. Composite Carbon Fibers
      1. 3.8.1. Global Composite Carbon Fibers Foot Orthotic Insoles Market, 2016 – 2026(USD Million)
    9. 3.9. Ethyl-vinyl Acetates (EVAs)
      1. 3.9.1. Global Ethyl-vinyl Acetates (EVAs) Foot Orthotic Insoles Market, 2016 – 2026(USD Million)
    10. 3.10. Others
      1. 3.10.1. Global Others Foot Orthotic Insoles Market, 2016 – 2026(USD Million)
  4. Chapter 4 Foot Orthotic Insoles Market – Application Analysis
    1. 4.1. Global Foot Orthotic Insoles Market – Application Overview
    2. 4.2. Global Foot Orthotic Insoles Market Share, by Application, 2019 & 2026(USD Million)
    3. 4.3. Medical
      1. 4.3.1. Global Medical Foot Orthotic Insoles Market, 2016 – 2026(USD Million)
    4. 4.4. Sports & Athletics
      1. 4.4.1. Global Sports & Athletics Foot Orthotic Insoles Market, 2016 – 2026(USD Million)
    5. 4.5. Personal Comfort
      1. 4.5.1. Global Personal Comfort Foot Orthotic Insoles Market, 2016 – 2026(USD Million)
  5. Chapter 5 Foot Orthotic Insoles Market – Distribution Channel Analysis
    1. 5.1. Global Foot Orthotic Insoles Market – Distribution Channel Overview
    2. 5.2. Global Foot Orthotic Insoles Market Share, by Distribution Channel, 2019 & 2026(USD Million)
    3. 5.3. Drug Stores
      1. 5.3.1. Global Drug Stores Foot Orthotic Insoles Market, 2016 – 2026(USD Million)
    4. 5.4. Online Stores
      1. 5.4.1. Global Online Stores Foot Orthotic Insoles Market, 2016 – 2026(USD Million)
    5. 5.5. Retail Shops
      1. 5.5.1. Global Retail Shops Foot Orthotic Insoles Market, 2016 – 2026(USD Million)
    6. 5.6. Hospitals & Specialty Clinics
      1. 5.6.1. Global Hospitals & Specialty Clinics Foot Orthotic Insoles Market, 2016 – 2026(USD Million)
    7. 5.7. Others
      1. 5.7.1. Global Others Foot Orthotic Insoles Market, 2016 – 2026(USD Million)
  6. Chapter 6 Foot Orthotic Insoles Market – Regional Analysis
    1. 6.1. Global Foot Orthotic Insoles Market Regional Overview
    2. 6.2. Global Foot Orthotic Insoles Market Share, by Region, 2019 & 2026(USD Million)
    3. 6.3. North America
      1. 6.3.1. North America Foot Orthotic Insoles Market, 2016 – 2026(USD Million)
        1. 6.3.1.1. North America Foot Orthotic Insoles Market, by Country, 2016 - 2026(USD Million)
      2. 6.3.2. North America Foot Orthotic Insoles Market, by Product, 2016 – 2026
        1. 6.3.2.1. North America Foot Orthotic Insoles Market, by Product, 2016 – 2026(USD Million)
      3. 6.3.3. North America Foot Orthotic Insoles Market, by Material, 2016 – 2026
        1. 6.3.3.1. North America Foot Orthotic Insoles Market, by Material, 2016 – 2026(USD Million)
      4. 6.3.4. North America Foot Orthotic Insoles Market, by Application, 2016 – 2026
        1. 6.3.4.1. North America Foot Orthotic Insoles Market, by Application, 2016 – 2026(USD Million)
      5. 6.3.5. North America Foot Orthotic Insoles Market, by Distribution Channel, 2016 – 2026
        1. 6.3.5.1. North America Foot Orthotic Insoles Market, by Distribution Channel, 2016 – 2026(USD Million)
      6. 6.3.6. U.S.
        1. 6.3.6.1. U.S. Foot Orthotic Insoles Market, 2016 – 2026(USD Million)
      7. 6.3.7. Canada
        1. 6.3.7.1. Canada Foot Orthotic Insoles Market, 2016 – 2026(USD Million)
    4. 6.4. Europe
      1. 6.4.1. Europe Foot Orthotic Insoles Market, 2016 – 2026(USD Million)
        1. 6.4.1.1. Europe Foot Orthotic Insoles Market, by Country, 2016 - 2026(USD Million)
      2. 6.4.2. Europe Foot Orthotic Insoles Market, by Product, 2016 – 2026
        1. 6.4.2.1. Europe Foot Orthotic Insoles Market, by Product, 2016 – 2026(USD Million)
      3. 6.4.3. Europe Foot Orthotic Insoles Market, by Material, 2016 – 2026
        1. 6.4.3.1. Europe Foot Orthotic Insoles Market, by Material, 2016 – 2026(USD Million)
      4. 6.4.4. Europe Foot Orthotic Insoles Market, by Application, 2016 – 2026
        1. 6.4.4.1. Europe Foot Orthotic Insoles Market, by Application, 2016 – 2026(USD Million)
      5. 6.4.5. Europe Foot Orthotic Insoles Market, by Distribution Channel, 2016 – 2026
        1. 6.4.5.1. Europe Foot Orthotic Insoles Market, by Distribution Channel, 2016 – 2026(USD Million)
      6. 6.4.6. Germany
        1. 6.4.6.1. Germany Foot Orthotic Insoles Market, 2016 – 2026(USD Million)
      7. 6.4.7. France
        1. 6.4.7.1. France Foot Orthotic Insoles Market, 2016 – 2026(USD Million)
      8. 6.4.8. U.K.
        1. 6.4.8.1. U.K. Foot Orthotic Insoles Market, 2016 – 2026(USD Million)
      9. 6.4.9. Italy
        1. 6.4.9.1. Italy Foot Orthotic Insoles Market, 2016 – 2026(USD Million)
      10. 6.4.10. Spain
        1. 6.4.10.1. Spain Foot Orthotic Insoles Market, 2016 – 2026(USD Million)
      11. 6.4.11. Rest of Europe
        1. 6.4.11.1. Rest of Europe Foot Orthotic Insoles Market, 2016 – 2026(USD Million)
    5. 6.5. Asia Pacific
      1. 6.5.1. Asia Pacific Foot Orthotic Insoles Market, 2016 – 2026(USD Million)
        1. 6.5.1.1. Asia Pacific Foot Orthotic Insoles Market, by Country, 2016 - 2026(USD Million)
      2. 6.5.2. Asia Pacific Foot Orthotic Insoles Market, by Product, 2016 – 2026
        1. 6.5.2.1. Asia Pacific Foot Orthotic Insoles Market, by Product, 2016 – 2026(USD Million)
      3. 6.5.3. Asia Pacific Foot Orthotic Insoles Market, by Material, 2016 – 2026
        1. 6.5.3.1. Asia Pacific Foot Orthotic Insoles Market, by Material, 2016 – 2026(USD Million)
      4. 6.5.4. Asia Pacific Foot Orthotic Insoles Market, by Application, 2016 – 2026
        1. 6.5.4.1. Asia Pacific Foot Orthotic Insoles Market, by Application, 2016 – 2026(USD Million)
      5. 6.5.5. Asia Pacific Foot Orthotic Insoles Market, by Distribution Channel, 2016 – 2026
        1. 6.5.5.1. Asia Pacific Foot Orthotic Insoles Market, by Distribution Channel, 2016 – 2026(USD Million)
      6. 6.5.6. China
        1. 6.5.6.1. China Foot Orthotic Insoles Market, 2016 – 2026(USD Million)
      7. 6.5.7. Japan
        1. 6.5.7.1. Japan Foot Orthotic Insoles Market, 2016 – 2026(USD Million)
      8. 6.5.8. India
        1. 6.5.8.1. India Foot Orthotic Insoles Market, 2016 – 2026(USD Million)
      9. 6.5.9. South Korea
        1. 6.5.9.1. South Korea Foot Orthotic Insoles Market, 2016 – 2026(USD Million)
      10. 6.5.10. South-East Asia
        1. 6.5.10.1. South-East Asia Foot Orthotic Insoles Market, 2016 – 2026(USD Million)
      11. 6.5.11. Rest of Asia Pacific
        1. 6.5.11.1. Rest of Asia Pacific Foot Orthotic Insoles Market, 2016 – 2026(USD Million)
    6. 6.6. Latin America
      1. 6.6.1. Latin America Foot Orthotic Insoles Market, 2016 – 2026(USD Million)
        1. 6.6.1.1. Latin America Foot Orthotic Insoles Market, by Country, 2016 - 2026(USD Million)
      2. 6.6.2. Latin America Foot Orthotic Insoles Market, by Product, 2016 – 2026
        1. 6.6.2.1. Latin America Foot Orthotic Insoles Market, by Product, 2016 – 2026(USD Million)
      3. 6.6.3. Latin America Foot Orthotic Insoles Market, by Material, 2016 – 2026
        1. 6.6.3.1. Latin America Foot Orthotic Insoles Market, by Material, 2016 – 2026(USD Million)
      4. 6.6.4. Latin America Foot Orthotic Insoles Market, by Application, 2016 – 2026
        1. 6.6.4.1. Latin America Foot Orthotic Insoles Market, by Application, 2016 – 2026(USD Million)
      5. 6.6.5. Latin America Foot Orthotic Insoles Market, by Distribution Channel, 2016 – 2026
        1. 6.6.5.1. Latin America Foot Orthotic Insoles Market, by Distribution Channel, 2016 – 2026(USD Million)
      6. 6.6.6. Brazil
        1. 6.6.6.1. Brazil Foot Orthotic Insoles Market, 2016 – 2026(USD Million)
      7. 6.6.7. Mexico
        1. 6.6.7.1. Mexico Foot Orthotic Insoles Market, 2016 – 2026(USD Million)
      8. 6.6.8. Rest of Latin America
        1. 6.6.8.1. Rest of Latin America Foot Orthotic Insoles Market, 2016 – 2026(USD Million)
    7. 6.7. The Middle-East and Africa
      1. 6.7.1. The Middle-East and Africa Foot Orthotic Insoles Market, 2016 – 2026(USD Million)
        1. 6.7.1.1. The Middle-East and Africa Foot Orthotic Insoles Market, by Country, 2016 - 2026(USD Million)
      2. 6.7.2. The Middle-East and Africa Foot Orthotic Insoles Market, by Product, 2016 – 2026
        1. 6.7.2.1. The Middle-East and Africa Foot Orthotic Insoles Market, by Product, 2016 – 2026(USD Million)
      3. 6.7.3. The Middle-East and Africa Foot Orthotic Insoles Market, by Material, 2016 – 2026
        1. 6.7.3.1. The Middle-East and Africa Foot Orthotic Insoles Market, by Material, 2016 – 2026(USD Million)
      4. 6.7.4. The Middle-East and Africa Foot Orthotic Insoles Market, by Application, 2016 – 2026
        1. 6.7.4.1. The Middle-East and Africa Foot Orthotic Insoles Market, by Application, 2016 – 2026(USD Million)
      5. 6.7.5. The Middle-East and Africa Foot Orthotic Insoles Market, by Distribution Channel, 2016 – 2026
        1. 6.7.5.1. The Middle-East and Africa Foot Orthotic Insoles Market, by Distribution Channel, 2016 – 2026(USD Million)
      6. 6.7.6. GCC Countries
        1. 6.7.6.1. GCC Countries Foot Orthotic Insoles Market, 2016 – 2026(USD Million)
      7. 6.7.7. South Africa
        1. 6.7.7.1. South Africa Foot Orthotic Insoles Market, 2016 – 2026(USD Million)
      8. 6.7.8. Rest of Middle-East Africa
        1. 6.7.8.1. Rest of Middle-East Africa Foot Orthotic Insoles Market, 2016 – 2026(USD Million)
  7. Chapter 7 Foot Orthotic Insoles Market – Competitive Landscape
    1. 7.1. Competitor Market Share – Revenue
    2. 7.2. Market Concentration Rate Analysis, Top 3 and Top 5 Players
    3. 7.3. Strategic Developments
      1. 7.3.1. Acquisitions and Mergers
      2. 7.3.2. New Products
      3. 7.3.3. Research & Development Activities
  8. Chapter 8 Company Profiles
    1. 8.1. Cascade Dafo Inc.
      1. 8.1.1. Company Overview
      2. 8.1.2. Product/ServicePortfolio
      3. 8.1.3. Cascade Dafo Inc. Sales, Revenue, and Gross Margin
      4. 8.1.4. Cascade Dafo Inc. Revenue and Growth Rate
      5. 8.1.5. Cascade Dafo Inc. Market Share
      6. 8.1.6. Recent Initiatives, Funding/VC Activities, and Technological Innovations
    2. 8.2. Powerstep
      1. 8.2.1. Company Overview
      2. 8.2.2. Product/ServicePortfolio
      3. 8.2.3. Powerstep Sales, Revenue, and Gross Margin
      4. 8.2.4. Powerstep Revenue and Growth Rate
      5. 8.2.5. Powerstep Market Share
      6. 8.2.6. Recent Initiatives, Funding/VC Activities, and Technological Innovations
    3. 8.3. Aetrex Worldwide Inc.
      1. 8.3.1. Company Overview
      2. 8.3.2. Product/ServicePortfolio
      3. 8.3.3. Aetrex Worldwide Inc. Sales, Revenue, and Gross Margin
      4. 8.3.4. Aetrex Worldwide Inc. Revenue and Growth Rate
      5. 8.3.5. Aetrex Worldwide Inc. Market Share
      6. 8.3.6. Recent Initiatives, Funding/VC Activities, and Technological Innovations
    4. 8.4. Bayer Group
      1. 8.4.1. Company Overview
      2. 8.4.2. Product/ServicePortfolio
      3. 8.4.3. Bayer Group Sales, Revenue, and Gross Margin
      4. 8.4.4. Bayer Group Revenue and Growth Rate
      5. 8.4.5. Bayer Group Market Share
      6. 8.4.6. Recent Initiatives, Funding/VC Activities, and Technological Innovations
    5. 8.5. Acor Orthopedic
      1. 8.5.1. Company Overview
      2. 8.5.2. Product/ServicePortfolio
      3. 8.5.3. Acor Orthopedic Sales, Revenue, and Gross Margin
      4. 8.5.4. Acor Orthopedic Revenue and Growth Rate
      5. 8.5.5. Acor Orthopedic Market Share
      6. 8.5.6. Recent Initiatives, Funding/VC Activities, and Technological Innovations
    6. 8.6. Superfeet Worldwide Inc.
      1. 8.6.1. Company Overview
      2. 8.6.2. Product/ServicePortfolio
      3. 8.6.3. Superfeet Worldwide Inc. Sales, Revenue, and Gross Margin
      4. 8.6.4. Superfeet Worldwide Inc. Revenue and Growth Rate
      5. 8.6.5. Superfeet Worldwide Inc. Market Share
      6. 8.6.6. Recent Initiatives, Funding/VC Activities, and Technological Innovations
      7. 8.7. A. Algeo Ltd.
      8. 8.7.1. Company Overview
      9. 8.7.2. Product/ServicePortfolio
        1. 8.7.3. A. Algeo Ltd. Sales, Revenue, and Gross Margin
        2. 8.7.4. A. Algeo Ltd. Revenue and Growth Rate
        3. 8.7.5. A. Algeo Ltd. Market Share
      10. 8.7.6. Recent Initiatives, Funding/VC Activities, and Technological Innovations
    7. 8.8. Amfit Inc.
      1. 8.8.1. Company Overview
      2. 8.8.2. Product/ServicePortfolio
      3. 8.8.3. Amfit Inc. Sales, Revenue, and Gross Margin
      4. 8.8.4. Amfit Inc. Revenue and Growth Rate
      5. 8.8.5. Amfit Inc. Market Share
      6. 8.8.6. Recent Initiatives, Funding/VC Activities, and Technological Innovations
    8. 8.9. Hanger Inc.
      1. 8.9.1. Company Overview
      2. 8.9.2. Product/ServicePortfolio
      3. 8.9.3. Hanger Inc. Sales, Revenue, and Gross Margin
      4. 8.9.4. Hanger Inc. Revenue and Growth Rate
      5. 8.9.5. Hanger Inc. Market Share
      6. 8.9.6. Recent Initiatives, Funding/VC Activities, and Technological Innovations
    9. 8.10. Bauerfeind AG
      1. 8.10.1. Company Overview
      2. 8.10.2. Product/ServicePortfolio
      3. 8.10.3. Bauerfeind AG Sales, Revenue, and Gross Margin
      4. 8.10.4. Bauerfeind AG Revenue and Growth Rate
      5. 8.10.5. Bauerfeind AG Market Share
      6. 8.10.6. Recent Initiatives, Funding/VC Activities, and Technological Innovations
    10. 8.11. Ottobock SE & Co. KGaA
      1. 8.11.1. Company Overview
      2. 8.11.2. Product/ServicePortfolio
      3. 8.11.3. Ottobock SE & Co. KGaA Sales, Revenue, and Gross Margin
      4. 8.11.4. Ottobock SE & Co. KGaA Revenue and Growth Rate
      5. 8.11.5. Ottobock SE & Co. KGaA Market Share
      6. 8.11.6. Recent Initiatives, Funding/VC Activities, and Technological Innovations
    11. 8.12. Blatchford Clinical Services
      1. 8.12.1. Company Overview
      2. 8.12.2. Product/ServicePortfolio
      3. 8.12.3. Blatchford Clinical Services Sales, Revenue, and Gross Margin
      4. 8.12.4. Blatchford Clinical Services Revenue and Growth Rate
      5. 8.12.5. Blatchford Clinical Services Market Share
      6. 8.12.6. Recent Initiatives, Funding/VC Activities, and Technological Innovations
    12. 8.13. Birkenstock digital GmbH
      1. 8.13.1. Company Overview
      2. 8.13.2. Product/ServicePortfolio
      3. 8.13.3. Birkenstock digital GmbH Sales, Revenue, and Gross Margin
      4. 8.13.4. Birkenstock digital GmbH Revenue and Growth Rate
      5. 8.13.5. Birkenstock digital GmbH Market Share
      6. 8.13.6. Recent Initiatives, Funding/VC Activities, and Technological Innovations
    13. 8.14. Foot Science International
      1. 8.14.1. Company Overview
      2. 8.14.2. Product/ServicePortfolio
      3. 8.14.3. Foot Science International Sales, Revenue, and Gross Margin
      4. 8.14.4. Foot Science International Revenue and Growth Rate
      5. 8.14.5. Foot Science International Market Share
      6. 8.14.6. Recent Initiatives, Funding/VC Activities, and Technological Innovations
    14. 8.15. Salts Techstep
      1. 8.15.1. Company Overview
      2. 8.15.2. Product/ServicePortfolio
      3. 8.15.3. Salts Techstep Sales, Revenue, and Gross Margin
      4. 8.15.4. Salts Techstep Revenue and Growth Rate
      5. 8.15.5. Salts Techstep Market Share
      6. 8.15.6. Recent Initiatives, Funding/VC Activities, and Technological Innovations
    15. 8.16. The Foot Lab
      1. 8.16.1. Company Overview
      2. 8.16.2. Product/ServicePortfolio
      3. 8.16.3. The Foot Lab Sales, Revenue, and Gross Margin
      4. 8.16.4. The Foot Lab Revenue and Growth Rate
      5. 8.16.5. The Foot Lab Market Share
      6. 8.16.6. Recent Initiatives, Funding/VC Activities, and Technological Innovations
    16. 8.17. Groupe Gorgé
      1. 8.17.1. Company Overview
      2. 8.17.2. Product/ServicePortfolio
      3. 8.17.3. Groupe Gorgé Sales, Revenue, and Gross Margin
      4. 8.17.4. Groupe Gorgé Revenue and Growth Rate
      5. 8.17.5. Groupe Gorgé Market Share
      6. 8.17.6. Recent Initiatives, Funding/VC Activities, and Technological Innovations
    17. 8.18. Arden Orthotics
      1. 8.18.1. Company Overview
      2. 8.18.2. Product/ServicePortfolio
      3. 8.18.3. Arden Orthotics Sales, Revenue, and Gross Margin
      4. 8.18.4. Arden Orthotics Revenue and Growth Rate
      5. 8.18.5. Arden Orthotics Market Share
      6. 8.18.6. Recent Initiatives, Funding/VC Activities, and Technological Innovations
    18. 8.19. Create O & P
      1. 8.19.1. Company Overview
      2. 8.19.2. Product/ServicePortfolio
      3. 8.19.3. Create O & P Sales, Revenue, and Gross Margin
      4. 8.19.4. Create O & P Revenue and Growth Rate
      5. 8.19.5. Create O & P Market Share
      6. 8.19.6. Recent Initiatives, Funding/VC Activities, and Technological Innovations
    19. 8.20. Tynor Orthotics Pvt. Ltd.
      1. 8.20.1. Company Overview
      2. 8.20.2. Product/ServicePortfolio
      3. 8.20.3. Tynor Orthotics Pvt. Ltd. Sales, Revenue, and Gross Margin
      4. 8.20.4. Tynor Orthotics Pvt. Ltd. Revenue and Growth Rate
      5. 8.20.5. Tynor Orthotics Pvt. Ltd. Market Share
      6. 8.20.6. Recent Initiatives, Funding/VC Activities, and Technological Innovations
    20. 8.21. Bolton Bros
      1. 8.21.1. Company Overview
      2. 8.21.2. Product/ServicePortfolio
      3. 8.21.3. Bolton Bros Sales, Revenue, and Gross Margin
      4. 8.21.4. Bolton Bros Revenue and Growth Rate
      5. 8.21.5. Bolton Bros Market Share
      6. 8.21.6. Recent Initiatives, Funding/VC Activities, and Technological Innovations
    21. 8.22. DOLA – Digital Orthotics Laboratories Australia
      1. 8.22.1. Company Overview
      2. 8.22.2. Product/ServicePortfolio
      3. 8.22.3. DOLA – Digital Orthotics Laboratories Australia Sales, Revenue, and Gross Margin
      4. 8.22.4. DOLA – Digital Orthotics Laboratories Australia Revenue and Growth Rate
      5. 8.22.5. DOLA – Digital Orthotics Laboratories Australia Market Share
      6. 8.22.6. Recent Initiatives, Funding/VC Activities, and Technological Innovations
  9. Chapter 9 Foot Orthotic Insoles — Industry Analysis
    1. 9.1. Introduction and Taxonomy
    2. 9.2. Foot Orthotic Insoles Market – Key Trends
      1. 9.2.1. Market Drivers
      2. 9.2.2. Market Restraints
      3. 9.2.3. Market Opportunities
    3. 9.3. Value Chain Analysis
    4. 9.4. Key Mandates and Regulations
    5. 9.5. Technology Roadmap and Timeline
    6. 9.6. Foot Orthotic Insoles Market – Attractiveness Analysis
      1. 9.6.1. By Product
      2. 9.6.2. By Material
      3. 9.6.3. By Application
      4. 9.6.4. By Distribution Channel
      5. 9.6.5. By Region
  10. Chapter 10 Industrial Chain, Sourcing Strategy, and Downstream Buyers
    1. 10.1. Foot Orthotic Insoles Industrial Chain Analysis
    2. 10.2. Downstream Buyers
    3. 10.3. Distributors/Traders List
  11. Chapter 11 Marketing Strategy Analysis
    1. 11.1. Marketing Channel
    2. 11.2. Direct Marketing
    3. 11.3. Indirect Marketing
    4. 11.4. Marketing Channel Development Trends
    5. 11.5. Economic/Political Environmental Change
  12. Chapter 12 Report Conclusion& Key Insights
    1. 12.1. Key Insights from Primary Interviews & Surveys Respondents
    2. 12.2. Key Takeaways from Analysts, Consultants, and Industry Leaders
  13. Chapter 13 Research Approach & Methodology
    1. 13.1. Report Description
    2. 13.2. Research Scope
    3. 13.3. Research Methodology
      1. 13.3.1. Secondary Research
      2. 13.3.2. Primary Research
      3. 13.3.3. Statistical Models
        1. 13.3.3.1. Company Share Analysis Model
        2. 13.3.3.2. Revenue Based Modeling
      4. 13.3.4. Research Limitations

      List of Figures

      Fig.1	Product Picture of  Foot Orthotic Insoles
      Fig.2	Global  Foot Orthotic Insoles  Market, 2016 – 2026(USD Million)
      Fig.3	Global  Foot Orthotic Insoles  MarketAbsolute Revenue Opportunity, 2016 – 2026(USD Million)
      Fig.4	Global  Foot Orthotic Insoles  MarketIncremental Revenue Opportunity, 2020 – 2026(USD Million)
      Fig.5	Global  Foot Orthotic Insoles  Market Share, by Product, 2019 & 2026(USD Million)
      Fig.6	Global Prefabricated Foot Orthotic Insoles  Market, 2016 – 2026(USD Million)
      Fig.7	Global Custom Foot Orthotic Insoles  Market, 2016 – 2026(USD Million)
      Fig.8	Global Rigid/Function Orthotic Insoles Foot Orthotic Insoles  Market, 2016 – 2026(USD Million)
      Fig.9	Global Soft/Accommodative Insoles Foot Orthotic Insoles  Market, 2016 – 2026(USD Million)
      Fig.10	Global  Foot Orthotic Insoles  Market Share, by Material, 2019 & 2026(USD Million)
      Fig.11	Global Thermoplastics Foot Orthotic Insoles  Market, 2016 – 2026(USD Million)
      Fig.12	Global Leather Foot Orthotic Insoles  Market, 2016 – 2026(USD Million)
      Fig.13	Global Polyethylene Foams Foot Orthotic Insoles  Market, 2016 – 2026(USD Million)
      Fig.14	Global Gel Foot Orthotic Insoles  Market, 2016 – 2026(USD Million)
      Fig.15	Global Cork Foot Orthotic Insoles  Market, 2016 – 2026(USD Million)
      Fig.16	Global Composite Carbon Fibers Foot Orthotic Insoles  Market, 2016 – 2026(USD Million)
      Fig.17	Global Ethyl-vinyl Acetates (EVAs) Foot Orthotic Insoles  Market, 2016 – 2026(USD Million)
      Fig.18	Global Others Foot Orthotic Insoles  Market, 2016 – 2026(USD Million)
      Fig.19	Global  Foot Orthotic Insoles  Market Share, by Application, 2019 & 2026(USD Million)
      Fig.20	Global Medical Foot Orthotic Insoles  Market, 2016 – 2026(USD Million)
      Fig.21	Global Sports & Athletics Foot Orthotic Insoles  Market, 2016 – 2026(USD Million)
      Fig.22	Global Personal Comfort Foot Orthotic Insoles  Market, 2016 – 2026(USD Million)
      Fig.23	Global  Foot Orthotic Insoles  Market Share, by Distribution Channel, 2019 & 2026(USD Million)
      Fig.24	Global Drug Stores Foot Orthotic Insoles  Market, 2016 – 2026(USD Million)
      Fig.25	Global Online Stores Foot Orthotic Insoles  Market, 2016 – 2026(USD Million)
      Fig.26	Global Retail Shops Foot Orthotic Insoles  Market, 2016 – 2026(USD Million)
      Fig.27	Global Hospitals & Specialty Clinics Foot Orthotic Insoles  Market, 2016 – 2026(USD Million)
      Fig.28	Global Others Foot Orthotic Insoles  Market, 2016 – 2026(USD Million)
      Fig.29	Global  Foot Orthotic Insoles  MarketShare, by Region, 2019 & 2026(USD Million)
      Fig.30	North America Foot Orthotic Insoles  Market, 2016 – 2026(USD Million)
      Fig.31	U.S. Foot Orthotic Insoles  Market, 2016 – 2026(USD Million)
      Fig.32	Canada Foot Orthotic Insoles  Market, 2016 – 2026(USD Million)
      Fig.33	Europe Foot Orthotic Insoles  Market, 2016 – 2026(USD Million)
      Fig.34	Germany Foot Orthotic Insoles  Market, 2016 – 2026(USD Million)
      Fig.35	France Foot Orthotic Insoles  Market, 2016 – 2026(USD Million)
      Fig.36	U.K. Foot Orthotic Insoles  Market, 2016 – 2026(USD Million)
      Fig.37	Italy Foot Orthotic Insoles  Market, 2016 – 2026(USD Million)
      Fig.38	Spain Foot Orthotic Insoles  Market, 2016 – 2026(USD Million)
      Fig.39	Rest of Europe Foot Orthotic Insoles  Market, 2016 – 2026(USD Million)
      Fig.40	Asia Pacific Foot Orthotic Insoles  Market, 2016 – 2026(USD Million)
      Fig.41	China Foot Orthotic Insoles  Market, 2016 – 2026(USD Million)
      Fig.42	Japan Foot Orthotic Insoles  Market, 2016 – 2026(USD Million)
      Fig.43	India Foot Orthotic Insoles  Market, 2016 – 2026(USD Million)
      Fig.44	South  Korea Foot Orthotic Insoles  Market, 2016 – 2026(USD Million)
      Fig.45	South-East Asia Foot Orthotic Insoles  Market, 2016 – 2026(USD Million)
      Fig.46	Rest of Asia Pacific Foot Orthotic Insoles  Market, 2016 – 2026(USD Million)
      Fig.47	Latin America Foot Orthotic Insoles  Market, 2016 – 2026(USD Million)
      Fig.48	Brazil Foot Orthotic Insoles  Market, 2016 – 2026(USD Million)
      Fig.49	Mexico Foot Orthotic Insoles  Market, 2016 – 2026(USD Million)
      Fig.50	Rest of Latin America Foot Orthotic Insoles  Market, 2016 – 2026(USD Million)
      Fig.51	The Middle-East and Africa Foot Orthotic Insoles  Market, 2016 – 2026(USD Million)
      Fig.52	GCC Countries Foot Orthotic Insoles  Market, 2016 – 2026(USD Million)
      Fig.53	South Africa Foot Orthotic Insoles  Market, 2016 – 2026(USD Million)
      Fig.54	Rest of Middle-East Africa Foot Orthotic Insoles  Market, 2016 – 2026(USD Million)
      Fig.55	Competitor Market Share – Revenue
      Fig.56	Cascade Dafo Inc. Revenue and Growth Rate
      Fig.57	Cascade Dafo Inc. Market Share
      Fig.58	Powerstep Revenue and Growth Rate
      Fig.59	Powerstep Market Share
      Fig.60	Aetrex Worldwide Inc. Revenue and Growth Rate
      Fig.61	Aetrex Worldwide Inc. Market Share
      Fig.62	Bayer Group Revenue and Growth Rate
      Fig.63	Bayer Group Market Share
      Fig.64	Acor Orthopedic Revenue and Growth Rate
      Fig.65	Acor Orthopedic Market Share
      Fig.66	Superfeet Worldwide Inc. Revenue and Growth Rate
      Fig.67	Superfeet Worldwide Inc. Market Share
      Fig.68	A. Algeo Ltd. Revenue and Growth Rate
      Fig.69	A. Algeo Ltd. Market Share
      Fig.70	Amfit Inc. Revenue and Growth Rate
      Fig.71	Amfit Inc. Market Share
      Fig.72	Hanger Inc. Revenue and Growth Rate
      Fig.73	Hanger Inc. Market Share
      Fig.74	Bauerfeind AG Revenue and Growth Rate
      Fig.75	Bauerfeind AG Market Share
      Fig.76	Ottobock SE & Co. KGaA Revenue and Growth Rate
      Fig.77	Ottobock SE & Co. KGaA Market Share
      Fig.78	Blatchford Clinical Services Revenue and Growth Rate
      Fig.79	Blatchford Clinical Services Market Share
      Fig.80	Birkenstock digital GmbH Revenue and Growth Rate
      Fig.81	Birkenstock digital GmbH Market Share
      Fig.82	Foot Science International Revenue and Growth Rate
      Fig.83	Foot Science International Market Share
      Fig.84	Salts Techstep Revenue and Growth Rate
      Fig.85	Salts Techstep Market Share
      Fig.86	The Foot Lab Revenue and Growth Rate
      Fig.87	The Foot Lab Market Share
      Fig.88	Groupe Gorgé Revenue and Growth Rate
      Fig.89	Groupe Gorgé Market Share
      Fig.90	Arden Orthotics Revenue and Growth Rate
      Fig.91	Arden Orthotics Market Share
      Fig.92	Create O & P Revenue and Growth Rate
      Fig.93	Create O & P Market Share
      Fig.94	Tynor Orthotics Pvt. Ltd. Revenue and Growth Rate
      Fig.95	Tynor Orthotics Pvt. Ltd. Market Share
      Fig.96	Bolton Bros Revenue and Growth Rate
      Fig.97	Bolton Bros Market Share
      Fig.98	DOLA – Digital Orthotics Laboratories Australia Revenue and Growth Rate
      Fig.99	DOLA – Digital Orthotics Laboratories Australia Market Share
      Fig.100	Market Dynamics
      Fig.101	Global  Foot Orthotic Insoles  – Value Chain Analysis
      Fig.102	Key Mandates and Regulations
      Fig.103	Technology Roadmap and Timeline
      Fig.104	Market Attractiveness Analysis – By Product
      Fig.105	Market Attractiveness Analysis – By Material
      Fig.106	Market Attractiveness Analysis – By Application
      Fig.107	Market Attractiveness Analysis – By Distribution Channel
      Fig.108	Market Attractiveness Analysis – By Region
      Fig.109	Foot Orthotic Insoles  Industrial Chain Analysis
      Fig.110	Market Channels
      Fig.111	Marketing Channel Development Trend
      Fig.112	Growth in World Gross Product, 2008-2018
      

      List of Tables

      Table 1	Global  Foot Orthotic Insoles Market, 2019 & 2026(USD Million)
      Table 2	Global  Foot Orthotic Insoles Market, by Product, 2016 – 2026(USD Million)
      Table 3	Global  Foot Orthotic Insoles Market, by Material, 2016 – 2026(USD Million)
      Table 4	Global  Foot Orthotic Insoles Market, by Application, 2016 – 2026(USD Million)
      Table 5	Global  Foot Orthotic Insoles Market, by Distribution Channel, 2016 – 2026(USD Million)
      Table 6	Global  Foot Orthotic Insoles Market, by Region, 2016 – 2026(USD Million)
      Table 7	North America Foot Orthotic Insoles  Market, by Country, 2016 – 2026(USD Million)
      Table 8	North America Foot Orthotic Insoles  Market, by Product, 2016 – 2026(USD Million)
      Table 9	North America Foot Orthotic Insoles  Market, by Material, 2016 – 2026(USD Million)
      Table 10 North America Foot Orthotic Insoles  Market, by Application, 2016 – 2026(USD Million)
      Table 11 North America Foot Orthotic Insoles  Market, by Distribution Channel, 2016 – 2026(USD Million)
      Table 12 Europe Foot Orthotic Insoles  Market, by Country, 2016 – 2026(USD Million)
      Table 13 Europe Foot Orthotic Insoles  Market, by Product, 2016 – 2026(USD Million)
      Table 14 Europe Foot Orthotic Insoles  Market, by Material, 2016 – 2026(USD Million)
      Table 15 Europe Foot Orthotic Insoles  Market, by Application, 2016 – 2026(USD Million)
      Table 16 Europe Foot Orthotic Insoles  Market, by Distribution Channel, 2016 – 2026(USD Million)
      Table 17 Asia Pacific Foot Orthotic Insoles  Market, by Country, 2016 – 2026(USD Million)
      Table 18 Asia Pacific Foot Orthotic Insoles  Market, by Product, 2016 – 2026(USD Million)
      Table 19 Asia Pacific Foot Orthotic Insoles  Market, by Material, 2016 – 2026(USD Million)
      Table 20 Asia Pacific Foot Orthotic Insoles  Market, by Application, 2016 – 2026(USD Million)
      Table 21 Asia Pacific Foot Orthotic Insoles  Market, by Distribution Channel, 2016 – 2026(USD Million)
      Table 22 Latin America Foot Orthotic Insoles  Market, by Country, 2016 – 2026(USD Million)
      Table 23 Latin America Foot Orthotic Insoles  Market, by Product, 2016 – 2026(USD Million)
      Table 24 Latin America Foot Orthotic Insoles  Market, by Material, 2016 – 2026(USD Million)
      Table 25 Latin America Foot Orthotic Insoles  Market, by Application, 2016 – 2026(USD Million)
      Table 26 Latin America Foot Orthotic Insoles  Market, by Distribution Channel, 2016 – 2026(USD Million)
      Table 27 The Middle-East and Africa Foot Orthotic Insoles  Market, by Country, 2016 – 2026(USD Million)
      Table 28 The Middle-East and Africa Foot Orthotic Insoles  Market, by Product, 2016 – 2026(USD Million)
      Table 29 The Middle-East and Africa Foot Orthotic Insoles  Market, by Material, 2016 – 2026(USD Million)
      Table 30 The Middle-East and Africa Foot Orthotic Insoles  Market, by Application, 2016 – 2026(USD Million)
      Table 31 The Middle-East and Africa Foot Orthotic Insoles  Market, by Distribution Channel, 2016 – 2026(USD Million)
      Table 32 Global  Foot Orthotic Insoles  Market - Company Revenue Analysis, 2016 – 2019(USD Million)
      Table 33 Global  Foot Orthotic Insoles  Market - Company Revenue Share Analysis, 2016 – 2019(%)
      Table 34 Acquisitions and Mergers
      Table 35 Market Drivers – Impact Analysis
      Table 36 Market Restraints
      Table 37 Market Opportunities
      Table 38 Major Buyers of  Foot Orthotic Insoles
      Table 39 Distributors/Traders of  Foot Orthotic Insoles  by Region
      

Industry Major Market Players

  • Cascade Dafo Inc.
  • Powerstep
  • Aetrex Worldwide Inc.
  • Bayer Group
  • Acor Orthopedic
  • Superfeet Worldwide Inc.
  • A. Algeo Ltd.
  • Amfit Inc.
  • Hanger Inc.
  • Bauerfeind AG
  • Ottobock SE & Co. KGaA
  • Blatchford Clinical Services
  • Birkenstock digital GmbH
  • Foot Science International
  • Salts Techstep
  • The Foot Lab
  • Groupe Gorgé
  • Arden Orthotics
  • Create O & P
  • Tynor Orthotics Pvt. Ltd.
  • Bolton Bros
  • DOLA – Digital Orthotics Laboratories Australia