Search Market Research Report

Discover Our Latest Reports
Discover Our Featured Reports
Discover Top Selling Reports

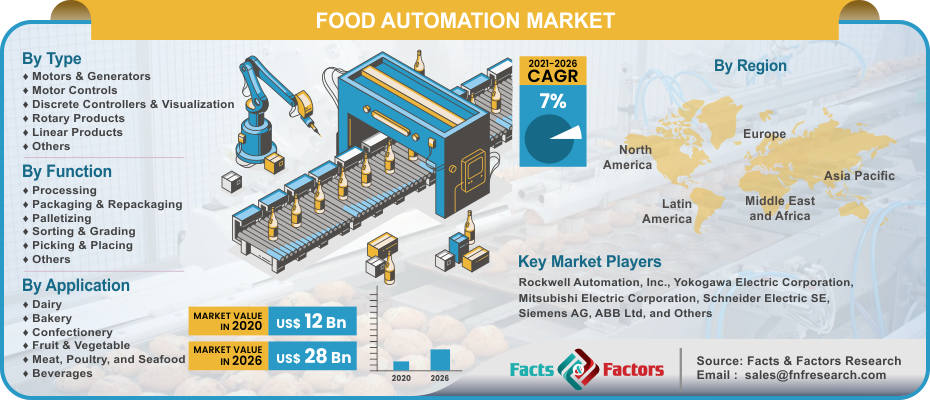
Food Automation Market Size, Share Global Analysis Report, 2021 – 2026

report img

Food Automation Market By Type (Rotary and Linear Products, Discrete Controller Systems & Visualization, Motor Controls, Motors & Generators, and Others), By Function (Sorting & Grading, Packaging & Re-Packaging, Processing, Pickling & Placing, Palletizing, and Others), By Application (Beverage, Bakery, Dairy, Fruits & Vegetables, Confectionery, Meat, Poultry & Seafood, and Others), And Regions - Global & Regional Industry Perspective, Comprehensive Analysis, and Forecast 2021 – 2026

Industry Insights

[205+ Pages Report] Facts & Factors published a report titled Food Automation Market provides a complete and comprehensive market overview. The global food automation market is estimated to grow at a CAGR of 7% from an initial value of USD 12 Billion in 2020 to a forecasted value of USD 28 Billion by 2026.

logoMarket Overview

The technology of automation helps control and monitor the production of goods and services which was usually carried out by humans manually. Food automation is primarily used by the Food & Beverage industry for maintaining, product quality, consistency, high output, improved pickling and handling, and also to speed up the packaging process. The growing demand for superior quality, profitability, and higher food production is projected to drive the food automation market over the forecast period.

logoIndustry Growth Factors

The food automation market growth is projected to bolster due to the rising consumer preferences for processed and ready-to-eat foods and growing technological advancements in automation. Moreover, the stringent international food safety regulations brought into effect by the regulatory bodies are also likely to augment the expansion of the food automation market. The growing adoption of automated & management solutions in the food & beverage industry to limit human intervention to limit chances of contamination or spread of the virus is projected to drive the market during the forecast period. Moreover, the advantages such as labor & time saving and high efficiency for plant & enterprise-level control solutions will bolster the market. Additionally, the growing investments in food automated solutions such as robotics and interconnected solutions for lowering labor-intensive processes will help in high productivity and quality. The changing consumer behavior and need for automated solutions for quality & productivity maintenance are other factors propelling the food automation market. However, slow investments by players, high requirement of investments in R&D activities, lack of awareness regarding food automated solutions, demand for skilled professionals, and variabilities in food products or processes are major factors behind the market restraint.

Food Automation Market

To know more about this report | Request Free Sample Copy

logoSegmentation Analysis

The global food automation market is segmented based on type, function, application, and region.

Based on type, the global food automation market is classified into rotary and linear products, discrete controller systems & visualization, motor controls, motors & generators, and others. The motors & generators segment accounts for the largest market share due to its multi-functional nature and demand for motor control applications. Additionally, the growing need for smooth & effective functioning and precision in the food industry is a significant factor bolstering the segment growth. The awareness regarding efficient energy management also propels the market. By function, the market is divided into sorting & grading, packaging & re-packaging, processing, pickling & placing, palletizing, and others. The palletizing & depalletizing segment is estimated to hold the largest market share due to growing awareness about robotics and sensor-based solutions for improving efficiency and lowering errors. On the basis of application, the food automation market is categorized into the beverage, bakery, dairy, fruits & vegetables, confectionery, meat, poultry & seafood, and others. The beverage segment is anticipated to grow faster owing to the advancements in the digitization of beverage manufacturing and the adoption of ERP and SCADA solutions for better product quality.

logo Report Scope

Report Attribute

Details

Market Size in 2020

USD 12 Billion

Projected Market Size in 2026

USD 28 Billion

CAGR Growth Rate

7% CAGR

Base Year

2020

Forecast Years

2021-2026

Key Market Players

Rockwell Automation, Inc., Yokogawa Electric Corporation, Mitsubishi Electric Corporation, Schneider Electric SE, Siemens AG, ABB Ltd, GEA Group, Yaskawa Electric Corporation, Rexnord Corporation, Emerson Electric Co., Fortive Corporation, and Nord Drivesystems.

Key Segment

By Type, By Function, By Application, and Region

Major Regions Covered

North America, Europe, Asia Pacific, Latin America, and Middle East & Africa

Purchase Options

Request customized purchase options to meet your research needs. Explore purchase options

logo Regional Analysis

Europe is anticipated to hold the largest market share due to the growing processed food & beverage market in the region. The region is expected to witness steady growth over the forecast period depending on the high standard of a living, hectic lifestyle, growing manufacturers, high disposable income, and demand for ready-to-eat foods. Asia-Pacific is projected to experience the fastest growth during the forecast owing to the strong market base, growing income levels, rapid urbanization, foreign investments, and changing diet. The adoption of improved robotics, sensors, and other automation hardware by China and Japan further helps the food automation industry grow. Moreover, stringent government regulations associated with food safety & quality to lower or prevent consumer illness support the adoption of food automation solutions.

logo Competitive Players

Some of the key players participating in the food automation market include :

  • Rockwell Automation Inc.
  • Yokogawa Electric Corporation
  • Mitsubishi Electric Corporation
  • Schneider Electric SE
  • Siemens AG
  • ABB Ltd
  • GEA Group
  • Yaskawa Electric Corporation
  • Rexnord Corporation
  • Emerson Electric Co.
  • Fortive Corporation
  • Nord Drivesystems.

logo By Type Segment Analysis

  • Motors & Generators
  • Motor Controls
  • Discrete Controllers & Visualization
  • Rotary Products
  • Linear Products
  • Others

logo By Function Segment Analysis

  • Processing
  • Packaging & Repackaging
  • Palletizing
  • Sorting & Grading
  • Picking & Placing
  • Others

logo By Application Segment Analysis

  • Dairy
  • Bakery
  • Confectionery
  • Fruit & Vegetable
  • Meat, Poultry, and Seafood
  • Beverages

logo By Regional Segment Analysis

  • North America
    • U.S.
    • Canada
  • Europe
    • UK
    • France
    • Germany
    • Italy
    • Spain
    • Rest of Europe
  • Asia Pacific
    • China
    • Japan
    • India
    • South Korea
    • Southeast Asia
    • Rest of Asia Pacific
  • Latin America
    • Brazil
    • Mexico
    • Rest of Latin America
  • Middle East and Africa
    • GCC Countries
    • South Africa
    • Rest of MEA

Table of Content

  1. Chapter 1 Executive Summary
    1. 1.1. Introduction of Food Automation
    2. 1.2. Global Food Automation Market, 2019 & 2026 (USD Billion)
    3. 1.3. Global Food Automation Market, 2016 – 2026 (USD Billion)
    4. 1.4. Global Food Automation Market Absolute Revenue Opportunity, 2016 – 2026 (USD Billion)
    5. 1.5. Global Food Automation Market Incremental Revenue Opportunity, 2020 – 2026 (USD Billion)
  2. Chapter 2 Food Automation Market – Type Analysis
    1. 2.1. Global Food Automation Market – Type Overview
    2. 2.2. Global Food Automation Market Share, by Type, 2019 & 2026 (USD Billion)
    3. 2.3. Rotary and Linear Products
      1. 2.3.1. Global Rotary and Linear Products Food Automation Market, 2016 – 2026 (USD Billion)
    4. 2.4. Discrete Controller Systems & Visualization
      1. 2.4.1. Global Discrete Controller Systems & Visualization Food Automation Market, 2016 – 2026 (USD Billion)
    5. 2.5. Motor Controls
      1. 2.5.1. Global Motor Controls Food Automation Market, 2016 – 2026 (USD Billion)
    6. 2.6. Motors & Generators
      1. 2.6.1. Global Motors & Generators Food Automation Market, 2016 – 2026 (USD Billion)
    7. 2.7. Others
      1. 2.7.1. Global Others Food Automation Market, 2016 – 2026 (USD Billion)
  3. Chapter 3 Food Automation Market – Function Analysis
    1. 3.1. Global Food Automation Market – Function Overview
    2. 3.2. Global Food Automation Market Share, by Function, 2019 & 2026 (USD Billion)
    3. 3.3. Sorting & Grading
      1. 3.3.1. Global Sorting & Grading Food Automation Market, 2016 – 2026 (USD Billion)
    4. 3.4. Packaging & Re-Packaging
      1. 3.4.1. Global Packaging & Re-Packaging Food Automation Market, 2016 – 2026 (USD Billion)
    5. 3.5. Processing
      1. 3.5.1. Global Processing Food Automation Market, 2016 – 2026 (USD Billion)
    6. 3.6. Pickling & Placing
      1. 3.6.1. Global Pickling & Placing Food Automation Market, 2016 – 2026 (USD Billion)
    7. 3.7. Palletizing
      1. 3.7.1. Global Palletizing Food Automation Market, 2016 – 2026 (USD Billion)
    8. 3.8. Palletizing
      1. 3.8.1. Global Palletizing Food Automation Market, 2016 – 2026 (USD Billion)
    9. 3.9. Others
      1. 3.9.1. Global Others Food Automation Market, 2016 – 2026 (USD Billion)
  4. Chapter 4 Food Automation Market – Application Analysis
    1. 4.1. Global Food Automation Market – Application Overview
    2. 4.2. Global Food Automation Market Share, by Application, 2019 & 2026 (USD Billion)
    3. 4.3. Beverage
      1. 4.3.1. Global Beverage Food Automation Market, 2016 – 2026 (USD Billion)
    4. 4.4. Bakery
      1. 4.4.1. Global Bakery Food Automation Market, 2016 – 2026 (USD Billion)
    5. 4.5. Dairy
      1. 4.5.1. Global Dairy Food Automation Market, 2016 – 2026 (USD Billion)
    6. 4.6. Fruits & Vegetables
      1. 4.6.1. Global Fruits & Vegetables Food Automation Market, 2016 – 2026 (USD Billion)
    7. 4.7. Confectionery
      1. 4.7.1. Global Confectionery Food Automation Market, 2016 – 2026 (USD Billion)
    8. 4.8. Meat, Poultry & Seafood
      1. 4.8.1. Global Meat, Poultry & Seafood Food Automation Market, 2016 – 2026 (USD Billion)
    9. 4.9. Others
      1. 4.9.1. Global Others Food Automation Market, 2016 – 2026 (USD Billion)
  5. Chapter 5 Food Automation Market – Regional Analysis
    1. 5.1. Global Food Automation Market Regional Overview
    2. 5.2. Global Food Automation Market Share, by Region, 2019 & 2026 (USD Billion)
    3. 5.3. North America
      1. 5.3.1. North America Food Automation Market, 2016 – 2026 (USD Billion)
        1. 5.3.1.1. North America Food Automation Market, by Country, 2016 - 2026 (USD Billion)
      2. 5.3.2. North America Food Automation Market, by Type, 2016 – 2026
        1. 5.3.2.1. North America Food Automation Market, by Type, 2016 – 2026 (USD Billion)
      3. 5.3.3. North America Food Automation Market, by Function, 2016 – 2026
        1. 5.3.3.1. North America Food Automation Market, by Function, 2016 – 2026 (USD Billion)
      4. 5.3.4. North America Food Automation Market, by Application, 2016 – 2026
        1. 5.3.4.1. North America Food Automation Market, by Application, 2016 – 2026 (USD Billion)
      5. 5.3.5. U.S.
        1. 5.3.5.1. U.S. Food Automation Market, 2016 – 2026 (USD Billion)
      6. 5.3.6. Canada
        1. 5.3.6.1. Canada Food Automation Market, 2016 – 2026 (USD Billion)
    4. 5.4. Europe
      1. 5.4.1. Europe Food Automation Market, 2016 – 2026 (USD Billion)
        1. 5.4.1.1. Europe Food Automation Market, by Country, 2016 - 2026 (USD Billion)
      2. 5.4.2. Europe Food Automation Market, by Type, 2016 – 2026
        1. 5.4.2.1. Europe Food Automation Market, by Type, 2016 – 2026 (USD Billion)
      3. 5.4.3. Europe Food Automation Market, by Function, 2016 – 2026
        1. 5.4.3.1. Europe Food Automation Market, by Function, 2016 – 2026 (USD Billion)
      4. 5.4.4. Europe Food Automation Market, by Application, 2016 – 2026
        1. 5.4.4.1. Europe Food Automation Market, by Application, 2016 – 2026 (USD Billion)
      5. 5.4.5. Germany
        1. 5.4.5.1. Germany Food Automation Market, 2016 – 2026 (USD Billion)
      6. 5.4.6. France
        1. 5.4.6.1. France Food Automation Market, 2016 – 2026 (USD Billion)
      7. 5.4.7. U.K.
        1. 5.4.7.1. U.K. Food Automation Market, 2016 – 2026 (USD Billion)
      8. 5.4.8. Italy
        1. 5.4.8.1. Italy Food Automation Market, 2016 – 2026 (USD Billion)
      9. 5.4.9. Spain
        1. 5.4.9.1. Spain Food Automation Market, 2016 – 2026 (USD Billion)
      10. 5.4.10. Rest of Europe
        1. 5.4.10.1. Rest of Europe Food Automation Market, 2016 – 2026 (USD Billion)
    5. 5.5. Asia Pacific
      1. 5.5.1. Asia Pacific Food Automation Market, 2016 – 2026 (USD Billion)
        1. 5.5.1.1. Asia Pacific Food Automation Market, by Country, 2016 - 2026 (USD Billion)
      2. 5.5.2. Asia Pacific Food Automation Market, by Type, 2016 – 2026
        1. 5.5.2.1. Asia Pacific Food Automation Market, by Type, 2016 – 2026 (USD Billion)
      3. 5.5.3. Asia Pacific Food Automation Market, by Function, 2016 – 2026
        1. 5.5.3.1. Asia Pacific Food Automation Market, by Function, 2016 – 2026 (USD Billion)
      4. 5.5.4. Asia Pacific Food Automation Market, by Application, 2016 – 2026
        1. 5.5.4.1. Asia Pacific Food Automation Market, by Application, 2016 – 2026 (USD Billion)
      5. 5.5.5. China
        1. 5.5.5.1. China Food Automation Market, 2016 – 2026 (USD Billion)
      6. 5.5.6. Japan
        1. 5.5.6.1. Japan Food Automation Market, 2016 – 2026 (USD Billion)
      7. 5.5.7. India
        1. 5.5.7.1. India Food Automation Market, 2016 – 2026 (USD Billion)
      8. 5.5.8. South Korea
        1. 5.5.8.1. South Korea Food Automation Market, 2016 – 2026 (USD Billion)
      9. 5.5.9. South-East Asia
        1. 5.5.9.1. South-East Asia Food Automation Market, 2016 – 2026 (USD Billion)
      10. 5.5.10. Rest of Asia Pacific
        1. 5.5.10.1. Rest of Asia Pacific Food Automation Market, 2016 – 2026 (USD Billion)
    6. 5.6. Latin America
      1. 5.6.1. Latin America Food Automation Market, 2016 – 2026 (USD Billion)
        1. 5.6.1.1. Latin America Food Automation Market, by Country, 2016 - 2026 (USD Billion)
      2. 5.6.2. Latin America Food Automation Market, by Type, 2016 – 2026
        1. 5.6.2.1. Latin America Food Automation Market, by Type, 2016 – 2026 (USD Billion)
      3. 5.6.3. Latin America Food Automation Market, by Function, 2016 – 2026
        1. 5.6.3.1. Latin America Food Automation Market, by Function, 2016 – 2026 (USD Billion)
      4. 5.6.4. Latin America Food Automation Market, by Application, 2016 – 2026
        1. 5.6.4.1. Latin America Food Automation Market, by Application, 2016 – 2026 (USD Billion)
      5. 5.6.5. Brazil
        1. 5.6.5.1. Brazil Food Automation Market, 2016 – 2026 (USD Billion)
      6. 5.6.6. Mexico
        1. 5.6.6.1. Mexico Food Automation Market, 2016 – 2026 (USD Billion)
      7. 5.6.7. Rest of Latin America
        1. 5.6.7.1. Rest of Latin America Food Automation Market, 2016 – 2026 (USD Billion)
    7. 5.7. The Middle-East and Africa
      1. 5.7.1. The Middle-East and Africa Food Automation Market, 2016 – 2026 (USD Billion)
        1. 5.7.1.1. The Middle-East and Africa Food Automation Market, by Country, 2016 - 2026 (USD Billion)
      2. 5.7.2. The Middle-East and Africa Food Automation Market, by Type, 2016 – 2026
        1. 5.7.2.1. The Middle-East and Africa Food Automation Market, by Type, 2016 – 2026 (USD Billion)
      3. 5.7.3. The Middle-East and Africa Food Automation Market, by Function, 2016 – 2026
        1. 5.7.3.1. The Middle-East and Africa Food Automation Market, by Function, 2016 – 2026 (USD Billion)
      4. 5.7.4. The Middle-East and Africa Food Automation Market, by Application, 2016 – 2026
        1. 5.7.4.1. The Middle-East and Africa Food Automation Market, by Application, 2016 – 2026 (USD Billion)
      5. 5.7.5. GCC Countries
        1. 5.7.5.1. GCC Countries Food Automation Market, 2016 – 2026 (USD Billion)
      6. 5.7.6. South Africa
        1. 5.7.6.1. South Africa Food Automation Market, 2016 – 2026 (USD Billion)
      7. 5.7.7. Rest of Middle-East Africa
        1. 5.7.7.1. Rest of Middle-East Africa Food Automation Market, 2016 – 2026 (USD Billion)
  6. Chapter 6 Food Automation Market – Competitive Landscape
    1. 6.1. Competitor Market Share – Revenue
    2. 6.2. Market Concentration Rate Analysis, Top 3 and Top 5 Players
    3. 6.3. Strategic Developments
      1. 6.3.1. Acquisitions and Mergers
      2. 6.3.2. New Products
      3. 6.3.3. Research & Development Activities
  7. Chapter 7 Company Profiles
    1. 7.1. Rockwell Automation Inc.
      1. 7.1.1. Company Overview
      2. 7.1.2. Product/Service Portfolio
      3. 7.1.3. Rockwell Automation Inc. Sales, Revenue, and Gross Margin
      4. 7.1.4. Rockwell Automation Inc. Revenue and Growth Rate
      5. 7.1.5. Rockwell Automation Inc. Market Share
      6. 7.1.6. Recent Initiatives, Funding/VC Activities, and Technological Innovations
    2. 7.2. Yokogawa Electric Corporation
      1. 7.2.1. Company Overview
      2. 7.2.2. Product/Service Portfolio
      3. 7.2.3. Yokogawa Electric Corporation Sales, Revenue, and Gross Margin
      4. 7.2.4. Yokogawa Electric Corporation Revenue and Growth Rate
      5. 7.2.5. Yokogawa Electric Corporation Market Share
      6. 7.2.6. Recent Initiatives, Funding/VC Activities, and Technological Innovations
    3. 7.3. Mitsubishi Electric Corporation
      1. 7.3.1. Company Overview
      2. 7.3.2. Product/Service Portfolio
      3. 7.3.3. Mitsubishi Electric Corporation Sales, Revenue, and Gross Margin
      4. 7.3.4. Mitsubishi Electric Corporation Revenue and Growth Rate
      5. 7.3.5. Mitsubishi Electric Corporation Market Share
      6. 7.3.6. Recent Initiatives, Funding/VC Activities, and Technological Innovations
    4. 7.4. Schneider Electric SE
      1. 7.4.1. Company Overview
      2. 7.4.2. Product/Service Portfolio
      3. 7.4.3. Schneider Electric SE Sales, Revenue, and Gross Margin
      4. 7.4.4. Schneider Electric SE Revenue and Growth Rate
      5. 7.4.5. Schneider Electric SE Market Share
      6. 7.4.6. Recent Initiatives, Funding/VC Activities, and Technological Innovations
    5. 7.5. Siemens AG
      1. 7.5.1. Company Overview
      2. 7.5.2. Product/Service Portfolio
      3. 7.5.3. Siemens AG Sales, Revenue, and Gross Margin
      4. 7.5.4. Siemens AG Revenue and Growth Rate
      5. 7.5.5. Siemens AG Market Share
      6. 7.5.6. Recent Initiatives, Funding/VC Activities, and Technological Innovations
    6. 7.6. ABB Ltd
      1. 7.6.1. Company Overview
      2. 7.6.2. Product/Service Portfolio
      3. 7.6.3. ABB Ltd Sales, Revenue, and Gross Margin
      4. 7.6.4. ABB Ltd Revenue and Growth Rate
      5. 7.6.5. ABB Ltd Market Share
      6. 7.6.6. Recent Initiatives, Funding/VC Activities, and Technological Innovations
    7. 7.7. GEA Group
      1. 7.7.1. Company Overview
      2. 7.7.2. Product/Service Portfolio
      3. 7.7.3. GEA Group Sales, Revenue, and Gross Margin
      4. 7.7.4. GEA Group Revenue and Growth Rate
      5. 7.7.5. GEA Group Market Share
      6. 7.7.6. Recent Initiatives, Funding/VC Activities, and Technological Innovations
    8. 7.8. Yaskawa Electric Corporation
      1. 7.8.1. Company Overview
      2. 7.8.2. Product/Service Portfolio
      3. 7.8.3. Yaskawa Electric Corporation Sales, Revenue, and Gross Margin
      4. 7.8.4. Yaskawa Electric Corporation Revenue and Growth Rate
      5. 7.8.5. Yaskawa Electric Corporation Market Share
      6. 7.8.6. Recent Initiatives, Funding/VC Activities, and Technological Innovations
    9. 7.9. Rexnord Corporation
      1. 7.9.1. Company Overview
      2. 7.9.2. Product/Service Portfolio
      3. 7.9.3. Rexnord Corporation Sales, Revenue, and Gross Margin
      4. 7.9.4. Rexnord Corporation Revenue and Growth Rate
      5. 7.9.5. Rexnord Corporation Market Share
      6. 7.9.6. Recent Initiatives, Funding/VC Activities, and Technological Innovations
    10. 7.10. Emerson Electric Co.
      1. 7.10.1. Company Overview
      2. 7.10.2. Product/Service Portfolio
      3. 7.10.3. Emerson Electric Co. Sales, Revenue, and Gross Margin
      4. 7.10.4. Emerson Electric Co. Revenue and Growth Rate
      5. 7.10.5. Emerson Electric Co. Market Share
      6. 7.10.6. Recent Initiatives, Funding/VC Activities, and Technological Innovations
    11. 7.11. Fortive Corporation
      1. 7.11.1. Company Overview
      2. 7.11.2. Product/Service Portfolio
      3. 7.11.3. Fortive Corporation Sales, Revenue, and Gross Margin
      4. 7.11.4. Fortive Corporation Revenue and Growth Rate
      5. 7.11.5. Fortive Corporation Market Share
      6. 7.11.6. Recent Initiatives, Funding/VC Activities, and Technological Innovations
    12. 7.12. Nord Drivesystems
      1. 7.12.1. Company Overview
      2. 7.12.2. Product/Service Portfolio
      3. 7.12.3. Nord Drivesystems Sales, Revenue, and Gross Margin
      4. 7.12.4. Nord Drivesystems Revenue and Growth Rate
      5. 7.12.5. Nord Drivesystems Market Share
      6. 7.12.6. Recent Initiatives, Funding/VC Activities, and Technological Innovations
  8. Chapter 8 Food Automation — Industry Analysis
    1. 8.1. Introduction and Taxonomy
    2. 8.2. Food Automation Market – Key Trends
      1. 8.2.1. Market Drivers
      2. 8.2.2. Market Restraints
      3. 8.2.3. Market Opportunities
    3. 8.3. Value Chain Analysis
    4. 8.4. Key Mandates and Regulations
    5. 8.5. Technology Roadmap and Timeline
    6. 8.6. Food Automation Market – Attractiveness Analysis
      1. 8.6.1. By Type
      2. 8.6.2. By Function
      3. 8.6.3. By Application
      4. 8.6.4. By Region
  9. Chapter 9 Industrial Chain, Sourcing Strategy, and Downstream Buyers
    1. 9.1. Food Automation Industrial Chain Analysis
    2. 9.2. Downstream Buyers
    3. 9.3. Distributors/Traders List
  10. Chapter 10 Marketing Strategy Analysis
    1. 10.1. Marketing Channel
    2. 10.2. Direct Marketing
    3. 10.3. Indirect Marketing
    4. 10.4. Marketing Channel Development Trends
    5. 10.5. Economic/Political Environmental Change
  11. Chapter 11 Report Conclusion & Key Insights
    1. 11.1. Key Insights from Primary Interviews & Surveys Respondents
    2. 11.2. Key Takeaways from Analysts, Consultants, and Industry Leaders
  12. Chapter 12 Research Approach & Methodology
    1. 12.1. Report Description
    2. 12.2. Research Scope
    3. 12.3. Research Methodology
      1. 12.3.1. Secondary Research
      2. 12.3.2. Primary Research
      3. 12.3.3. Statistical Models
        1. 12.3.3.1. Company Share Analysis Model
        2. 12.3.3.2. Revenue Based Modeling
      4. 12.3.4. Research Limitations

      List of Figures

      Fig.1	Product Picture of Food Automation
      Fig.2	Global Food Automation Market, 2016 – 2026 (USD Billion)
      Fig.3	Global Food Automation Market Absolute Revenue Opportunity, 2016 – 2026 (USD Billion)
      Fig.4	Global Food Automation Market Incremental Revenue Opportunity, 2020 – 2026 (USD Billion)
      Fig.5	Global Food Automation Market Share, by Type, 2019 & 2026 (USD Billion)
      Fig.6	Global Rotary and Linear Products Food Automation Market, 2016 – 2026 (USD Billion)
      Fig.7	Global Discrete Controller Systems & Visualization Food Automation Market, 2016 – 2026 (USD Billion)
      Fig.8	Global Motor Controls Food Automation Market, 2016 – 2026 (USD Billion)
      Fig.9	Global Motors & Generators Food Automation Market, 2016 – 2026 (USD Billion)
      Fig.10	Global Others Food Automation Market, 2016 – 2026 (USD Billion)
      Fig.11	Global Food Automation Market Share, by Function, 2019 & 2026 (USD Billion)
      Fig.12	Global Sorting & Grading Food Automation Market, 2016 – 2026 (USD Billion)
      Fig.13	Global Packaging & Re-Packaging Food Automation Market, 2016 – 2026 (USD Billion)
      Fig.14	Global Processing Food Automation Market, 2016 – 2026 (USD Billion)
      Fig.15	Global Pickling & Placing Food Automation Market, 2016 – 2026 (USD Billion)
      Fig.16	Global Palletizing Food Automation Market, 2016 – 2026 (USD Billion)
      Fig.17	Global Palletizing Food Automation Market, 2016 – 2026 (USD Billion)
      Fig.18	Global Others Food Automation Market, 2016 – 2026 (USD Billion)
      Fig.19	Global Food Automation Market Share, by Application, 2019 & 2026 (USD Billion)
      Fig.20	Global Beverage Food Automation Market, 2016 – 2026 (USD Billion)
      Fig.21	Global Bakery Food Automation Market, 2016 – 2026 (USD Billion)
      Fig.22	Global Dairy Food Automation Market, 2016 – 2026 (USD Billion)
      Fig.23	Global Fruits & Vegetables Food Automation Market, 2016 – 2026 (USD Billion)
      Fig.24	Global Confectionery Food Automation Market, 2016 – 2026 (USD Billion)
      Fig.25	Global Meat, Poultry & Seafood Food Automation Market, 2016 – 2026 (USD Billion)
      Fig.26	Global Others Food Automation Market, 2016 – 2026 (USD Billion)
      Fig.27	Global Food Automation Market Share, by Region, 2019 & 2026 (USD Billion)
      Fig.28	North America Food Automation Market, 2016 – 2026 (USD Billion)
      Fig.29	U.S. Food Automation Market, 2016 – 2026 (USD Billion)
      Fig.30	Canada Food Automation Market, 2016 – 2026 (USD Billion)
      Fig.31	Europe Food Automation Market, 2016 – 2026 (USD Billion)
      Fig.32	Germany Food Automation Market, 2016 – 2026 (USD Billion)
      Fig.33	France Food Automation Market, 2016 – 2026 (USD Billion)
      Fig.34	U.K. Food Automation Market, 2016 – 2026 (USD Billion)
      Fig.35	Italy Food Automation Market, 2016 – 2026 (USD Billion)
      Fig.36	Spain Food Automation Market, 2016 – 2026 (USD Billion)
      Fig.37	Rest of Europe Food Automation Market, 2016 – 2026 (USD Billion)
      Fig.38	Asia Pacific Food Automation Market, 2016 – 2026 (USD Billion)
      Fig.39	China Food Automation Market, 2016 – 2026 (USD Billion)
      Fig.40	Japan Food Automation Market, 2016 – 2026 (USD Billion)
      Fig.41	India Food Automation Market, 2016 – 2026 (USD Billion)
      Fig.42	South  Korea Food Automation Market, 2016 – 2026 (USD Billion)
      Fig.43	South-East Asia Food Automation Market, 2016 – 2026 (USD Billion)
      Fig.44	Rest of Asia Pacific Food Automation Market, 2016 – 2026 (USD Billion)
      Fig.45	Latin America Food Automation Market, 2016 – 2026 (USD Billion)
      Fig.46	Brazil Food Automation Market, 2016 – 2026 (USD Billion)
      Fig.47	Mexico Food Automation Market, 2016 – 2026 (USD Billion)
      Fig.48	Rest of Latin America Food Automation Market, 2016 – 2026 (USD Billion)
      Fig.49	The Middle-East and Africa Food Automation Market, 2016 – 2026 (USD Billion)
      Fig.50	GCC Countries Food Automation Market, 2016 – 2026 (USD Billion)
      Fig.51	South Africa Food Automation Market, 2016 – 2026 (USD Billion)
      Fig.52	Rest of Middle-East Africa Food Automation Market, 2016 – 2026 (USD Billion)
      Fig.53	Competitor Market Share – Revenue
      Fig.54	Rockwell Automation Inc. Revenue and Growth Rate
      Fig.55	Rockwell Automation Inc. Market Share
      Fig.56	Yokogawa Electric Corporation Revenue and Growth Rate
      Fig.57	Yokogawa Electric Corporation Market Share
      Fig.58	Mitsubishi Electric Corporation Revenue and Growth Rate
      Fig.59	Mitsubishi Electric Corporation Market Share
      Fig.60	Schneider Electric SE Revenue and Growth Rate
      Fig.61	Schneider Electric SE Market Share
      Fig.62	Siemens AG Revenue and Growth Rate
      Fig.63	Siemens AG Market Share
      Fig.64	ABB Ltd Revenue and Growth Rate
      Fig.65	ABB Ltd Market Share
      Fig.66	GEA Group Revenue and Growth Rate
      Fig.67	GEA Group Market Share
      Fig.68	Yaskawa Electric Corporation Revenue and Growth Rate
      Fig.69	Yaskawa Electric Corporation Market Share
      Fig.70	Rexnord Corporation Revenue and Growth Rate
      Fig.71	Rexnord Corporation Market Share
      Fig.72	Emerson Electric Co. Revenue and Growth Rate
      Fig.73	Emerson Electric Co. Market Share
      Fig.74	Fortive Corporation Revenue and Growth Rate
      Fig.75	Fortive Corporation Market Share
      Fig.76	Nord Drivesystems Revenue and Growth Rate
      Fig.77	Nord Drivesystems Market Share
      Fig.78	Market Dynamics
      Fig.79	Global Food Automation – Value Chain Analysis
      Fig.80	Key Mandates and Regulations
      Fig.81	Technology Roadmap and Timeline
      Fig.82	Market Attractiveness Analysis – By Type
      Fig.83	Market Attractiveness Analysis – By Function
      Fig.84	Market Attractiveness Analysis – By Application
      Fig.85	Market Attractiveness Analysis – By Region
      Fig.86	Food Automation Industrial Chain Analysis
      Fig.87	Market Channels
      Fig.88	Marketing Channel Development Trend
      Fig.89	Growth in World Gross Product, 2008-2018
      

      List of Tables

      Table 1	Global Food Automation Market, 2019 & 2026 (USD Billion)
      Table 2	Global Food Automation Market, by Type, 2016 – 2026 (USD Billion)
      Table 3	Global Food Automation Market, by Function, 2016 – 2026 (USD Billion)
      Table 4	Global Food Automation Market, by Application, 2016 – 2026 (USD Billion)
      Table 5	Global Food Automation Market, by Region, 2016 – 2026 (USD Billion)
      Table 6	North America Food Automation Market, by Country, 2016 – 2026 (USD Billion)
      Table 7	North America Food Automation Market, by Type, 2016 – 2026 (USD Billion)
      Table 8	North America Food Automation Market, by Function, 2016 – 2026 (USD Billion)
      Table 9	North America Food Automation Market, by Application, 2016 – 2026 (USD Billion)
      Table 10 Europe Food Automation Market, by Country, 2016 – 2026 (USD Billion)
      Table 11 Europe Food Automation Market, by Type, 2016 – 2026 (USD Billion)
      Table 12 Europe Food Automation Market, by Function, 2016 – 2026 (USD Billion)
      Table 13 Europe Food Automation Market, by Application, 2016 – 2026 (USD Billion)
      Table 14 Asia Pacific Food Automation Market, by Country, 2016 – 2026 (USD Billion)
      Table 15 Asia Pacific Food Automation Market, by Type, 2016 – 2026 (USD Billion)
      Table 16 Asia Pacific Food Automation Market, by Function, 2016 – 2026 (USD Billion)
      Table 17 Asia Pacific Food Automation Market, by Application, 2016 – 2026 (USD Billion)
      Table 18 Latin America Food Automation Market, by Country, 2016 – 2026 (USD Billion)
      Table 19 Latin America Food Automation Market, by Type, 2016 – 2026 (USD Billion)
      Table 20 Latin America Food Automation Market, by Function, 2016 – 2026 (USD Billion)
      Table 21 Latin America Food Automation Market, by Application, 2016 – 2026 (USD Billion)
      Table 22 The Middle-East and Africa Food Automation Market, by Country, 2016 – 2026 (USD Billion)
      Table 23 The Middle-East and Africa Food Automation Market, by Type, 2016 – 2026 (USD Billion)
      Table 24 The Middle-East and Africa Food Automation Market, by Function, 2016 – 2026 (USD Billion)
      Table 25 The Middle-East and Africa Food Automation Market, by Application, 2016 – 2026 (USD Billion)
      Table 26 Global Food Automation Market - Company Revenue Analysis, 2016 – 2019 (USD Billion)
      Table 27 Global Food Automation Market - Company Revenue Share Analysis, 2016 – 2019 (%)
      Table 28 Acquisitions and Mergers
      Table 29 Market Drivers – Impact Analysis
      Table 30 Market Restraints
      Table 31 Market Opportunities
      Table 32 Major Buyers of Food Automation
      Table 33 Distributors/Traders of Food Automation by Region
      

Industry Major Market Players

  • Rockwell Automation Inc.
  • Yokogawa Electric Corporation
  • Mitsubishi Electric Corporation
  • Schneider Electric SE
  • Siemens AG
  • ABB Ltd
  • GEA Group
  • Yaskawa Electric Corporation
  • Rexnord Corporation
  • Emerson Electric Co.
  • Fortive Corporation
  • Nord Drivesystems.