Search Market Research Report

Discover Our Latest Reports
Discover Our Featured Reports
Discover Top Selling Reports

Foldable Display Market Size, Share Global Analysis Report, 2020–2026

report img

Foldable Display Market By Technology (LED, OLED, and AMOLED), and By Application (Smartphone & Tablets, Laptops, and Others):Global Industry Outlook, Market Size, Business Intelligence, Consumer Preferences, Statistical Surveys, Comprehensive Analysis, Historical Developments, Current Trends, and Forecast 2020–2026

Industry Insights

Foldable Display Market

To know more about this report | Request Free Sample Copy

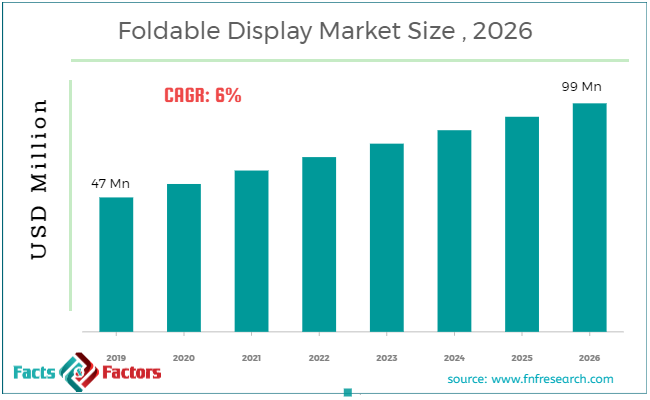
According to the report published by Facts & Factors, the global Foldable Display Market size was worth around USD 47 million in 2019 and is predicted to grow around USD 99 million by 2026 with a compound annual growth rate (CAGR) of roughly 6% between 2020 and 2026. The report analyzes the global Foldable Display Market drivers, restraints/challenges, and the effect they have on the demands during the projection period. In addition, the report explores emerging opportunities in the Foldable Display Market.

This specialized and expertise oriented industry research report scrutinizes the technical and commercial business outlook of the foldable display industry. The report analyzes and declares the historical and current trends analysis of the foldable display industry and subsequently recommends the projected trends anticipated to be observed in the foldable display market during the upcoming years.

The foldable display market report analyzes and notifies the industry statistics at the global as well as regional and country levels in order to acquire a thorough perspective of the entire foldable display market. The historical and past insights are provided for FY 2016 to FY 2019 whereas projected trends are delivered for FY 2020 to FY 2026. The quantitative and numerical data is represented in terms of both volume (Units) and value (USD Million) from FY 2016 – 2026.

logoKey Insights from Primary Research

  • According to the primary researcher operating in the global foldable display market, the market was valued at USD 47 million and is expected to be valued over USD 99 million.
  • Due to the increasing consumer interest, the foldable display market is predicted to witness a significant growth of nearly 6% during 2020-2026.
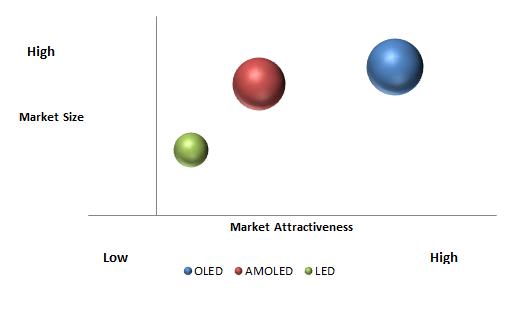
  • By technology analysis, the OLED segment-headed the market in 2019 and it is expected to grow over the forecast period owing to the features offered by OLED such as better picture quality, effective lightning, etc.
  • By application analysis, the smartphone & tablets segment-dominated the market and it is expected to increase in the future years.
  • By geography, North America is the fastest-growing region due to the adoption of digitization and the manufacturing of innovative products in this region.

logoKey Recommendations from Analysts

  • Our analysts recommend that the Asia Pacific is expected to be the fastest-growing market for foldable display during the years to come attributed to low operational cost and improvement in the technological activities.
  • The European region is projected to provide considerable growth opportunities owing to the continuous development in the technologies in this region.
  • Due to the features offered by AMOLED such as high contrast ratio, overall display quality, the AMOLED segment is expected to boost market growth during the forthcoming years.
  • Owing to the increasing demands for laptops compacted with foldable display technology, this segment is anticipated to offer lucrative opportunities in the future years.
  • Adoption of the innovative technologies, increasing per capita income and increasing consumer demand for innovative electronics devices, the foldable display market anticipated offering lucrative opportunities in the upcoming years.

logoMarket Attractiveness By Application Analysis

Foldable Display Market

To know more about this report | Request Free Sample Copy

The quantitative data is further underlined and reinforced by comprehensive qualitative data which comprises various across-the-board market dynamics. The rationales which directly or indirectly impact the Foldable Display industry are exemplified through parameters such as growth drivers, restraints, challenges, and opportunities among other impacting factors.

Throughout our research report, we have encompassed all the proven models and tools of industry analysis and extensively illustrated all the key business strategies and business models adopted in the foldable display industry. The report provides an all-inclusive and detailed competitive landscape prevalent in the Foldable Display market.

The report utilizes established industry analysis tools and models such as Porter’s Five Forces framework to analyze and recognize critical business strategies adopted by various stakeholders involved in the entire value chain of the Foldable Display industry. The foldable display market report additionally employs SWOT analysis and PESTLE analysis models for further in-depth analysis.

The report study further includes an in-depth analysis of industry players' market shares and provides an overview of leading players' market position in the foldable display sector. Key strategic developments in the Foldable Display market competitive landscape such as acquisitions & mergers, inaugurations of different products and services, partnerships & joint ventures, MoU agreements, VC & funding activities, R&D activities, and geographic expansion among other noteworthy activities by key players of the foldable display market are appropriately highlighted in the report.

The foldable device is an electronic visual display with high flexibility. With emerging technology, the foldable displays are likely to revolutionize the semiconductor and electronics industry. Foldable displays are based on screens that are flexibly spinning, flipping and folding as paper according to their specific application. Increasing interest in consumer electronics such as an e-reader, mobile phones, etc., this technology is expected to generate potential market growth.

Increasing per capita income, and consumer interest towards innovative electronics, the major manufacturers are providing new technology in the electronics industry.OLED technology in integration with foldable displays & screens is gaining high popularity among manufacturers of electronic devices due to its improved image quality and efficient lighting benefits, versatility, etc. Compared with traditional cameras, the use of OLEDs in smartphones offers features that are smaller, lighter and durable. However, the high cost and technical drawbacks associated with electronic devices may impede market growth. On the other hand, major companies are offering innovative strategies, in order to provide a better experience to the consumer, this may create attractive opportunities in the market.

The foldable display market research report delivers an acute valuation and taxonomy of the Foldable Display industry by practically splitting the market on the basis of different types, applications, and regions. Through the analysis of the historical and projected trends, all the segments and sub-segments were evaluated through the bottom-up approach, and different market sizes have been projected for FY 2020 to FY 2026. The regional segmentation of the Foldable Display industry includes the complete classification of all the major continents including North America, Latin America, Europe, Asia Pacific, and Middle East & Africa. Further, country-wise data for the foldable display industry is provided for the leading economies of the world.

The foldable display market is segmented based on technology and application.  On the basis of type segmentation, the market is classified into LED, OLED, and AMOLED. In terms of application segmentation, the market is bifurcated into smartphones & tablets, laptops, and others.

logoReport Scope

Report Attribute

Details

Market Size in 2019

USD 47 Million

Projected Market Size in 2026

USD 99 Million

CAGR Growth Rate

6% CAGR

Base Year

2019

Forecast Years

2020-2026

Key Market Players

Sumitomo Chemical,  AP Systems, Asahi Glass,  C3 Nano, Fuji Film,  Royole Corporation, Kaneka,  3M,  BOE Technology,  LG Display,  Samsung Display,  Tianma, Ube Industries,  Semiconductor Energy Laboratory (SEL), Applied Materials,  and others.

Key Segment

By Type, Application, and Region

Major Regions Covered

North America, Europe, Asia Pacific, Latin America, and the Middle East &, Africa

Purchase Options

Request customized purchase options to meet your research needs. Explore purchase options

logoCompetitive Players

Some of the essential players operating in the Foldable Display market, but not restricted to include :

  •  Sumitomo Chemical
  •  AP Systems
  •  Asahi Glass
  •  C3 Nano
  •  Fuji Film
  •  Royole Corporation
  •  Kaneka
  •  3M
  •  BOE Technology
  •  LG Display
  •  Samsung Display
  •  Tianma
  •  Ube Industries
  •  Semiconductor Energy Laboratory (SEL)
  •  Applied Materials

The taxonomy of the foldable display industry by its scope and segmentation is as follows:

logo By Type Segmentation Analysis

  • LED
  • OLED
  • AMOLED

logo By Application Segmentation Analysis

  • Smartphone & Tablets
  • Laptops
  • Others

logo Regional Segmentation Analysis

  • North America
    • The U.S.
    • Canada
  • Europe
    • Germany
    • The UK
    • France
    • Spain
    • Italy
    • Rest of Europe
  • Asia Pacific
    • China
    • Japan
    • India
    • South Korea
    • Southeast Asia
    • Rest of Asia Pacific
  • Latin America
    • Brazil
    • Mexico
    • Rest of Latin America
  • Middle East & Africa
    • GCC
    • South Africa
    • Rest of Middle East & Africa

Table of Content

  1. CHAPTER 1. Executive Summary
  2. CHAPTER 2. Foldable Display market – Technology Analysis
    1. 2.1. Global Foldable Display Market – Technology Overview
    2. 2.2. Global Foldable Display Market Share, by Technology, 2019&2026 (USD Million)
    3. 2.3. Global Foldable Display Market share, by Technology, 2019&2026 (Units)
    4. 2.4. LED
      1. 2.4.1. Global LED Foldable Display Market, 2016-2026 (USD Million)
      2. 2.4.2. Global LED Foldable Display Market, 2016-2026 (Units)
    5. 2.5. OLED
      1. 2.5.1. Global OLED Foldable Display Market, 2016-2026 (USD Million)
      2. 2.5.2. Global OLED Foldable Display Market, 2016-2026 (Units)
    6. 2.6. AMOLED
      1. 2.6.1. Global AMOLED Foldable Display Market, 2016-2026 (USD Million)
      2. 2.6.2. Global AMOLED Foldable Display Market, 2016-2026 (Units)
  3. CHAPTER 3. Foldable Display market – Application Analysis
    1. 3.1. Global Foldable Display Market – Application Overview
    2. 3.2. Global Foldable Display Market Share, by Application, 2019&2026 (USD Million)
    3. 3.3. Global Foldable Display Market share, by Application, 2019&2026 (Units)
    4. 3.4. Smartphone & Tablets
      1. 3.4.1. Global Smartphone & Tablets Foldable Display Market, 2016-2026 (USD Million)
      2. 3.4.2. Global Smartphone & Tablets Foldable Display Market, 2016-2026 (Units)
    5. 3.5. Laptops
      1. 3.5.1. Global Laptops Foldable Display Market, 2016-2026 (USD Million)
      2. 3.5.2. Global Laptops Foldable Display Market, 2016-2026 (Units)
    6. 3.6. Others
      1. 3.6.1. Global Others Foldable Display Market, 2016-2026 (USD Million)
      2. 3.6.2. Global Others Foldable Display Market, 2016-2026 (Units)
  4. CHAPTER 4. Foldable Display market – Regional Analysis
    1. 4.1. Global Foldable Display Market Regional Overview
    2. 4.2. Global Foldable Display Market Share, by Region, 2019&2026 (Value)
    3. 4.3. Global Foldable Display Market Share, by Region, 2019&2026 (Volume)
    4. 4.4. North America
      1. 4.4.1. North America Foldable Display Market size and forecast, 2016-2026
      2. 4.4.2. North America Foldable Display Market, by Country, 2019 - 2026 (USD Million)
      3. 4.4.3. North America Market size and forecast, 2016-2026 (Units)
      4. 4.4.4. North America Foldable Display Market, by Country, 2019 - 2026 (Units)
      5. 4.4.5. North America Foldable Display Market, by Technology, 2016-2026
        1. 4.4.5.1. North America Foldable Display Market, by Technology, 2016-2026 (USD Million)
        2. 4.4.5.2. North America Foldable Display Market, by Technology, 2016-2026 (Units)
      6. 4.4.6. North America Foldable Display Market, by Application, 2016-2026
        1. 4.4.6.1. North America Foldable Display Market, by Application, 2016-2026 (USD Million)
        2. 4.4.6.2. North America Foldable Display Market, by Application, 2016-2026 (Units)
      7. 4.4.7. U.S.
        1. 4.4.7.1. U.S. Market size and forecast, 2016-2026 (USD Million)
        2. 4.4.7.2. U.S. Market size and forecast, 2016-2026 (Units)
      8. 4.4.8. Canada
        1. 4.4.8.1. Canada Market size and forecast, 2016-2026 (USD Million)
        2. 4.4.8.2. Canada Market size and forecast, 2016-2026 (Units)
    5. 4.5. Europe
      1. 4.5.1. Europe Foldable Display Market size and forecast, 2016-2026
      2. 4.5.2. Europe Foldable Display Market, by Country, 2019 - 2026 (USD Million)
      3. 4.5.3. Europe Market size and forecast, 2016-2026 (Units)
      4. 4.5.4. Europe Foldable Display Market, by Country, 2019 - 2026 (Units)
      5. 4.5.5. Europe Foldable Display Market, by Technology, 2016-2026
        1. 4.5.5.1. Europe Foldable Display Market, by Technology, 2016-2026 (USD Million)
        2. 4.5.5.2. Europe Foldable Display Market, by Technology, 2016-2026 (Units)
      6. 4.5.6. Europe Foldable Display Market, by Application, 2016-2026
        1. 4.5.6.1. Europe Foldable Display Market, by Application, 2016-2026 (USD Million)
        2. 4.5.6.2. Europe Foldable Display Market, by Application, 2016-2026 (Units)
      7. 4.5.7. Germany
        1. 4.5.7.1. Germany Market size and forecast, 2016-2026 (USD Million)
        2. 4.5.7.2. Germany Market size and forecast, 2016-2026 (Units)
      8. 4.5.8. France
        1. 4.5.8.1. France Market size and forecast, 2016-2026 (USD Million)
        2. 4.5.8.2. France Market size and forecast, 2016-2026 (Units)
      9. 4.5.9. U.K.
        1. 4.5.9.1. U.K. Market size and forecast, 2016-2026 (USD Million)
        2. 4.5.9.2. U.K. Market size and forecast, 2016-2026 (Units)
      10. 4.5.10. Italy
        1. 4.5.10.1. Italy Market size and forecast, 2016-2026 (USD Million)
        2. 4.5.10.2. Italy Market size and forecast, 2016-2026 (Units)
      11. 4.5.11. Spain
        1. 4.5.11.1. Spain Market size and forecast, 2016-2026 (USD Million)
        2. 4.5.11.2. Spain Market size and forecast, 2016-2026 (Units)
      12. 4.5.12. Rest of Europe
        1. 4.5.12.1. Rest of Europe Market size and forecast, 2016-2026 (USD Million)
        2. 4.5.12.2. Rest of Europe Market size and forecast, 2016-2026 (Units)
    6. 4.6. Asia Pacific
      1. 4.6.1. Asia Pacific Foldable Display Market size and forecast, 2016-2026
      2. 4.6.2. Asia Pacific Foldable Display Market, by Country, 2019 - 2026 (USD Million)
      3. 4.6.3. Asia Pacific Market size and forecast, 2016-2026 (Units)
      4. 4.6.4. Asia Pacific Foldable Display Market, by Country, 2019 - 2026 (Units)
      5. 4.6.5. Asia Pacific Foldable Display Market, by Technology, 2016-2026
        1. 4.6.5.1. Asia Pacific Foldable Display Market, by Technology, 2016-2026 (USD Million)
        2. 4.6.5.2. Asia Pacific Foldable Display Market, by Technology, 2016-2026 (Units)
      6. 4.6.6. Asia Pacific Foldable Display Market, by Application, 2016-2026
        1. 4.6.6.1. Asia Pacific Foldable Display Market, by Application, 2016-2026 (USD Million)
        2. 4.6.6.2. Asia Pacific Foldable Display Market, by Application, 2016-2026 (Units)
      7. 4.6.7. China
        1. 4.6.7.1. China Market size and forecast, 2016-2026 (USD Million)
        2. 4.6.7.2. China Market size and forecast, 2016-2026 (Units)
      8. 4.6.8. Japan
        1. 4.6.8.1. Japan Market size and forecast, 2016-2026 (USD Million)
        2. 4.6.8.2. Japan Market size and forecast, 2016-2026 (Units)
      9. 4.6.9. India
        1. 4.6.9.1. India Market size and forecast, 2016-2026 (USD Million)
        2. 4.6.9.2. India Market size and forecast, 2016-2026 (Units)
      10. 4.6.10. South Korea
        1. 4.6.10.1. South Korea Market size and forecast, 2016-2026 (USD Million)
        2. 4.6.10.2. South Korea Market size and forecast, 2016-2026 (Units)
      11. 4.6.11. South-East Asia
        1. 4.6.11.1. South-East Asia Market size and forecast, 2016-2026 (USD Million)
        2. 4.6.11.2. South-East Asia Market size and forecast, 2016-2026 (Units)
      12. 4.6.12. Rest of Asia Pacific
        1. 4.6.12.1. Rest of Asia Pacific Market size and forecast, 2016-2026 (USD Million)
        2. 4.6.12.2. Rest of Asia Pacific Market size and forecast, 2016-2026 (Units)
    7. 4.7. Latin America
      1. 4.7.1. Latin America Foldable Display Market size and forecast, 2016-2026
      2. 4.7.2. Latin America Foldable Display Market, by Country, 2019 - 2026 (USD Million)
      3. 4.7.3. Latin America Market size and forecast, 2016-2026 (Units)
      4. 4.7.4. Latin America Foldable Display Market, by Country, 2019 - 2026 (Units)
      5. 4.7.5. Latin America Foldable Display Market, by Technology, 2016-2026
        1. 4.7.5.1. Latin America Foldable Display Market, by Technology, 2016-2026 (USD Million)
        2. 4.7.5.2. Latin America Foldable Display Market, by Technology, 2016-2026 (Units)
      6. 4.7.6. Latin America Foldable Display Market, by Application, 2016-2026
        1. 4.7.6.1. Latin America Foldable Display Market, by Application, 2016-2026 (USD Million)
        2. 4.7.6.2. Latin America Foldable Display Market, by Application, 2016-2026 (Units)
      7. 4.7.7. Brazil
        1. 4.7.7.1. Brazil Market size and forecast, 2016-2026 (USD Million)
        2. 4.7.7.2. Brazil Market size and forecast, 2016-2026 (Units)
      8. 4.7.8. Mexico
        1. 4.7.8.1. Mexico Market size and forecast, 2016-2026 (USD Million)
        2. 4.7.8.2. Mexico Market size and forecast, 2016-2026 (Units)
      9. 4.7.9. Rest of Latin America
        1. 4.7.9.1. Rest of Latin America Market size and forecast, 2016-2026 (USD Million)
        2. 4.7.9.2. Rest of Latin America Market size and forecast, 2016-2026 (Units)
    8. 4.8. The Middle-East and Africa
      1. 4.8.1. The Middle-East and Africa Foldable Display Market size and forecast, 2016-2026
      2. 4.8.2. The Middle-East and Africa Foldable Display Market, by Country, 2019 - 2026 (USD Million)
      3. 4.8.3. The Middle-East and Africa Market size and forecast, 2016-2026 (Units)
      4. 4.8.4. The Middle-East and Africa Foldable Display Market, by Country, 2019 - 2026 (Units)
      5. 4.8.5. The Middle-East and Africa Foldable Display Market, by Technology, 2016-2026
        1. 4.8.5.1. The Middle-East and Africa Foldable Display Market, by Technology, 2016-2026 (USD Million)
        2. 4.8.5.2. The Middle-East and Africa Foldable Display Market, by Technology, 2016-2026 (Units)
      6. 4.8.6. The Middle-East and Africa Foldable Display Market, by Application, 2016-2026
        1. 4.8.6.1. The Middle-East and Africa Foldable Display Market, by Application, 2016-2026 (USD Million)
        2. 4.8.6.2. The Middle-East and Africa Foldable Display Market, by Application, 2016-2026 (Units)
      7. 4.8.7. GCC Countries
        1. 4.8.7.1. GCC Countries Market size and forecast, 2016-2026 (USD Million)
        2. 4.8.7.2. GCC Countries Market size and forecast, 2016-2026 (Units)
      8. 4.8.8. South Africa
        1. 4.8.8.1. South Africa Market size and forecast, 2016-2026 (USD Million)
        2. 4.8.8.2. South Africa Market size and forecast, 2016-2026 (Units)
      9. 4.8.9. Rest of Middle-East Africa
        1. 4.8.9.1. Rest of Middle-East Africa Market size and forecast, 2016-2026 (USD Million)
        2. 4.8.9.2. Rest of Middle-East Africa Market size and forecast, 2016-2026 (Units)
  5. CHAPTER 5. Foldable Display Production, Consumption, Export, Import by Regions
    1. 5.1. Global Foldable Display production and revenue, 2016-2026 (USD Million) (Units)
    2. 5.2. Global Import and Export Analysis, by Region
  6. CHAPTER 6. Foldable Display market – Competitive Landscape
    1. 6.1. Competitor Market Share – Revenue
    2. 6.2. Market Concentration Rate Analysis, Top 3 and Top 5 Players
    3. 6.3. Competitor Market Share – Volume
    4. 6.4. Strategic Development
      1. 6.4.1. Acquisitions and Mergers
      2. 6.4.2. New Products
      3. 6.4.3. Research & Development Activities
  7. CHAPTER 7. Company Profiles
    1. 7.1. 3M
      1. 7.1.1. Company Overview
      2. 7.1.2. 3M Sales, Revenue, Price, and Gross Margin
      3. 7.1.3. Product portfolio
      4. 7.1.4. Recent initiatives
    2. 7.2. Applied Materials
      1. 7.2.1. Company Overview
      2. 7.2.2. Applied Materials Sales, Revenue, Price, and Gross Margin
      3. 7.2.3. Product portfolio
      4. 7.2.4. Recent initiatives
    3. 7.3. AP Systems
      1. 7.3.1. Company Overview
      2. 7.3.2. AP Systems Sales, Revenue, Price, and Gross Margin
      3. 7.3.3. Product portfolio
      4. 7.3.4. Recent initiatives
    4. 7.4. Asahi Glass
      1. 7.4.1. Company Overview
      2. 7.4.2. Asahi Glass Sales, Revenue, Price, and Gross Margin
      3. 7.4.3. Product portfolio
      4. 7.4.4. Recent initiatives
    5. 7.5. C3 Nano
      1. 7.5.1. Company Overview
      2. 7.5.2. C3 Nano Sales, Revenue, Price, and Gross Margin
      3. 7.5.3. Product portfolio
      4. 7.5.4. Recent initiatives
    6. 7.6. Fuji Film
      1. 7.6.1. Company Overview
      2. 7.6.2. Fuji Film Sales, Revenue, Price, and Gross Margin
      3. 7.6.3. Product portfolio
      4. 7.6.4. Recent initiatives
    7. 7.7. Kaneka
      1. 7.7.1. Company Overview
      2. 7.7.2. Kaneka Sales, Revenue, Price, and Gross Margin
      3. 7.7.3. Product portfolio
      4. 7.7.4. Recent initiatives
    8. 7.8. Sumitomo Chemical
      1. 7.8.1. Company Overview
      2. 7.8.2. Sumitomo Chemical Sales, Revenue, Price, and Gross Margin
      3. 7.8.3. Product portfolio
      4. 7.8.4. Recent initiatives
    9. 7.9. Ube Industries
      1. 7.9.1. Company Overview
      2. 7.9.2. Ube Industries Sales, Revenue, Price, and Gross Margin
      3. 7.9.3. Product portfolio
      4. 7.9.4. Recent initiatives
    10. 7.10. BOE Technology
      1. 7.10.1. Company Overview
      2. 7.10.2. BOE Technology Sales, Revenue, Price, and Gross Margin
      3. 7.10.3. Product portfolio
      4. 7.10.4. Recent initiatives
    11. 7.11. LG Display
      1. 7.11.1. Company Overview
      2. 7.11.2. LG Display Sales, Revenue, Price, and Gross Margin
      3. 7.11.3. Product portfolio
      4. 7.11.4. Recent initiatives
    12. 7.12. Royole Corporation
      1. 7.12.1. Company Overview
      2. 7.12.2. Royole Corporation Sales, Revenue, Price, and Gross Margin
      3. 7.12.3. Product portfolio
      4. 7.12.4. Recent initiatives
    13. 7.13. Samsung Display
      1. 7.13.1. Company Overview
      2. 7.13.2. Samsung Display Sales, Revenue, Price, and Gross Margin
      3. 7.13.3. Product portfolio
      4. 7.13.4. Recent initiatives
    14. 7.14. Semiconductor Energy Laboratory (SEL)
      1. 7.14.1. Company Overview
      2. 7.14.2. Semiconductor Energy Laboratory (SEL) Sales, Revenue, Price, and Gross Margin
      3. 7.14.3. Product portfolio
      4. 7.14.4. Recent initiatives
    15. 7.15. Tianma
      1. 7.15.1. Company Overview
      2. 7.15.2. Tianma Sales, Revenue, Price, and Gross Margin
      3. 7.15.3. Product portfolio
      4. 7.15.4. Recent initiatives
  8. CHAPTER 8. Foldable Display — Industry Analysis
    1. 8.1. Introduction and Taxonomy
    2. 8.2. Foldable Display Market – Key Trends
      1. 8.2.1. Market Drivers
      2. 8.2.2. Market Restraints
      3. 8.2.3. Market Opportunities
    3. 8.3. Value Chain Analysis
    4. 8.4. Key Mandates and Regulations
    5. 8.5. Technology Roadmap and Timeline
    6. 8.6. Foldable Display market – Attractiveness Analysis
      1. 8.6.1. By Technology
      2. 8.6.2. By Application
      3. 8.6.3. By Region
  9. CHAPTER 9. Raw Material analysis
    1. 9.1. Foldable Display Key Raw Material Analysis
      1. 9.1.1. Key Raw Materials
      2. 9.1.2. Price Trend of Key Raw Materials
    2. 9.2. Key Suppliers of Raw Materials
    3. 9.3. Proportion of Manufacturing Cost Structure
      1. 9.3.1. Raw Materials
      2. 9.3.2. Labor Cost
    4. 9.4. Manufacturing Expenses Analysis of Foldable Display
  10. CHAPTER 10. Industrial Chain, Sourcing Strategy and Downstream Buyers
    1. 10.1. Foldable Display Industrial Chain Analysis
    2. 10.2. Upstream Raw Materials Sourcing
      1. 10.2.1. Risk Mitigation:
      2. 10.2.2. Supplier Relationships:
      3. 10.2.3. Business Processes:
      4. 10.2.4. Securing the Product:
    3. 10.3. Raw Materials Sources of Foldable Display Major Manufacturers in 2016
    4. 10.4. Downstream Buyers
    5. 10.5. Distributors/Traders List
  11. CHAPTER 11. Marketing Strategy Analysis, Distributors
    1. 11.1. Marketing Channel
    2. 11.2. Direct Marketing
    3. 11.3. Indirect Marketing
    4. 11.4. Marketing Channel Development Trend
    5. 11.5. Economic/Political Environmental Change
  12. CHAPTER 12. Report Conclusion
  13. CHAPTER 13. Research Approach & Methodology
    1. 13.1. Report Description
    2. 13.2. Research Scope
    3. 13.3. Research Methodology
      1. 13.3.1. Secondary Research
      2. 13.3.2. Primary Research
      3. 13.3.3. Models
        1. 13.3.3.1. Company Share Analysis Model
        2. 13.3.3.2. Revenue Based Modeling
        3. 13.3.3.3. Research Limitations

        List of Figures

        FIG. 1 Global Foldable Display Market, 2016-2026 (USD Million)
        FIG. 2 Global Foldable Display Market Share, by Technology, 2019&2026 (USD Million)
        FIG. 3 Global Foldable Display Market share, by Technology, 2019&2026 (Units)
        FIG. 4 Global LED Foldable Display Market, 2016-2026 (USD Million)
        FIG. 5 Global LED Foldable Display  Market, 2016-2026 (Units)
        FIG. 6 Global OLED Foldable Display Market, 2016-2026 (USD Million)
        FIG. 7 Global OLED Foldable Display  Market, 2016-2026 (Units)
        FIG. 8 Global AMOLED Foldable Display Market, 2016-2026 (USD Million)
        FIG. 9 Global AMOLED Foldable Display  Market, 2016-2026 (Units)
        FIG. 10 Global Foldable Display Market Share, by Application, 2019&2026 (USD Million)
        FIG. 11 Global Foldable Display Market share, by Application, 2019&2026 (Units)
        FIG. 12 Global Smartphone & Tablets Foldable Display Market, 2016-2026 (USD Million)
        FIG. 13 Global Smartphone & Tablets Foldable Display  Market, 2016-2026 (Units)
        FIG. 14 Global Laptops Foldable Display Market, 2016-2026 (USD Million)
        FIG. 15 Global Laptops Foldable Display  Market, 2016-2026 (Units)
        FIG. 16 Global Others Foldable Display Market, 2016-2026 (USD Million)
        FIG. 17 Global Others Foldable Display  Market, 2016-2026 (Units)
        FIG. 18 Global Foldable Display Market Share, by Region, 2019&2026
        FIG. 19 Global Foldable Display Market Share, by Region, 2019&2026
        FIG. 20 North America Foldable Display Market, 2016-2026
        FIG. 21 North America Foldable Display  Market, 2016-2026 (Units)
        FIG. 22 U.S. Foldable Display Market, 2016-2026
        FIG. 23 U.S. Foldable Display  Market, 2016-2026 (Units)
        FIG. 24 Canada Foldable Display Market, 2016-2026
        FIG. 25 Canada Foldable Display  Market, 2016-2026 (Units)
        FIG. 26 Europe Foldable Display Market, 2016-2026
        FIG. 27 Europe Foldable Display  Market, 2016-2026 (Units)
        FIG. 28 Germany Foldable Display Market, 2016-2026
        FIG. 29 Germany Foldable Display  Market, 2016-2026 (Units)
        FIG. 30 France Foldable Display Market, 2016-2026
        FIG. 31 France Foldable Display  Market, 2016-2026 (Units)
        FIG. 32 U.K. Foldable Display Market, 2016-2026
        FIG. 33 U.K. Foldable Display  Market, 2016-2026 (Units)
        FIG. 34 Italy Foldable Display Market, 2016-2026
        FIG. 35 Italy Foldable Display  Market, 2016-2026 (Units)
        FIG. 36 Spain Foldable Display Market, 2016-2026
        FIG. 37 Spain Foldable Display  Market, 2016-2026 (Units)
        FIG. 38 Rest of Europe Foldable Display Market, 2016-2026
        FIG. 39 Rest of Europe Foldable Display  Market, 2016-2026 (Units)
        FIG. 40 Asia Pacific Foldable Display Market, 2016-2026
        FIG. 41 Asia Pacific Foldable Display  Market, 2016-2026 (Units)
        FIG. 42 China Foldable Display Market, 2016-2026
        FIG. 43 China Foldable Display  Market, 2016-2026 (Units)
        FIG. 44 Japan Foldable Display Market, 2016-2026
        FIG. 45 Japan Foldable Display  Market, 2016-2026 (Units)
        FIG. 46 India Foldable Display Market, 2016-2026
        FIG. 47 India Foldable Display  Market, 2016-2026 (Units)
        FIG. 48 South  Korea Foldable Display Market, 2016-2026
        FIG. 49 South  Korea Foldable Display  Market, 2016-2026 (Units)
        FIG. 50 South-East Asia Foldable Display Market, 2016-2026
        FIG. 51 South-East Asia Foldable Display  Market, 2016-2026 (Units)
        FIG. 52 Rest of Asia Pacific Foldable Display Market, 2016-2026
        FIG. 53 Rest of Asia Pacific Foldable Display  Market, 2016-2026 (Units)
        FIG. 54 Latin America Foldable Display Market, 2016-2026
        FIG. 55 Latin America Foldable Display  Market, 2016-2026 (Units)
        FIG. 56 Brazil Foldable Display Market, 2016-2026
        FIG. 57 Brazil Foldable Display  Market, 2016-2026 (Units)
        FIG. 58 Mexico Foldable Display Market, 2016-2026
        FIG. 59 Mexico Foldable Display  Market, 2016-2026 (Units)
        FIG. 60 Rest of Latin America Foldable Display Market, 2016-2026
        FIG. 61 Rest of Latin America Foldable Display  Market, 2016-2026 (Units)
        FIG. 62 The Middle-East and Africa Foldable Display Market, 2016-2026
        FIG. 63 The Middle-East and Africa Foldable Display  Market, 2016-2026 (Units)
        FIG. 64 GCC Countries Foldable Display Market, 2016-2026
        FIG. 65 GCC Countries Foldable Display  Market, 2016-2026 (Units)
        FIG. 66 South Africa Foldable Display Market, 2016-2026
        FIG. 67 South Africa Foldable Display  Market, 2016-2026 (Units)
        FIG. 68 Rest of Middle-East Africa Foldable Display Market, 2016-2026
        FIG. 69 Rest of Middle-East Africa Foldable Display  Market, 2016-2026 (Units)
        FIG. 70 Global Foldable Display production and revenue, 2016-2026 (USD Million) (Units)
        FIG. 71 North America Foldable Display production and revenue, 2016-2026 (USD Million) (Units)
        FIG. 72 Europe Foldable Display production and revenue, 2016-2026 (USD Million) (Units)
        FIG. 73 Asia Pacific Foldable Display production and revenue, 2016-2026 (USD Million) (Units)
        FIG. 74 Latin America Foldable Display production and revenue, 2016-2026 (USD Million) (Units)
        FIG. 75 Middle East and Africa Foldable Display production and revenue, 2016-2026 (USD Million) (Units)
        FIG. 76 Competitor Market Share – Revenue
        FIG. 77 Competitor Market Share – Volume
        FIG. 78 3M Revenue and Growth Rate
        FIG. 79 3M Market Share
        FIG. 80 Applied Materials Revenue and Growth Rate
        FIG. 81 Applied Materials Market Share
        FIG. 82 AP Systems Revenue and Growth Rate
        FIG. 83 AP Systems Market Share
        FIG. 84 Asahi Glass Revenue and Growth Rate
        FIG. 85 Asahi Glass Market Share
        FIG. 86 C3 Nano Revenue and Growth Rate
        FIG. 87 C3 Nano Market Share
        FIG. 88 Fuji Film Revenue and Growth Rate
        FIG. 89 Fuji Film Market Share
        FIG. 90 Kaneka Revenue and Growth Rate
        FIG. 91 Kaneka Market Share
        FIG. 92 Sumitomo Chemical Revenue and Growth Rate
        FIG. 93 Sumitomo Chemical Market Share
        FIG. 94 Ube Industries Revenue and Growth Rate
        FIG. 95 Ube Industries Market Share
        FIG. 96 BOE Technology Revenue and Growth Rate
        FIG. 97 BOE Technology Market Share
        FIG. 98 LG Display Revenue and Growth Rate
        FIG. 99 LG Display Market Share
        FIG. 100 Royole Corporation Revenue and Growth Rate
        FIG. 101 Royole Corporation Market Share
        FIG. 102 Samsung Display Revenue and Growth Rate
        FIG. 103 Samsung Display Market Share
        FIG. 104 Semiconductor Energy Laboratory (SEL) Revenue and Growth Rate
        FIG. 105 Semiconductor Energy Laboratory (SEL) Market Share
        FIG. 106 Tianma Revenue and Growth Rate
        FIG. 107 Tianma Market Share
        FIG. 108 Market Dynamics
        FIG. 109 Global Foldable Display – Value Chain Analysis
        FIG. 110 Key Mandates and Regulations
        FIG. 111 Technology Roadmap and Timeline
        FIG. 112 Market Attractiveness Analysis – By Technology
        FIG. 113 Market Attractiveness Analysis – By Application
        FIG. 114 Market Attractiveness Analysis – By Region
        FIG. 115 Manufacturing Cost Structure of Foldable Display
        FIG. 116 Foldable Display Industrial Chain Analysis
        FIG. 117 Market Channel
        FIG. 118 Marketing Channel Development Trend
        FIG. 119 Growth in World Gross Product, 2008-2019

        List of Tables

        TABLE 1 Global Foldable Display market, 2019&2026 (USD Million)
        TABLE 2 Global Foldable Display market, by Technology, 2016-2026 (USD Million)
        TABLE 3 Global Foldable Display market, by Technology, 2016-2026 (Units)
        TABLE 4 Global Foldable Display market, by Application, 2016-2026 (USD Million)
        TABLE 5 Global Foldable Display market, by Application, 2016-2026 (Units)
        TABLE 6 Global Foldable Display market, by region, 2016-2026 (USD Million)
        TABLE 7 Global Foldable Display market, by region, 2016-2026 (Units)
        TABLE 8 North America Foldable Display Market, by Technology, 2016-2026 (USD Million)
        TABLE 9 North America Foldable Display Market, by Technology, 2016-2026 (Units)
        TABLE 10 North America Foldable Display Market, by Application, 2016-2026 (USD Million)
        TABLE 11 North America Foldable Display Market, by Application, 2016-2026 (Units)
        TABLE 12 Europe Foldable Display Market, by Technology, 2016-2026 (USD Million)
        TABLE 13 Europe Foldable Display Market, by Technology, 2016-2026 (Units)
        TABLE 14 Europe Foldable Display Market, by Application, 2016-2026 (USD Million)
        TABLE 15 Europe Foldable Display Market, by Application, 2016-2026 (Units)
        TABLE 16 Asia Pacific Foldable Display Market, by Technology, 2016-2026 (USD Million)
        TABLE 17 Asia Pacific Foldable Display Market, by Technology, 2016-2026 (Units)
        TABLE 18 Asia Pacific Foldable Display Market, by Application, 2016-2026 (USD Million)
        TABLE 19 Asia Pacific Foldable Display Market, by Application, 2016-2026 (Units)
        TABLE 20 Latin America Foldable Display Market, by Technology, 2016-2026 (USD Million)
        TABLE 21 Latin America Foldable Display Market, by Technology, 2016-2026 (Units)
        TABLE 22 Latin America Foldable Display Market, by Application, 2016-2026 (USD Million)
        TABLE 23 Latin America Foldable Display Market, by Application, 2016-2026 (Units)
        TABLE 24 The Middle-East and Africa Foldable Display Market, by Technology, 2016-2026 (USD Million)
        TABLE 25 The Middle-East and Africa Foldable Display Market, by Technology, 2016-2026 (Units)
        TABLE 26 The Middle-East and Africa Foldable Display Market, by Application, 2016-2026 (USD Million)
        TABLE 27 The Middle-East and Africa Foldable Display Market, by Application, 2016-2026 (Units)
        TABLE 28 North America Foldable Display Production, Consumption, Export, Import, 2016-2019
        TABLE 29 Europe Foldable Display Production, Consumption, Export, Import, 2016-2019
        TABLE 30 Asia Pacific Foldable Display Production, Consumption, Export, Import, 2016-2019
        TABLE 31 Latin America Foldable Display Production, Consumption, Export, Import, 2016-2019
        TABLE 32 Middle East & Africa Foldable Display Production, Consumption, Export, Import, 2016-2019
        TABLE 33 Global Foldable Display Market - Company Revenue Analysis 2016-2019 (USD Million)
        TABLE 34 Global Foldable Display Market - Company Revenue Share Analysis 2016-2019(%)
        TABLE 35 Global Foldable Display Market - Company Volume Analysis 2016-2019 (Units)
        TABLE 36 Global Foldable Display Market - Company Volume Share Analysis 2016-2019(%)
        TABLE 37 Acquisitions and Mergers
        TABLE 38 New Product/Service Launch
        TABLE 39 Research & Development Activities
        TABLE 40 Market Drivers
        TABLE 41 Market Restraints
        TABLE 42 Market Opportunities
        TABLE 43 Production Base and Market Concentration Rate of Raw Material
        TABLE 44 Key Suppliers of Raw Materials
        TABLE 45 Raw Materials Sources of Foldable Display Major Manufacturers in 2016
        TABLE 46 Major Buyers of Foldable Display
        TABLE 47 Distributors/Traders of Foldable Display by Region

Industry Major Market Players

  •  Sumitomo Chemical
  •  AP Systems
  •  Asahi Glass
  •  C3 Nano
  •  Fuji Film
  •  Royole Corporation
  •  Kaneka
  •  3M
  •  BOE Technology
  •  LG Display
  •  Samsung Display
  •  Tianma
  •  Ube Industries
  •  Semiconductor Energy Laboratory (SEL)
  •  Applied Materials