Search Market Research Report

Discover Our Latest Reports
Discover Our Featured Reports
Discover Top Selling Reports

Flow Battery Market Size, Share Global Analysis Report, , 2021 – 2026

report img

Flow Battery Market By Type (Redox Flow Battery, Hybrid Flow Battery), By Material (All-Vanadium, All-Iron, Zinc–Bromine, Hydrogen–Bromine, Polysulfide Bromide, Organic, and Others), By Storage (Compact, Large scale), By Application (Utilities, Commercial & Industrial, Military, EV Charging Station, Off-Grid & Micro grid Power and Others): Global Industry Perspective, Comprehensive Analysis, and Forecast, 2021 – 2026

Industry Insights

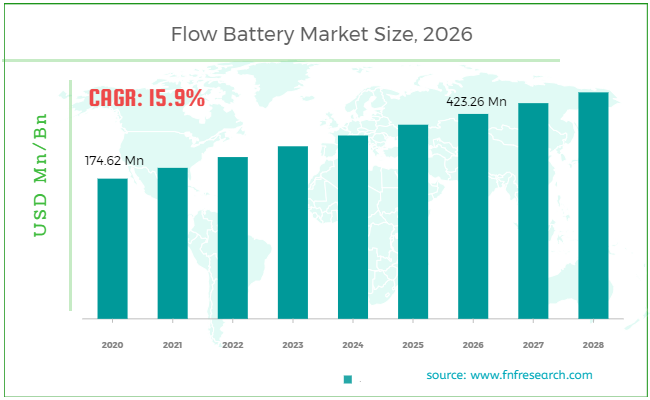
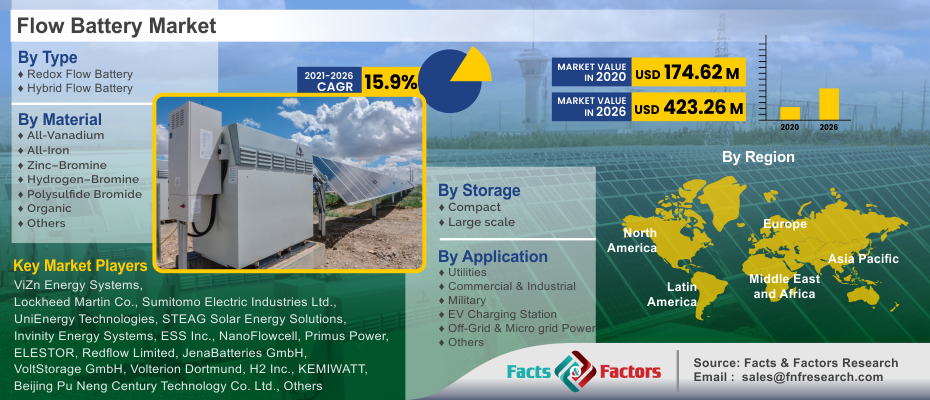
[207+ Pages Report] As per the Facts and Factors market research report, the global flow battery market was USD 174.62 Million in 2020; further, this revenue is expected to reach around USD 423.26 Million by the end of 2026, increasing at a CAGR of around 15.9% from 2021 to 2026.

Flow Battery Market Size

To know more about this report | Request Free Sample Copy

logoMarket Overview

The flow battery is characterized as a battery or electrochemical cell type rechargeable. It is electricity storage equipment that is linked to a standard fuel cell. It carries bipolar components, that are easily dissolved in liquids and that is combined with two independent bands with two electrolyte solutions in two different tanks. Power/energy density, efficiency, and few others indicate the flow battery. Flow battery superiority is the key reason in market expansion, as well as increasing renewable energy investments, better utility demand, and increased telecommunications tower facilities among others, which drive the flow battery market. In addition, huge storage requirements in data centers, expanding penetration into multi-personal applications, technical innovation, and improvised capacities would provide more possibilities in the projected period for the flow battery market. Vanadium batteries are the main fuel component for the flow battery business. As a prominent factor in the sale of flow batteries, the cost of vanadium batteries is examined. New electrical capacities of regional producers of renewable energy such as wind and solar energy experiencing the volatility of power supply that generates as storage systems for flow batteries. Because flow batteries regulate frequency and voltage for utilities. Increasing renewable energy sources are therefore viewed as a significant driving force in the Flow Battery market by several established and developing nations focusing on renewable energy sources for electricity production. Furthermore, flow battery convenience, such as quick charging, a long-term lifecycle, and protracted download times, is projected to produce a lucrative rise in flow battery market by increasing flow battery applications in electric vehicles (EV). The flow battery storage system, on the other hand, demands high-quality electrolytes and the restricted supply of raw material is projected to curb the flow battery market expansion. However, rising applications of electric vehicle flow batteries are projected to provide profitable market development throughout the projection period. Moreover, the Flow Battery Market will have enormous growth as a result of increased investment in renewable energy sources.

Flow Battery Market

To know more about this report | Request Free Sample Copy

logoIndustry Growth Factor

The flow battery industry matures owing to allocations, increased renewable energy investment, strong demand in the supply sector for flow batteries, and increased communications tower facilities. Nevertheless, market growth is prohibited by elements such as expensive initial investment need for the production of flow batteries, technological disadvantages, and poor charge and download rates as well as the absence of appropriate standards for flow battery system design. On the other hand, growing supply-demand is projected to be creating possibilities for flow bacteria for rising numbers of data centers, more penetration of flow battery batteries into home applications, and technological advancements with increased capacity.

logoGlobal Flow Battery Market: Segmentation

Based on Type, the market is bifurcated into redox flow battery and hybrid flow battery. Based on material, the market is bifurcated into all-vanadium, polysulfide bromide, zinc–bromine, all-iron, hydrogen–bromine, organic, and others. Based on Storage, the market is bifurcated into compact and large scale. Based on Application, the market is bifurcated into utilities, military, EV charging station, commercial &industrial, off-grid &micro grid power, and others.

logoReport Scope

Report Attribute

Details

Market Size in 2020

USD 174.62 Billion

Projected Market Size in 2026

USD 423.26 Billion

CAGR Growth Rate

15.9% CAGR

Base Year

2020

Forecast Years

2021-2026

Key Market Players

ViZn Energy Systems, Lockheed Martin Co., Sumitomo Electric Industries Ltd., UniEnergy Technologies, STEAG Solar Energy Solutions, Invinity Energy Systems, ESS Inc., NanoFlowcell, Primus Power, ELESTOR, Redflow Limited, JenaBatteries GmbH, VoltStorage GmbH, Volterion Dortmund, H2 Inc., KEMIWATT, Beijing Pu Neng Century Technology Co. Ltd., CellCube Energy Storage Systems Inc., Largo Clean Energy, and EnSync Energy Systems among others.

Key Segment

By Type, Material, Storage, Application, and Region

Major Regions Covered

North America, Europe, Asia Pacific, Latin America, and the Middle East & Africa

Purchase Options

Request customized purchase options to meet your research needs.Explore purchase options

logoGlobal Flow Battery Market: Regional Analysis

Based on regions, the global flow battery market can be divided into five main regions namely North America, Europe, Latin America, Asia Pacific, and The Middle East and Africa.

In the projected period, the Asia-Pacific battery market is predicted to have the highest growth rate of worldwide flow. APAC has various big power rating operating flow battery systems. Australia has the world's most fluid battery projects for utility, residential, manufacturing and business uses, while China holds the largest installed fluid battery capacity amongst other nations in the area to date. The area has grown as a result of the growing demand in major nations like Japan and Australia for flow batteries. Moreover, there is expected to be a growing demand for grid and microgrid flow batteries in India and China, and increasing numbers of operational projects involving battery flow systems, in addition to the adoptions of energy storage systems for industrial, utility, and other applications, that will fuel regional market growth over the forecast period.

logoGlobal Flow Battery Market: Competitive Players

Some of the key players in the flow battery market are :

  • ViZn Energy Systems
  • Lockheed Martin Co.
  • Sumitomo Electric Industries Ltd.
  • UniEnergy Technologies
  • STEAG Solar Energy Solutions
  • Invinity Energy Systems
  • ESS Inc.
  • NanoFlowcell
  • Primus Power
  • ELESTOR
  • Redflow Limited
  • JenaBatteries GmbH
  • VoltStorage GmbH
  • Volterion Dortmund
  • H2 Inc.
  • KEMIWATT
  • Beijing Pu Neng Century Technology Co. Ltd.
  • CellCube Energy Storage Systems Inc.
  • Largo Clean Energy
  • EnSync Energy Systems

logo By Type:

  • Redox Flow Battery
  • Hybrid Flow Battery

logo Material:

  • All-Vanadium
  • All-Iron
  • Zinc–Bromine
  • Hydrogen–Bromine
  • Polysulfide Bromide
  • Organic
  • Others

logo Storage:

  • Compact
  • Large scale

logo Application:

  • Utilities
  • Commercial & Industrial
  • Military
  • EV Charging Station
  • Off-Grid & Micro grid Power
  • Others

logo By Region:

  • North America
    • The U.S.
    • Canada
  • Europe
    • France
    • The UK
    • Spain
    • Germany
    • Italy
    • Rest of Europe
  • Asia Pacific
    • China
    • Japan
    • India
    • South Korea
    • Southeast Asia
    • Rest of Asia Pacific
  • Latin America
    • Brazil
    • Mexico
    • Rest of Latin America
  • Middle East & Africa
    • GCC
    • South Africa
    • Rest of Middle East & Africa

Table of Content

  1. Chapter 1 Executive Summary
    1. 1.1. Introduction of Flow Battery
    2. 1.2. Global Flow Battery Market, 2020 & 2026 (USD Million)
    3. 1.3. Global Flow Battery Market, 2016 – 2026 (USD Million)
    4. 1.4. Global Flow Battery Market Absolute Revenue Opportunity, 2016 – 2026 (USD Million)
    5. 1.5. Global Flow Battery Market Incremental Revenue Opportunity, 2020 – 2026 (USD Million)
    6. 1.6. COVID-19 Impacts on Flow Battery Market
      1. 1.6.1. COVID-19 Impact on the Players
      2. 1.6.2. Business Strategies and Recommendations
  2. Chapter 2 Flow Battery Market – Type Analysis
    1. 2.1. Global Flow Battery Market – Type Overview
    2. 2.2. Global Flow Battery Market Share, by Type, 2020 & 2026 (USD Million)
    3. 2.3. Redox Flow Battery
      1. 2.3.1. Global Redox Flow BatteryFlow Battery Market, 2016 – 2026 (USD Million)
    4. 2.4. Hybrid Flow Battery
      1. 2.4.1. Global Hybrid Flow BatteryFlow Battery Market, 2016 – 2026 (USD Million)
  3. Chapter 3 Flow Battery Market – Material Analysis
    1. 3.1. Global Flow Battery Market – Material Overview
    2. 3.2. Global Flow Battery Market Share, by Material, 2020 & 2026 (USD Million)
    3. 3.3. All-Vanadium
      1. 3.3.1. Global All-Vanadium Flow Battery Market, 2016 – 2026 (USD Million)
    4. 3.4. All-Iron
      1. 3.4.1. Global All-Iron Flow Battery Market, 2016 – 2026 (USD Million)
    5. 3.5. Zinc–Bromine
      1. 3.5.1. Global Zinc–BromineFlow Battery Market, 2016 – 2026 (USD Million)
    6. 3.6. Hydrogen–Bromine
      1. 3.6.1. Global Hydrogen–BromineFlow Battery Market, 2016 – 2026 (USD Million)
    7. 3.7. Polysulfide Bromide
      1. 3.7.1. Global Polysulfide BromideFlow Battery Market, 2016 – 2026 (USD Million)
    8. 3.8. Organic
      1. 3.8.1. Global Organic Flow Battery Market, 2016 – 2026 (USD Million)
    9. 3.9. Others
      1. 3.9.1. Global Others Flow Battery Market, 2016 – 2026 (USD Million)
  4. Chapter 4 Flow Battery Market – Storage Analysis
    1. 4.1. Global Flow Battery Market – Storage Overview
    2. 4.2. Global Flow Battery Market Share, by Storage, 2020 & 2026 (USD Million)
    3. 4.3. Compact
      1. 4.3.1. Global Compact Flow Battery Market, 2016 – 2026 (USD Million)
    4. 4.4. Large Scale
      1. 4.4.1. Global Large Scale Flow Battery Market, 2016 – 2026 (USD Million)
  5. Chapter 5 Flow Battery Market – Application Analysis
    1. 5.1. Global Flow Battery Market – Application Overview
    2. 5.2. Global Flow Battery Market Share, by Application, 2020 & 2026 (USD Million)
    3. 5.3. Utilities
      1. 5.3.1. Global Utilities Flow Battery Market, 2016 – 2026 (USD Million)
    4. 5.4. Commercial & Industrial
      1. 5.4.1. Global Commercial & Industrial Flow Battery Market, 2016 – 2026 (USD Million)
    5. 5.5. Military
      1. 5.5.1. Global Military Flow Battery Market, 2016 – 2026 (USD Million)
    6. 5.6. EV Charging Station
      1. 5.6.1. Global EV Charging Station Flow Battery Market, 2016 – 2026 (USD Million)
    7. 5.7. Off-Grid & Micro grid Power
      1. 5.7.1. Global Off-Grid & Micro grid Power Flow Battery Market, 2016 – 2026 (USD Million)
    8. 5.8. Others
      1. 5.8.1. Global Others Flow Battery Market, 2016 – 2026 (USD Million)
  6. Chapter 6 Flow Battery Market – Regional Analysis
    1. 6.1. Global Flow Battery Market Regional Overview
    2. 6.2. Global Flow Battery Market Share, by Region, 2020 & 2026 (USD Million)
    3. 6.3. North America
      1. 6.3.1. North America Flow Battery Market, 2016 – 2026 (USD Million)
        1. 6.3.1.1. North America Flow Battery Market, by Country, 2016 - 2026 (USD Million)
      2. 6.3.2. North America Flow Battery Market, by Type, 2016 – 2026
        1. 6.3.2.1. North America Flow Battery Market, by Type, 2016 – 2026 (USD Million)
      3. 6.3.3. North America Flow Battery Market, by Material, 2016 – 2026
        1. 6.3.3.1. North America Flow Battery Market, by Material, 2016 – 2026 (USD Million)
      4. 6.3.4. North America Flow Battery Market, by Storage, 2016 – 2026
        1. 6.3.4.1. North America Flow Battery Market, by Storage, 2016 – 2026 (USD Million)
      5. 6.3.5. North America Flow Battery Market, by Application, 2016 – 2026
        1. 6.3.5.1. North America Flow Battery Market, by Application, 2016 – 2026 (USD Million)
      6. 6.3.6. U.S.
        1. 6.3.6.1. U.S. Flow Battery Market, 2016 – 2026 (USD Million)
      7. 6.3.7. Canada
        1. 6.3.7.1. Canada Flow Battery Market, 2016 – 2026 (USD Million)
    4. 6.4. Europe
      1. 6.4.1. Europe Flow Battery Market, 2016 – 2026 (USD Million)
        1. 6.4.1.1. Europe Flow Battery Market, by Country, 2016 - 2026 (USD Million)
      2. 6.4.2. Europe Flow Battery Market, by Type, 2016 – 2026
        1. 6.4.2.1. Europe Flow Battery Market, by Type, 2016 – 2026 (USD Million)
      3. 6.4.3. Europe Flow Battery Market, by Material, 2016 – 2026
        1. 6.4.3.1. Europe Flow Battery Market, by Material, 2016 – 2026 (USD Million)
      4. 6.4.4. Europe Flow Battery Market, by Storage, 2016 – 2026
        1. 6.4.4.1. Europe Flow Battery Market, by Storage, 2016 – 2026 (USD Million)
      5. 6.4.5. Europe Flow Battery Market, by Application, 2016 – 2026
        1. 6.4.5.1. Europe Flow Battery Market, by Application, 2016 – 2026 (USD Million)
      6. 6.4.6. Germany
        1. 6.4.6.1. Germany Flow Battery Market, 2016 – 2026 (USD Million)
      7. 6.4.7. France
        1. 6.4.7.1. France Flow Battery Market, 2016 – 2026 (USD Million)
      8. 6.4.8. U.K.
        1. 6.4.8.1. U.K. Flow Battery Market, 2016 – 2026 (USD Million)
      9. 6.4.9. Italy
        1. 6.4.9.1. Italy Flow Battery Market, 2016 – 2026 (USD Million)
      10. 6.4.10. Spain
        1. 6.4.10.1. Spain Flow Battery Market, 2016 – 2026 (USD Million)
      11. 6.4.11. Rest of Europe
        1. 6.4.11.1. Rest of Europe Flow Battery Market, 2016 – 2026 (USD Million)
    5. 6.5. Asia Pacific
      1. 6.5.1. Asia Pacific Flow Battery Market, 2016 – 2026 (USD Million)
        1. 6.5.1.1. Asia Pacific Flow Battery Market, by Country, 2016 - 2026 (USD Million)
      2. 6.5.2. Asia Pacific Flow Battery Market, by Type, 2016 – 2026
        1. 6.5.2.1. Asia Pacific Flow Battery Market, by Type, 2016 – 2026 (USD Million)
      3. 6.5.3. Asia Pacific Flow Battery Market, by Material, 2016 – 2026
        1. 6.5.3.1. Asia Pacific Flow Battery Market, by Material, 2016 – 2026 (USD Million)
      4. 6.5.4. Asia Pacific Flow Battery Market, by Storage, 2016 – 2026
        1. 6.5.4.1. Asia Pacific Flow Battery Market, by Storage, 2016 – 2026 (USD Million)
      5. 6.5.5. Asia Pacific Flow Battery Market, by Application, 2016 – 2026
        1. 6.5.5.1. Asia Pacific Flow Battery Market, by Application, 2016 – 2026 (USD Million)
      6. 6.5.6. China
        1. 6.5.6.1. China Flow Battery Market, 2016 – 2026 (USD Million)
      7. 6.5.7. Japan
        1. 6.5.7.1. Japan Flow Battery Market, 2016 – 2026 (USD Million)
      8. 6.5.8. India
        1. 6.5.8.1. India Flow Battery Market, 2016 – 2026 (USD Million)
      9. 6.5.9. SouthKorea
        1. 6.5.9.1. SouthKorea Flow Battery Market, 2016 – 2026 (USD Million)
      10. 6.5.10. South-East Asia
        1. 6.5.10.1. South-East Asia Flow Battery Market, 2016 – 2026 (USD Million)
      11. 6.5.11. Rest of Asia Pacific
        1. 6.5.11.1. Rest of Asia Pacific Flow Battery Market, 2016 – 2026 (USD Million)
    6. 6.6. Latin America
      1. 6.6.1. Latin America Flow Battery Market, 2016 – 2026 (USD Million)
        1. 6.6.1.1. Latin America Flow Battery Market, by Country, 2016 - 2026 (USD Million)
      2. 6.6.2. Latin America Flow Battery Market, by Type, 2016 – 2026
        1. 6.6.2.1. Latin America Flow Battery Market, by Type, 2016 – 2026 (USD Million)
      3. 6.6.3. Latin America Flow Battery Market, by Material, 2016 – 2026
        1. 6.6.3.1. Latin America Flow Battery Market, by Material, 2016 – 2026 (USD Million)
      4. 6.6.4. Latin America Flow Battery Market, by Storage, 2016 – 2026
        1. 6.6.4.1. Latin America Flow Battery Market, by Storage, 2016 – 2026 (USD Million)
      5. 6.6.5. Latin America Flow Battery Market, by Application, 2016 – 2026
        1. 6.6.5.1. Latin America Flow Battery Market, by Application, 2016 – 2026 (USD Million)
      6. 6.6.6. Brazil
        1. 6.6.6.1. Brazil Flow Battery Market, 2016 – 2026 (USD Million)
      7. 6.6.7. Mexico
        1. 6.6.7.1. Mexico Flow Battery Market, 2016 – 2026 (USD Million)
      8. 6.6.8. Rest of Latin America
        1. 6.6.8.1. Rest of Latin America Flow Battery Market, 2016 – 2026 (USD Million)
    7. 6.7. The Middle-East and Africa
      1. 6.7.1. The Middle-East and Africa Flow Battery Market, 2016 – 2026 (USD Million)
        1. 6.7.1.1. The Middle-East and Africa Flow Battery Market, by Country, 2016 - 2026 (USD Million)
      2. 6.7.2. The Middle-East and Africa Flow Battery Market, by Type, 2016 – 2026
        1. 6.7.2.1. The Middle-East and Africa Flow Battery Market, by Type, 2016 – 2026 (USD Million)
      3. 6.7.3. The Middle-East and Africa Flow Battery Market, by Material, 2016 – 2026
        1. 6.7.3.1. The Middle-East and Africa Flow Battery Market, by Material, 2016 – 2026 (USD Million)
      4. 6.7.4. The Middle-East and Africa Flow Battery Market, by Storage, 2016 – 2026
        1. 6.7.4.1. The Middle-East and Africa Flow Battery Market, by Storage, 2016 – 2026 (USD Million)
      5. 6.7.5. The Middle-East and Africa Flow Battery Market, by Application, 2016 – 2026
        1. 6.7.5.1. The Middle-East and Africa Flow Battery Market, by Application, 2016 – 2026 (USD Million)
      6. 6.7.6. GCC Countries
        1. 6.7.6.1. GCC Countries Flow Battery Market, 2016 – 2026 (USD Million)
      7. 6.7.7. South Africa
        1. 6.7.7.1. South Africa Flow Battery Market, 2016 – 2026 (USD Million)
      8. 6.7.8. Rest of Middle-East Africa
        1. 6.7.8.1. Rest of Middle-East Africa Flow Battery Market, 2016 – 2026 (USD Million)
  7. Chapter 7 Flow Battery Market – Competitive Landscape
    1. 7.1. Competitor Market Share – Revenue
    2. 7.2. Market Concentration Rate Analysis, Top 3 and Top 5 Players
    3. 7.3. Strategic Developments
      1. 7.3.1. Acquisitions and Mergers
      2. 7.3.2. New Products
      3. 7.3.3. Research & Development Activities
  8. Chapter 8 Company Profiles
    1. 8.1. Lockheed Martin Co.
      1. 8.1.1. Company Overview
      2. 8.1.2. Product/Service Portfolio
      3. 8.1.3. Lockheed Martin Co. Sales, Revenue, and Gross Margin
      4. 8.1.4. Lockheed Martin Co. Revenue and Growth Rate
      5. 8.1.5. Lockheed Martin Co. Market Share
      6. 8.1.6. Recent Initiatives, Funding/VC Activities, and Technological Innovations
    2. 8.2. ViZn Energy Systems
      1. 8.2.1. Company Overview
      2. 8.2.2. Product/Service Portfolio
      3. 8.2.3. ViZn Energy Systems Sales, Revenue, and Gross Margin
      4. 8.2.4. ViZn Energy Systems Revenue and Growth Rate
      5. 8.2.5. ViZn Energy Systems Market Share
      6. 8.2.6. Recent Initiatives, Funding/VC Activities, and Technological Innovations
    3. 8.3. UniEnergy Technologies
      1. 8.3.1. Company Overview
      2. 8.3.2. Product/Service Portfolio
      3. 8.3.3. UniEnergy Technologies Sales, Revenue, and Gross Margin
      4. 8.3.4. UniEnergy Technologies Revenue and Growth Rate
      5. 8.3.5. UniEnergy Technologies Market Share
      6. 8.3.6. Recent Initiatives, Funding/VC Activities, and Technological Innovations
    4. 8.4. Sumitomo Electric Industries, Ltd.
      1. 8.4.1. Company Overview
      2. 8.4.2. Product/Service Portfolio
      3. 8.4.3. Sumitomo Electric Industries, Ltd. Sales, Revenue, and Gross Margin
      4. 8.4.4. Sumitomo Electric Industries, Ltd. Revenue and Growth Rate
      5. 8.4.5. Sumitomo Electric Industries, Ltd. Market Share
      6. 8.4.6. Recent Initiatives, Funding/VC Activities, and Technological Innovations
    5. 8.5. Invinity Energy Systems
      1. 8.5.1. Company Overview
      2. 8.5.2. Product/Service Portfolio
      3. 8.5.3. Invinity Energy Systems Sales, Revenue, and Gross Margin
      4. 8.5.4. Invinity Energy Systems Revenue and Growth Rate
      5. 8.5.5. Invinity Energy Systems Market Share
      6. 8.5.6. Recent Initiatives, Funding/VC Activities, and Technological Innovations
    6. 8.6. STEAG Solar Energy Solutions
      1. 8.6.1. Company Overview
      2. 8.6.2. Product/Service Portfolio
      3. 8.6.3. STEAG Solar Energy Solutions Sales, Revenue, and Gross Margin
      4. 8.6.4. STEAG Solar Energy Solutions Revenue and Growth Rate
      5. 8.6.5. STEAG Solar Energy Solutions Market Share
      6. 8.6.6. Recent Initiatives, Funding/VC Activities, and Technological Innovations
    7. 8.7. ESS, Inc.
      1. 8.7.1. Company Overview
      2. 8.7.2. Product/Service Portfolio
      3. 8.7.3. ESS, Inc. Sales, Revenue, and Gross Margin
      4. 8.7.4. ESS, Inc. Revenue and Growth Rate
      5. 8.7.5. ESS, Inc. Market Share
      6. 8.7.6. Recent Initiatives, Funding/VC Activities, and Technological Innovations
    8. 8.8. Primus Power
      1. 8.8.1. Company Overview
      2. 8.8.2. Product/Service Portfolio
      3. 8.8.3. Primus Power Sales, Revenue, and Gross Margin
      4. 8.8.4. Primus Power Revenue and Growth Rate
      5. 8.8.5. Primus Power Market Share
      6. 8.8.6. Recent Initiatives, Funding/VC Activities, and Technological Innovations
    9. 8.9. NanoFlowcell
      1. 8.9.1. Company Overview
      2. 8.9.2. Product/Service Portfolio
      3. 8.9.3. NanoFlowcell Sales, Revenue, and Gross Margin
      4. 8.9.4. NanoFlowcell Revenue and Growth Rate
      5. 8.9.5. NanoFlowcell Market Share
      6. 8.9.6. Recent Initiatives, Funding/VC Activities, and Technological Innovations
    10. 8.10. Redflow Limited
      1. 8.10.1. Company Overview
      2. 8.10.2. Product/Service Portfolio
      3. 8.10.3. Redflow Limited Sales, Revenue, and Gross Margin
      4. 8.10.4. Redflow Limited Revenue and Growth Rate
      5. 8.10.5. Redflow Limited Market Share
      6. 8.10.6. Recent Initiatives, Funding/VC Activities, and Technological Innovations
    11. 8.11. ELESTOR
      1. 8.11.1. Company Overview
      2. 8.11.2. Product/Service Portfolio
      3. 8.11.3. ELESTOR Sales, Revenue, and Gross Margin
      4. 8.11.4. ELESTOR Revenue and Growth Rate
      5. 8.11.5. ELESTOR Market Share
      6. 8.11.6. Recent Initiatives, Funding/VC Activities, and Technological Innovations
    12. 8.12. JenaBatteries GmbH
      1. 8.12.1. Company Overview
      2. 8.12.2. Product/Service Portfolio
      3. 8.12.3. JenaBatteries GmbH Sales, Revenue, and Gross Margin
      4. 8.12.4. JenaBatteries GmbH Revenue and Growth Rate
      5. 8.12.5. JenaBatteries GmbH Market Share
      6. 8.12.6. Recent Initiatives, Funding/VC Activities, and Technological Innovations
    13. 8.13. Volterion Dortmund
      1. 8.13.1. Company Overview
      2. 8.13.2. Product/Service Portfolio
      3. 8.13.3. Volterion Dortmund Sales, Revenue, and Gross Margin
      4. 8.13.4. Volterion Dortmund Revenue and Growth Rate
      5. 8.13.5. Volterion Dortmund Market Share
      6. 8.13.6. Recent Initiatives, Funding/VC Activities, and Technological Innovations
    14. 8.14. VoltStorage GmbH
      1. 8.14.1. Company Overview
      2. 8.14.2. Product/Service Portfolio
      3. 8.14.3. VoltStorage GmbH Sales, Revenue, and Gross Margin
      4. 8.14.4. VoltStorage GmbH Revenue and Growth Rate
      5. 8.14.5. VoltStorage GmbH Market Share
      6. 8.14.6. Recent Initiatives, Funding/VC Activities, and Technological Innovations
    15. 8.15. H2, Inc.
      1. 8.15.1. Company Overview
      2. 8.15.2. Product/Service Portfolio
      3. 8.15.3. H2, Inc. Sales, Revenue, and Gross Margin
      4. 8.15.4. H2, Inc. Revenue and Growth Rate
      5. 8.15.5. H2, Inc. Market Share
      6. 8.15.6. Recent Initiatives, Funding/VC Activities, and Technological Innovations
    16. 8.16. Beijing Pu Neng Century Technology Co., Ltd.
      1. 8.16.1. Company Overview
      2. 8.16.2. Product/Service Portfolio
      3. 8.16.3. Beijing Pu Neng Century Technology Co., Ltd. Sales, Revenue, and Gross Margin
      4. 8.16.4. Beijing Pu Neng Century Technology Co., Ltd. Revenue and Growth Rate
      5. 8.16.5. Beijing Pu Neng Century Technology Co., Ltd. Market Share
      6. 8.16.6. Recent Initiatives, Funding/VC Activities, and Technological Innovations
    17. 8.17. KEMIWATT
      1. 8.17.1. Company Overview
      2. 8.17.2. Product/Service Portfolio
      3. 8.17.3. KEMIWATT Sales, Revenue, and Gross Margin
      4. 8.17.4. KEMIWATT Revenue and Growth Rate
      5. 8.17.5. KEMIWATT Market Share
      6. 8.17.6. Recent Initiatives, Funding/VC Activities, and Technological Innovations
    18. 8.18. Largo Clean Energy
      1. 8.18.1. Company Overview
      2. 8.18.2. Product/Service Portfolio
      3. 8.18.3. Largo Clean Energy Sales, Revenue, and Gross Margin
      4. 8.18.4. Largo Clean Energy Revenue and Growth Rate
      5. 8.18.5. Largo Clean Energy Market Share
      6. 8.18.6. Recent Initiatives, Funding/VC Activities, and Technological Innovations
    19. 8.19. CellCube Energy Storage Systems Inc.
      1. 8.19.1. Company Overview
      2. 8.19.2. Product/Service Portfolio
      3. 8.19.3. CellCube Energy Storage Systems Inc. Sales, Revenue, and Gross Margin
      4. 8.19.4. CellCube Energy Storage Systems Inc. Revenue and Growth Rate
      5. 8.19.5. CellCube Energy Storage Systems Inc. Market Share
      6. 8.19.6. Recent Initiatives, Funding/VC Activities, and Technological Innovations
    20. 8.20. EnSync Energy Systems
      1. 8.20.1. Company Overview
      2. 8.20.2. Product/Service Portfolio
      3. 8.20.3. EnSync Energy Systems Sales, Revenue, and Gross Margin
      4. 8.20.4. EnSync Energy Systems Revenue and Growth Rate
      5. 8.20.5. EnSync Energy Systems Market Share
      6. 8.20.6. Recent Initiatives, Funding/VC Activities, and Technological Innovations
  9. Chapter 9 Flow Battery — Industry Analysis
    1. 9.1. Introduction and Taxonomy
    2. 9.2. Flow Battery Market – Key Trends
      1. 9.2.1. Market Drivers
      2. 9.2.2. Market Restraints
      3. 9.2.3. Market Opportunities
    3. 9.3. Porter’s Five Forces Model
      1. 9.3.1. Bargaining Power of Buyers
      2. 9.3.2. Bargaining Power of Suppliers
      3. 9.3.3. Threat of Substitute
      4. 9.3.4. Threat of New Entrants
      5. 9.3.5. Rivalry among Existing Competitors
    4. 9.4. PESTEL Analysis
    5. 9.5. Key Mandates and Regulations
    6. 9.6. Technology Roadmap and Timeline
    7. 9.7. Flow Battery Market – Attractiveness Analysis
      1. 9.7.1. By Type
      2. 9.7.2. By Material
      3. 9.7.3. By Storage
      4. 9.7.4. By Application
      5. 9.7.5. By Region
  10. Chapter 10 Report Conclusion & Key Insights
    1. 10.1. Key Insights from Primary Interviews & Surveys Respondents
    2. 10.2. Key Takeaways from Analysts, Consultants, and Industry Leaders
  11. Chapter 11 Research Approach & Methodology
    1. 11.1. Report Description
    2. 11.2. Research Scope
    3. 11.3. Research Methodology
      1. 11.3.1. Secondary Research
      2. 11.3.2. Primary Research
      3. 11.3.3. Statistical Models
        1. 11.3.3.1. Company Share Analysis Model
        2. 11.3.3.2. Revenue Based Modeling
      4. 11.3.4. Research Limitations

      List of Figures

      Fig.1 Product Picture of Flow Battery
      Fig.2 Global Flow Battery Market, 2016 – 2026 (USD Million)
      Fig.3 Global Flow Battery Market Absolute Revenue Opportunity, 2016 – 2026 (USD Million)
      Fig.4 Global Flow Battery Market Incremental Revenue Opportunity, 2020 – 2026 (USD Million)
      Fig.5 COVID-19 Impacts on Flow Battery
      Fig.6 COVID-19 Impact on the Players
      Fig.7 Business Strategies and Recommendations
      Fig.8 Global Flow Battery Market Share, by Type, 2020 & 2026 (USD Million)
      Fig.9 Global Redox Flow BatteryFlow Battery Market, 2016 – 2026 (USD Million)
      Fig.10 Global Hybrid Flow BatteryFlow Battery Market, 2016 – 2026 (USD Million)
      Fig.11 Global Flow Battery Market Share, by Material, 2020 & 2026 (USD Million)
      Fig.12 Global All-Vanadium Flow Battery Market, 2016 – 2026 (USD Million)
      Fig.13 Global All-Iron Flow Battery Market, 2016 – 2026 (USD Million)
      Fig.14 Global Zinc–BromineFlow Battery Market, 2016 – 2026 (USD Million)
      Fig.15 Global Hydrogen–BromineFlow Battery Market, 2016 – 2026 (USD Million)
      Fig.16 Global Polysulfide BromideFlow Battery Market, 2016 – 2026 (USD Million)
      Fig.17 Global Organic Flow Battery Market, 2016 – 2026 (USD Million)
      Fig.18 Global Others Flow Battery Market, 2016 – 2026 (USD Million)
      Fig.19 Global Flow Battery Market Share, by Storage, 2020 & 2026 (USD Million)
      Fig.20 Global Compact Flow Battery Market, 2016 – 2026 (USD Million)
      Fig.21 Global Large Scale Flow Battery Market, 2016 – 2026 (USD Million)
      Fig.22 Global Flow Battery Market Share, by Application, 2020 & 2026 (USD Million)
      Fig.23 Global Utilities Flow Battery Market, 2016 – 2026 (USD Million)
      Fig.24 Global Commercial & Industrial Flow Battery Market, 2016 – 2026 (USD Million)
      Fig.25 Global Military Flow Battery Market, 2016 – 2026 (USD Million)
      Fig.26 Global EV Charging Station Flow Battery Market, 2016 – 2026 (USD Million)
      Fig.27 Global Off-Grid & Micro grid Power Flow Battery Market, 2016 – 2026 (USD Million)
      Fig.28 Global Others Flow Battery Market, 2016 – 2026 (USD Million)
      Fig.29 Global Flow Battery Market Share, by Region, 2020 & 2026 (USD Million)
      Fig.30 North America Flow Battery Market, 2016 – 2026 (USD Million)
      Fig.31 U.S. Flow Battery Market, 2016 – 2026 (USD Million)
      Fig.32 Canada Flow Battery Market, 2016 – 2026 (USD Million)
      Fig.33 Europe Flow Battery Market, 2016 – 2026 (USD Million)
      Fig.34 Germany Flow Battery Market, 2016 – 2026 (USD Million)
      Fig.35 France Flow Battery Market, 2016 – 2026 (USD Million)
      Fig.36 U.K. Flow Battery Market, 2016 – 2026 (USD Million)
      Fig.37 Italy Flow Battery Market, 2016 – 2026 (USD Million)
      Fig.38 Spain Flow Battery Market, 2016 – 2026 (USD Million)
      Fig.39 Rest of Europe Flow Battery Market, 2016 – 2026 (USD Million)
      Fig.40 Asia Pacific Flow Battery Market, 2016 – 2026 (USD Million)
      Fig.41 China Flow Battery Market, 2016 – 2026 (USD Million)
      Fig.42 Japan Flow Battery Market, 2016 – 2026 (USD Million)
      Fig.43 India Flow Battery Market, 2016 – 2026 (USD Million)
      Fig.44 SouthKorea Flow Battery Market, 2016 – 2026 (USD Million)
      Fig.45 South-East Asia Flow Battery Market, 2016 – 2026 (USD Million)
      Fig.46 Rest of Asia Pacific Flow Battery Market, 2016 – 2026 (USD Million)
      Fig.47 Latin America Flow Battery Market, 2016 – 2026 (USD Million)
      Fig.48 Brazil Flow Battery Market, 2016 – 2026 (USD Million)
      Fig.49 Mexico Flow Battery Market, 2016 – 2026 (USD Million)
      Fig.50 Rest of Latin America Flow Battery Market, 2016 – 2026 (USD Million)
      Fig.51 The Middle-East and Africa Flow Battery Market, 2016 – 2026 (USD Million)
      Fig.52 GCC Countries Flow Battery Market, 2016 – 2026 (USD Million)
      Fig.53 South Africa Flow Battery Market, 2016 – 2026 (USD Million)
      Fig.54 Rest of Middle-East Africa Flow Battery Market, 2016 – 2026 (USD Million)
      Fig.55 Competitor Market Share – Revenue
      Fig.56 Lockheed Martin Co. Revenue and Growth Rate
      Fig.57 Lockheed Martin Co. Market Share
      Fig.58 ViZn Energy Systems Revenue and Growth Rate
      Fig.59 ViZn Energy Systems Market Share
      Fig.60 UniEnergy Technologies Revenue and Growth Rate
      Fig.61 UniEnergy Technologies Market Share
      Fig.62 Sumitomo Electric Industries, Ltd. Revenue and Growth Rate
      Fig.63 Sumitomo Electric Industries, Ltd. Market Share
      Fig.64 Invinity Energy Systems Revenue and Growth Rate
      Fig.65 Invinity Energy Systems Market Share
      Fig.66 STEAG Solar Energy Solutions Revenue and Growth Rate
      Fig.67 STEAG Solar Energy Solutions Market Share
      Fig.68 ESS, Inc. Revenue and Growth Rate
      Fig.69 ESS, Inc. Market Share
      Fig.70 Primus Power Revenue and Growth Rate
      Fig.71 Primus Power Market Share
      Fig.72 NanoFlowcell Revenue and Growth Rate
      Fig.73 NanoFlowcell Market Share
      Fig.74 Redflow Limited Revenue and Growth Rate
      Fig.75 Redflow Limited Market Share
      Fig.76 ELESTOR Revenue and Growth Rate
      Fig.77 ELESTOR Market Share
      Fig.78 JenaBatteries GmbH Revenue and Growth Rate
      Fig.79 JenaBatteries GmbH Market Share
      Fig.80 Volterion Dortmund Revenue and Growth Rate
      Fig.81 Volterion Dortmund Market Share
      Fig.82 VoltStorage GmbH Revenue and Growth Rate
      Fig.83 VoltStorage GmbH Market Share
      Fig.84 H2, Inc. Revenue and Growth Rate
      Fig.85 H2, Inc. Market Share
      Fig.86 Beijing Pu Neng Century Technology Co., Ltd. Revenue and Growth Rate
      Fig.87 Beijing Pu Neng Century Technology Co., Ltd. Market Share
      Fig.88 KEMIWATT Revenue and Growth Rate
      Fig.89 KEMIWATT Market Share
      Fig.90 Largo Clean Energy Revenue and Growth Rate
      Fig.91 Largo Clean Energy Market Share
      Fig.92 CellCube Energy Storage Systems Inc. Revenue and Growth Rate
      Fig.93 CellCube Energy Storage Systems Inc. Market Share
      Fig.94 EnSync Energy Systems Revenue and Growth Rate
      Fig.95 EnSync Energy Systems Market Share
      Fig.96 Market Dynamics
      Fig.97 PESTEL Analysis
      Fig.98 Key Mandates and Regulations
      Fig.99 Technology Roadmap and Timeline
      Fig.100 Market Attractiveness Analysis – By Type
      Fig.101 Market Attractiveness Analysis – By Material
      Fig.102 Market Attractiveness Analysis – By Storage
      Fig.103 Market Attractiveness Analysis – By Application
      Fig.104 Market Attractiveness Analysis – By Region
      

      List of Tables

      Table 1 Global Flow Battery Market, 2020 & 2026 (USD Million)
      Table 2 Global Flow Battery Market, by Type, 2016 – 2026 (USD Million)
      Table 3 Global Flow Battery Market, by Material, 2016 – 2026 (USD Million)
      Table 4 Global Flow Battery Market, by Storage, 2016 – 2026 (USD Million)
      Table 5 Global Flow Battery Market, by Application, 2016 – 2026 (USD Million)
      Table 6 Global Flow Battery Market, by Region, 2016 – 2026 (USD Million)
      Table 7 North America Flow Battery Market, by Country, 2016 – 2026 (USD Million)
      Table 8 North America Flow Battery Market, by Type, 2016 – 2026 (USD Million)
      Table 9 North America Flow Battery Market, by Material, 2016 – 2026 (USD Million)
      Table 10 North America Flow Battery Market, by Storage, 2016 – 2026 (USD Million)
      Table 11 North America Flow Battery Market, by Application, 2016 – 2026 (USD Million)
      Table 12 Europe Flow Battery Market, by Country, 2016 – 2026 (USD Million)
      Table 13 Europe Flow Battery Market, by Type, 2016 – 2026 (USD Million)
      Table 14 Europe Flow Battery Market, by Material, 2016 – 2026 (USD Million)
      Table 15 Europe Flow Battery Market, by Storage, 2016 – 2026 (USD Million)
      Table 16 Europe Flow Battery Market, by Application, 2016 – 2026 (USD Million)
      Table 17 Asia Pacific Flow Battery Market, by Country, 2016 – 2026 (USD Million)
      Table 18 Asia Pacific Flow Battery Market, by Type, 2016 – 2026 (USD Million)
      Table 19 Asia Pacific Flow Battery Market, by Material, 2016 – 2026 (USD Million)
      Table 20 Asia Pacific Flow Battery Market, by Storage, 2016 – 2026 (USD Million)
      Table 21 Asia Pacific Flow Battery Market, by Application, 2016 – 2026 (USD Million)
      Table 22 Latin America Flow Battery Market, by Country, 2016 – 2026 (USD Million)
      Table 23 Latin America Flow Battery Market, by Type, 2016 – 2026 (USD Million)
      Table 24 Latin America Flow Battery Market, by Material, 2016 – 2026 (USD Million)
      Table 25 Latin America Flow Battery Market, by Storage, 2016 – 2026 (USD Million)
      Table 26 Latin America Flow Battery Market, by Application, 2016 – 2026 (USD Million)
      Table 27 The Middle-East and Africa Flow Battery Market, by Country, 2016 – 2026 (USD Million)
      Table 28 The Middle-East and Africa Flow Battery Market, by Type, 2016 – 2026 (USD Million)
      Table 29 The Middle-East and Africa Flow Battery Market, by Material, 2016 – 2026 (USD Million)
      Table 30 The Middle-East and Africa Flow Battery Market, by Storage, 2016 – 2026 (USD Million)
      Table 31 The Middle-East and Africa Flow Battery Market, by Application, 2016 – 2026 (USD Million)
      Table 32 Global Flow Battery Market - Company Revenue Analysis, 2016 – 2019 (USD Million)
      Table 33 Global Flow Battery Market - Company Revenue Share Analysis, 2016 – 2019 (%)
      Table 34 Acquisitions and Mergers
      Table 35 Market Drivers – Impact Analysis
      Table 36 Market Restraints
      Table 37 Market Opportunities 
      

Industry Major Market Players

  • ViZn Energy Systems
  • Lockheed Martin Co.
  • Sumitomo Electric Industries Ltd.
  • UniEnergy Technologies
  • STEAG Solar Energy Solutions
  • Invinity Energy Systems
  • ESS Inc.
  • NanoFlowcell
  • Primus Power
  • ELESTOR
  • Redflow Limited
  • JenaBatteries GmbH
  • VoltStorage GmbH
  • Volterion Dortmund
  • H2 Inc.
  • KEMIWATT
  • Beijing Pu Neng Century Technology Co. Ltd.
  • CellCube Energy Storage Systems Inc.
  • Largo Clean Energy
  • EnSync Energy Systems