Search Market Research Report

Discover Our Latest Reports
Discover Our Featured Reports
Discover Top Selling Reports

Flavonoids Market Size, Share Global Analysis Report, 2020–2026

report img

Flavonoids Market By Type (Anthocyanins, Flavones, Anthoxanthins, Isoflavonens, and Chalcones) and By Application (Pharmaceutical, Food and Beverages, Nutraceuticals and Animal Feed): Global Industry Outlook, Market Size, Business Intelligence, Consumer Preferences, Statistical Surveys, Comprehensive Analysis, Historical Developments, Current Trends, and Forecast 2020–2026

Industry Insights

The flavonoids market report analyzes and notifies the industry statistics at the global as well as regional and country levels in order to acquire a thorough perspective of the entire flavonoids market. The historical and past insights are provided for FY 2016 to FY 2019 whereas projected trends are delivered for FY 2020 to FY 2026. The quantitative and numerical data is represented in terms of both volume (Tons) and value (USD Million) from FY 2016 – 2026.

This specialized and expertise-oriented industry research report scrutinizes the technical and commercial business outlook of the industry of flavonoids. The report analyzes and declares the historical and current trends analysis of the industry of the flavonoids and subsequently recommends the projected trends anticipated to be observed in the flavonoids market during the upcoming years.

Flavonoids Market Size

To know more about this report | Request Free Sample Copy

logoKey Insights from Primary Research

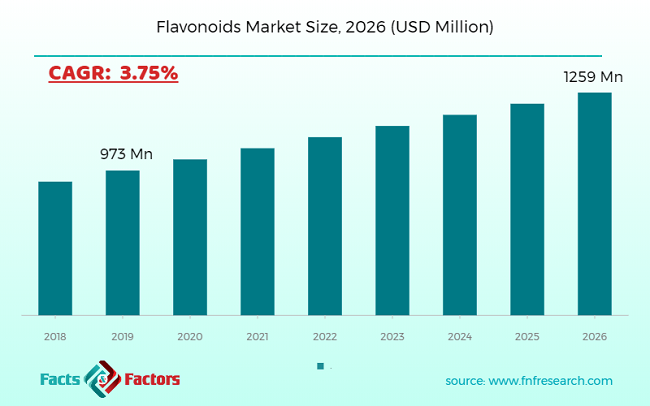
  • As per our primary respondents, the flavonoids market is set to grow annually at a rate of around 3.75%
  • It was established through primary research that the flavonoids market was valued at around USD 973 million in 2019
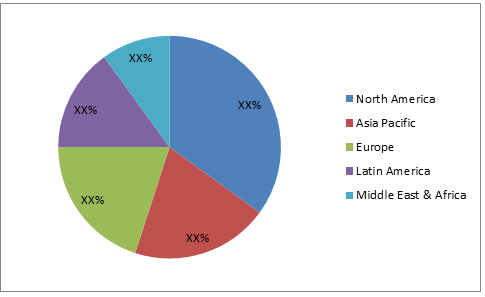
  • North America held the largest market share of the Nerve Gas Auto-Injector market in 2019
  • The “Anthocyanins” category, on the basis of type segmentation, was the leading revenue-generating in 2019
  • The “Nutraceuticals” category, on the basis of application segmentation, was the leading revenue-generating in 2019

logoKey Recommendations from Analysts

  • As per our analysts, growing awareness among the younger generation about health consciousness drives flavonoid market
  • Diverse uses of flavonoids in the food and beverage industry and the nutraceuticals industry are expected to boost the growth of the demand for flavonoids
  • In emerging countries, the untapped flavonoids market is likely to deliver ample opportunities for the industry of the flavonoids in the coming years
  • Surplus flavonoid consumption may convert flavonoids into mutagens that may impede the growth of the market for flavonoids
  • The number of obese and depressed patients in North America is growing which has resulted in the growth of the North American market for flavonoids

logoGlobal Flavonoid Market Share – By Region

Flavonoids Market

To know more about this report | Request Free Sample Copy

The quantitative data is further underlined and reinforced by comprehensive qualitative data which comprises various across-the-board market dynamics. The rationales which directly or indirectly impact the industry of the flavonoids are exemplified through parameters such as growth drivers, restraints, challenges, and opportunities among other impacting factors.

Throughout our research report, we have encompassed all the proven models and tools of industry analysis and extensively illustrated all the key business strategies and business models adopted in the industry of flavonoids. The report provides an all-inclusive and detailed competitive landscape prevalent in the flavonoids market.

The report utilizes established industry analysis tools and models such as Porter’s Five Forces framework to analyze and recognize critical business strategies adopted by various stakeholders involved in the entire value chain of the industry of flavonoids. The flavonoids market report additionally employs SWOT analysis and PESTLE analysis models for further in-depth analysis.

The report study further includes an in-depth analysis of industry players' market shares and provides an overview of leading players' market position in the flavonoids sector. Key strategic developments in the flavonoids market competitive landscape such as acquisitions & mergers, inaugurations of different products and services, partnerships & joint ventures, MoU agreements, VC & funding activities, R&D activities, and geographic expansion among other noteworthy activities by key players of the flavonoids market are appropriately highlighted in the report.

The escalating occurrence of high cholesterol, depression, and obesity patients coupled with increasing health issues due to the consumption of junk food drives the market for flavonoids. Moreover, the easy availability of functional foods and the presence of a wide variety of functional foods fuel the growth of the market. Increasing disposable income, changing lifestyles and rising diet culture among women bolster the flavonoids market. Also, surging demand for frozen and processed food has strained the manufacturers for the use of preservatives which in turn has assisted the flavonoids market growth.

Some studies on the flavonoids conclude that excess consumption of flavonoids may turn the flavonoids into mutagens. This factor can limit the growth of the flavonoids market. Nevertheless, the use of natural and functional food products for lowering cholesterol along with the unexploited market in emerging countries is likely to positively impact on flavonoids market in the coming years.

The flavonoids market research report delivers an acute valuation and taxonomy of the industry of the flavonoids by practically splitting the market on the basis of different types, applications, and regions. Through the analysis of the historical and projected trends, all the segments and sub-segments were evaluated through the bottom-up approach, and different market sizes have been projected for FY 2020 to FY 2026.

The regional segmentation of the industry of flavonoids includes the complete classification of all the major continents including North America, Latin America, Europe, Asia Pacific, and the Middle East & Africa. Further, country-wise data for the industry of the flavonoids are provided for the leading economies of the world.

The flavonoids market is segmented based on type and application. On the basis of type segmentation, the market is classified into anthocyanins, flavones, anthoxanthins, isoflavones, and chalcones. In terms of application segmentation, the market is bifurcated into pharmaceuticals, food and beverages, nutraceuticals and animal feed.

logoReport Scope

Report Attribute

Details

Market Size in 2019

USD 973 million

Projected Market Size in 2026

USD 1259 Million

CAGR Growth Rate

3.75% CAGR

Base Year

2019

Forecast Years

2020-2026

Key Market Players

Foodchem International Corporation, Meherrin Agricultural & Chemical Company, Quercegen Pharmaceuticals, Aquapharm Bio-Discovery Limited, Indofine Chemical Company Inc, Kemin Industries, EXTRA SYNTHE SE, Cayman Chemical Company, International Flavors and Fragrances, and Others.

Key Segment

By Type, By Application, By Region

Major Regions Covered

North America, Europe, Asia Pacific, Latin America, and the Middle East & Africa

Purchase Options

Request customized purchase options to meet your research needs. Explore purchase options

logoSome of the essential players operating in the flavonoids market, but not restricted to include:

  •  Foodchem International Corporation
  •  Meherrin Agricultural & Chemical Company
  •  Quercegen Pharmaceuticals
  •  Aquapharm Bio-Discovery Limited
  •  Indofine Chemical Company Inc
  •  Kemin Industries
  •  EXTRA SYNTHE SE
  •  Cayman Chemical Company
  •  International Flavors and Fragrances

The taxonomy of the industry of flavonoids by its scope and segmentation is as follows:

logo By Type Segmentation Analysis (Customizable)

  • Anthocyanins
  • Flavones
  • Anthoxanthins
  • Isoflavonens
  • Chalcones 

logo By Application Segmentation Analysis (Customizable)

  • Pharmaceutical
  • Food and beverages
  • Nutraceuticals
  • Animal feed

logo Regional Segmentation Analysis (Customizable)

  • North America
    • The U.S.
    • Canada
  • Europe
    • Germany
    • The UK
    • France
    • Spain
    • Italy
    • Rest of Europe
  • Asia Pacific
    • China
    • Japan
    • India
    • South Korea
    • Southeast Asia
    • Rest of Asia Pacific
  • Latin America
    • Brazil
    • Mexico
    • Rest of Latin America
  • Middle East & Africa
    • GCC
    • South Africa
    • Rest of Middle East & Africa

Table of Content

  1. CHAPTER 1. Executive Summary
  2. CHAPTER 2. Flavonoids market – Type Analysis
    1. 2.1. Global Flavonoids Market – Type Overview
    2. 2.2. Global Flavonoids Market Share, by Type, 2019 & 2026 (USD Million)
    3. 2.3. Global Flavonoids Market share, by Type, 2019 & 2026 (Tons)
    4. 2.4. Anthocyanins
      1. 2.4.1. Global Anthocyanins Flavonoids Market, 2016-2026 (USD Million)
      2. 2.4.2. Global Anthocyanins Flavonoids Market, 2016-2026 (Tons)
    5. 2.5. Flavones
      1. 2.5.1. Global Flavones Flavonoids Market, 2016-2026 (USD Million)
      2. 2.5.2. Global Flavones Flavonoids Market, 2016-2026 (Tons)
    6. 2.6. Anthoxanthins
      1. 2.6.1. Global Anthoxanthins Flavonoids Market, 2016-2026 (USD Million)
      2. 2.6.2. Global Anthoxanthins Flavonoids Market, 2016-2026 (Tons)
    7. 2.7. Isoflavonens
      1. 2.7.1. Global Isoflavonens Flavonoids Market, 2016-2026 (USD Million)
      2. 2.7.2. Global Isoflavonens Flavonoids Market, 2016-2026 (Tons)
    8. 2.8. Chalcones
      1. 2.8.1. Global Chalcones Flavonoids Market, 2016-2026 (USD Million)
      2. 2.8.2. Global Chalcones Flavonoids Market, 2016-2026 (Tons)
  3. CHAPTER 3. Flavonoids market – Application Analysis
    1. 3.1. Global Flavonoids Market – Application Overview
    2. 3.2. Global Flavonoids Market Share, by Application, 2019 & 2026 (USD Million)
    3. 3.3. Global Flavonoids Market share, by Application, 2019 & 2026 (Tons)
    4. 3.4. Pharmaceutical
      1. 3.4.1. Global Pharmaceutical Flavonoids Market, 2016-2026 (USD Million)
      2. 3.4.2. Global Pharmaceutical Flavonoids Market, 2016-2026 (Tons)
    5. 3.5. Food and Beverages
      1. 3.5.1. Global Food and Beverages Flavonoids Market, 2016-2026 (USD Million)
      2. 3.5.2. Global Food and Beverages Flavonoids Market, 2016-2026 (Tons)
    6. 3.6. Nutraceuticals
      1. 3.6.1. Global Nutraceuticals Flavonoids Market, 2016-2026 (USD Million)
      2. 3.6.2. Global Nutraceuticals Flavonoids Market, 2016-2026 (Tons)
    7. 3.7. Animal Feed
      1. 3.7.1. Global Animal Feed Flavonoids Market, 2016-2026 (USD Million)
      2. 3.7.2. Global Animal Feed Flavonoids Market, 2016-2026 (Tons)
  4. CHAPTER 4. Flavonoids market – Regional Analysis
    1. 4.1. Global Flavonoids Market Regional Overview
    2. 4.2. Global Flavonoids Market Share, by Region, 2019 & 2026 (Value)
    3. 4.3. Global Flavonoids Market Share, by Region, 2019 & 2026 (Volume)
    4. 4.4. North America
      1. 4.4.1. North America Flavonoids Market size and forecast, 2016-2026
      2. 4.4.2. North America Flavonoids Market, by Country, 2019 - 2026 (USD Million)
      3. 4.4.3. North America Market size and forecast, 2016-2026 (Tons)
      4. 4.4.4. North America Flavonoids Market, by Country, 2019 - 2026 (Tons)
      5. 4.4.5. North America Flavonoids Market, by Type, 2016-2026
        1. 4.4.5.1. North America Flavonoids Market, by Type, 2016-2026 (USD Million)
        2. 4.4.5.2. North America Flavonoids Market, by Type, 2016-2026 (Tons)
      6. 4.4.6. North America Flavonoids Market, by Application, 2016-2026
        1. 4.4.6.1. North America Flavonoids Market, by Application, 2016-2026 (USD Million)
        2. 4.4.6.2. North America Flavonoids Market, by Application, 2016-2026 (Tons)
      7. 4.4.7. U.S.
        1. 4.4.7.1. U.S. Market size and forecast, 2016-2026 (USD Million)
        2. 4.4.7.2. U.S. Market size and forecast, 2016-2026 (Tons)
      8. 4.4.8. Canada
        1. 4.4.8.1. Canada Market size and forecast, 2016-2026 (USD Million)
        2. 4.4.8.2. Canada Market size and forecast, 2016-2026 (Tons)
    5. 4.5. Europe
      1. 4.5.1. Europe Flavonoids Market size and forecast, 2016-2026
      2. 4.5.2. Europe Flavonoids Market, by Country, 2019 - 2026 (USD Million)
      3. 4.5.3. Europe Market size and forecast, 2016-2026 (Tons)
      4. 4.5.4. Europe Flavonoids Market, by Country, 2019 - 2026 (Tons)
      5. 4.5.5. Europe Flavonoids Market, by Type, 2016-2026
        1. 4.5.5.1. Europe Flavonoids Market, by Type, 2016-2026 (USD Million)
        2. 4.5.5.2. Europe Flavonoids Market, by Type, 2016-2026 (Tons)
      6. 4.5.6. Europe Flavonoids Market, by Application, 2016-2026
        1. 4.5.6.1. Europe Flavonoids Market, by Application, 2016-2026 (USD Million)
        2. 4.5.6.2. Europe Flavonoids Market, by Application, 2016-2026 (Tons)
      7. 4.5.7. Germany
        1. 4.5.7.1. Germany Market size and forecast, 2016-2026 (USD Million)
        2. 4.5.7.2. Germany Market size and forecast, 2016-2026 (Tons)
      8. 4.5.8. France
        1. 4.5.8.1. France Market size and forecast, 2016-2026 (USD Million)
        2. 4.5.8.2. France Market size and forecast, 2016-2026 (Tons)
      9. 4.5.9. U.K.
        1. 4.5.9.1. U.K. Market size and forecast, 2016-2026 (USD Million)
        2. 4.5.9.2. U.K. Market size and forecast, 2016-2026 (Tons)
      10. 4.5.10. Italy
        1. 4.5.10.1. Italy Market size and forecast, 2016-2026 (USD Million)
        2. 4.5.10.2. Italy Market size and forecast, 2016-2026 (Tons)
      11. 4.5.11. Spain
        1. 4.5.11.1. Spain Market size and forecast, 2016-2026 (USD Million)
        2. 4.5.11.2. Spain Market size and forecast, 2016-2026 (Tons)
      12. 4.5.12. Rest of Europe
        1. 4.5.12.1. Rest of Europe Market size and forecast, 2016-2026 (USD Million)
        2. 4.5.12.2. Rest of Europe Market size and forecast, 2016-2026 (Tons)
    6. 4.6. Asia Pacific
      1. 4.6.1. Asia Pacific Flavonoids Market size and forecast, 2016-2026
      2. 4.6.2. Asia Pacific Flavonoids Market, by Country, 2019 - 2026 (USD Million)
      3. 4.6.3. Asia Pacific Market size and forecast, 2016-2026 (Tons)
      4. 4.6.4. Asia Pacific Flavonoids Market, by Country, 2019 - 2026 (Tons)
      5. 4.6.5. Asia Pacific Flavonoids Market, by Type, 2016-2026
        1. 4.6.5.1. Asia Pacific Flavonoids Market, by Type, 2016-2026 (USD Million)
        2. 4.6.5.2. Asia Pacific Flavonoids Market, by Type, 2016-2026 (Tons)
      6. 4.6.6. Asia Pacific Flavonoids Market, by Application, 2016-2026
        1. 4.6.6.1. Asia Pacific Flavonoids Market, by Application, 2016-2026 (USD Million)
        2. 4.6.6.2. Asia Pacific Flavonoids Market, by Application, 2016-2026 (Tons)
      7. 4.6.7. China
        1. 4.6.7.1. China Market size and forecast, 2016-2026 (USD Million)
        2. 4.6.7.2. China Market size and forecast, 2016-2026 (Tons)
      8. 4.6.8. Japan
        1. 4.6.8.1. Japan Market size and forecast, 2016-2026 (USD Million)
        2. 4.6.8.2. Japan Market size and forecast, 2016-2026 (Tons)
      9. 4.6.9. India
        1. 4.6.9.1. India Market size and forecast, 2016-2026 (USD Million)
        2. 4.6.9.2. India Market size and forecast, 2016-2026 (Tons)
      10. 4.6.10. South Korea
        1. 4.6.10.1. South Korea Market size and forecast, 2016-2026 (USD Million)
        2. 4.6.10.2. South Korea Market size and forecast, 2016-2026 (Tons)
      11. 4.6.11. South-East Asia
        1. 4.6.11.1. South-East Asia Market size and forecast, 2016-2026 (USD Million)
        2. 4.6.11.2. South-East Asia Market size and forecast, 2016-2026 (Tons)
      12. 4.6.12. Rest of Asia Pacific
        1. 4.6.12.1. Rest of Asia Pacific Market size and forecast, 2016-2026 (USD Million)
        2. 4.6.12.2. Rest of Asia Pacific Market size and forecast, 2016-2026 (Tons)
    7. 4.7. Latin America
      1. 4.7.1. Latin America Flavonoids Market size and forecast, 2016-2026
      2. 4.7.2. Latin America Flavonoids Market, by Country, 2019 - 2026 (USD Million)
      3. 4.7.3. Latin America Market size and forecast, 2016-2026 (Tons)
      4. 4.7.4. Latin America Flavonoids Market, by Country, 2019 - 2026 (Tons)
      5. 4.7.5. Latin America Flavonoids Market, by Type, 2016-2026
        1. 4.7.5.1. Latin America Flavonoids Market, by Type, 2016-2026 (USD Million)
        2. 4.7.5.2. Latin America Flavonoids Market, by Type, 2016-2026 (Tons)
      6. 4.7.6. Latin America Flavonoids Market, by Application, 2016-2026
        1. 4.7.6.1. Latin America Flavonoids Market, by Application, 2016-2026 (USD Million)
        2. 4.7.6.2. Latin America Flavonoids Market, by Application, 2016-2026 (Tons)
      7. 4.7.7. Brazil
        1. 4.7.7.1. Brazil Market size and forecast, 2016-2026 (USD Million)
        2. 4.7.7.2. Brazil Market size and forecast, 2016-2026 (Tons)
      8. 4.7.8. Mexico
        1. 4.7.8.1. Mexico Market size and forecast, 2016-2026 (USD Million)
        2. 4.7.8.2. Mexico Market size and forecast, 2016-2026 (Tons)
      9. 4.7.9. Rest of Latin America
        1. 4.7.9.1. Rest of Latin America Market size and forecast, 2016-2026 (USD Million)
        2. 4.7.9.2. Rest of Latin America Market size and forecast, 2016-2026 (Tons)
    8. 4.8. The Middle-East and Africa
      1. 4.8.1. The Middle-East and Africa Flavonoids Market size and forecast, 2016-2026
      2. 4.8.2. The Middle-East and Africa Flavonoids Market, by Country, 2019 - 2026 (USD Million)
      3. 4.8.3. The Middle-East and Africa Market size and forecast, 2016-2026 (Tons)
      4. 4.8.4. The Middle-East and Africa Flavonoids Market, by Country, 2019 - 2026 (Tons)
      5. 4.8.5. The Middle-East and Africa Flavonoids Market, by Type, 2016-2026
        1. 4.8.5.1. The Middle-East and Africa Flavonoids Market, by Type, 2016-2026 (USD Million)
        2. 4.8.5.2. The Middle-East and Africa Flavonoids Market, by Type, 2016-2026 (Tons)
      6. 4.8.6. The Middle-East and Africa Flavonoids Market, by Application, 2016-2026
        1. 4.8.6.1. The Middle-East and Africa Flavonoids Market, by Application, 2016-2026 (USD Million)
        2. 4.8.6.2. The Middle-East and Africa Flavonoids Market, by Application, 2016-2026 (Tons)
      7. 4.8.7. GCC Countries
        1. 4.8.7.1. GCC Countries Market size and forecast, 2016-2026 (USD Million)
        2. 4.8.7.2. GCC Countries Market size and forecast, 2016-2026 (Tons)
      8. 4.8.8. South Africa
        1. 4.8.8.1. South Africa Market size and forecast, 2016-2026 (USD Million)
        2. 4.8.8.2. South Africa Market size and forecast, 2016-2026 (Tons)
      9. 4.8.9. Rest of Middle-East Africa
        1. 4.8.9.1. Rest of Middle-East Africa Market size and forecast, 2016-2026 (USD Million)
        2. 4.8.9.2. Rest of Middle-East Africa Market size and forecast, 2016-2026 (Tons)
  5. CHAPTER 5. Flavonoids Production, Consumption, Export, Import by Regions
    1. 5.1. Global Flavonoids production and revenue, 2016-2026 (USD Million) (Tons)
    2. 5.2. Global Import and Export Analysis, by Region
  6. CHAPTER 6. Flavonoids market – Competitive Landscape
    1. 6.1. Competitor Market Share – Revenue
    2. 6.2. Market Concentration Rate Analysis, Top 3 and Top 5 Players
    3. 6.3. Competitor Market Share – Volume
    4. 6.4. Strategic Development
      1. 6.4.1. Acquisitions and Mergers
      2. 6.4.2. New Products
      3. 6.4.3. Research & Development Activities
  7. CHAPTER 7. Company Profiles
    1. 7.1. Kemin Industries
      1. 7.1.1. Company Overview
      2. 7.1.2. Kemin Industries Sales, Revenue, Price, and Gross Margin
      3. 7.1.3. Product portfolio
      4. 7.1.4. Recent initiatives
    2. 7.2. Foodchem International Corporation
      1. 7.2.1. Company Overview
      2. 7.2.2. Foodchem International Corporation Sales, Revenue, Price, and Gross Margin
      3. 7.2.3. Product portfolio
      4. 7.2.4. Recent initiatives
    3. 7.3. EXTRA SYNTHE SE
      1. 7.3.1. Company Overview
      2. 7.3.2. EXTRA SYNTHE SE Sales, Revenue, Price, and Gross Margin
      3. 7.3.3. Product portfolio
      4. 7.3.4. Recent initiatives
    4. 7.4. Meherrin Agricultural & Chemical Company
      1. 7.4.1. Company Overview
      2. 7.4.2. Meherrin Agricultural & Chemical Company Sales, Revenue, Price, and Gross Margin
      3. 7.4.3. Product portfolio
      4. 7.4.4. Recent initiatives
    5. 7.5. Cayman Chemical Company
      1. 7.5.1. Company Overview
      2. 7.5.2. Cayman Chemical Company Sales, Revenue, Price, and Gross Margin
      3. 7.5.3. Product portfolio
      4. 7.5.4. Recent initiatives
    6. 7.6. Quercegen Pharmaceuticals
      1. 7.6.1. Company Overview
      2. 7.6.2. Quercegen Pharmaceuticals Sales, Revenue, Price, and Gross Margin
      3. 7.6.3. Product portfolio
      4. 7.6.4. Recent initiatives
    7. 7.7. International Flavors and Fragrances
      1. 7.7.1. Company Overview
      2. 7.7.2. International Flavors and Fragrances Sales, Revenue, Price, and Gross Margin
      3. 7.7.3. Product portfolio
      4. 7.7.4. Recent initiatives
    8. 7.8. Aquapharm Bio-Discovery Limited
      1. 7.8.1. Company Overview
      2. 7.8.2. Aquapharm Bio-Discovery Limited Sales, Revenue, Price, and Gross Margin
      3. 7.8.3. Product portfolio
      4. 7.8.4. Recent initiatives
    9. 7.9. Indofine Chemical Company Inc
      1. 7.9.1. Company Overview
      2. 7.9.2. Indofine Chemical Company Inc Sales, Revenue, Price, and Gross Margin
      3. 7.9.3. Product portfolio
      4. 7.9.4. Recent initiatives
  8. CHAPTER 8. Flavonoids — Industry Analysis
    1. 8.1. Introduction and Taxonomy
    2. 8.2. Flavonoids Market – Key Trends
      1. 8.2.1. Market Drivers
      2. 8.2.2. Market Restraints
      3. 8.2.3. Market Opportunities
    3. 8.3. Value Chain Analysis
    4. 8.4. Key Mandates and Regulations
    5. 8.5. Technology Roadmap and Timeline
    6. 8.6. Flavonoids market – Attractiveness Analysis
      1. 8.6.1. By Type
      2. 8.6.2. By Application
      3. 8.6.3. By Region
  9. CHAPTER 9. Raw Material analysis
    1. 9.1. Flavonoids Key Raw Material Analysis
      1. 9.1.1. Key Raw Materials
      2. 9.1.2. Price Trend of Key Raw Materials
    2. 9.2. Key Suppliers of Raw Materials
    3. 9.3. Proportion of Manufacturing Cost Structure
      1. 9.3.1. Raw Materials
      2. 9.3.2. Labor Cost
    4. 9.4. Manufacturing Expenses Analysis of Flavonoids
  10. CHAPTER 10. Industrial Chain, Sourcing Strategy and Downstream Buyers
    1. 10.1. Flavonoids Industrial Chain Analysis
    2. 10.2. Upstream Raw Materials Sourcing
      1. 10.2.1. Risk Mitigation:
      2. 10.2.2. Supplier Relationships:
      3. 10.2.3. Business Processes:
      4. 10.2.4. Securing the Product:
    3. 10.3. Raw Materials Sources of Flavonoids Major Manufacturers in 2016
    4. 10.4. Downstream Buyers
    5. 10.5. Distributors/Traders List
  11. CHAPTER 11. Marketing Strategy Analysis, Distributors
    1. 11.1. Marketing Channel
    2. 11.2. Direct Marketing
    3. 11.3. Indirect Marketing
    4. 11.4. Marketing Channel Development Trend
    5. 11.5. Economic/Political Environmental Change
  12. CHAPTER 12. Report Conclusion
  13. CHAPTER 13. Research Approach & Methodology
    1. 13.1. Report Description
    2. 13.2. Research Scope
    3. 13.3. Research Methodology
      1. 13.3.1. Secondary Research
      2. 13.3.2. Primary Research
      3. 13.3.3. Models
        1. 13.3.3.1. Company Share Analysis Model
        2. 13.3.3.2. Revenue Based Modeling
        3. 13.3.3.3. Research Limitations

        List of Figures

        FIG. 1 Global Flavonoids Market, 2016-2026 (USD Million)
        FIG. 2 Global Flavonoids Market Share, by Type, 2019 & 2026 (USD Million)
        FIG. 3 Global Flavonoids Market share, by Type, 2019 & 2026 (Tons)
        FIG. 4 Global Anthocyanins Flavonoids Market, 2016-2026 (USD Million)
        FIG. 5 Global Anthocyanins Flavonoids  Market, 2016-2026 (Tons)
        FIG. 6 Global Flavones Flavonoids Market, 2016-2026 (USD Million)
        FIG. 7 Global Flavones Flavonoids  Market, 2016-2026 (Tons)
        FIG. 8 Global Anthoxanthins Flavonoids Market, 2016-2026 (USD Million)
        FIG. 9 Global Anthoxanthins Flavonoids  Market, 2016-2026 (Tons)
        FIG. 10 Global Isoflavonens Flavonoids Market, 2016-2026 (USD Million)
        FIG. 11 Global Isoflavonens Flavonoids  Market, 2016-2026 (Tons)
        FIG. 12 Global Chalcones Flavonoids Market, 2016-2026 (USD Million)
        FIG. 13 Global Chalcones Flavonoids  Market, 2016-2026 (Tons)
        FIG. 14 Global Flavonoids Market Share, by Application, 2019 & 2026 (USD Million)
        FIG. 15 Global Flavonoids Market share, by Application, 2019 & 2026 (Tons)
        FIG. 16 Global Pharmaceutical Flavonoids Market, 2016-2026 (USD Million)
        FIG. 17 Global Pharmaceutical Flavonoids  Market, 2016-2026 (Tons)
        FIG. 18 Global Food and Beverages Flavonoids Market, 2016-2026 (USD Million)
        FIG. 19 Global Food and Beverages Flavonoids  Market, 2016-2026 (Tons)
        FIG. 20 Global Nutraceuticals Flavonoids Market, 2016-2026 (USD Million)
        FIG. 21 Global Nutraceuticals Flavonoids  Market, 2016-2026 (Tons)
        FIG. 22 Global Animal Feed Flavonoids Market, 2016-2026 (USD Million)
        FIG. 23 Global Animal Feed Flavonoids  Market, 2016-2026 (Tons)
        FIG. 24 Global Flavonoids Market Share, by Region, 2019 & 2026
        FIG. 25 Global Flavonoids Market Share, by Region, 2019 & 2026
        FIG. 26 North America Flavonoids Market, 2016-2026
        FIG. 27 North America Flavonoids  Market, 2016-2026 (Tons)
        FIG. 28 U.S. Flavonoids Market, 2016-2026
        FIG. 29 U.S. Flavonoids  Market, 2016-2026 (Tons)
        FIG. 30 Canada Flavonoids Market, 2016-2026
        FIG. 31 Canada Flavonoids  Market, 2016-2026 (Tons)
        FIG. 32 Europe Flavonoids Market, 2016-2026
        FIG. 33 Europe Flavonoids  Market, 2016-2026 (Tons)
        FIG. 34 Germany Flavonoids Market, 2016-2026
        FIG. 35 Germany Flavonoids  Market, 2016-2026 (Tons)
        FIG. 36 France Flavonoids Market, 2016-2026
        FIG. 37 France Flavonoids  Market, 2016-2026 (Tons)
        FIG. 38 U.K. Flavonoids Market, 2016-2026
        FIG. 39 U.K. Flavonoids  Market, 2016-2026 (Tons)
        FIG. 40 Italy Flavonoids Market, 2016-2026
        FIG. 41 Italy Flavonoids  Market, 2016-2026 (Tons)
        FIG. 42 Spain Flavonoids Market, 2016-2026
        FIG. 43 Spain Flavonoids  Market, 2016-2026 (Tons)
        FIG. 44 Rest of Europe Flavonoids Market, 2016-2026
        FIG. 45 Rest of Europe Flavonoids  Market, 2016-2026 (Tons)
        FIG. 46 Asia Pacific Flavonoids Market, 2016-2026
        FIG. 47 Asia Pacific Flavonoids  Market, 2016-2026 (Tons)
        FIG. 48 China Flavonoids Market, 2016-2026
        FIG. 49 China Flavonoids  Market, 2016-2026 (Tons)
        FIG. 50 Japan Flavonoids Market, 2016-2026
        FIG. 51 Japan Flavonoids  Market, 2016-2026 (Tons)
        FIG. 52 India Flavonoids Market, 2016-2026
        FIG. 53 India Flavonoids  Market, 2016-2026 (Tons)
        FIG. 54 South  Korea Flavonoids Market, 2016-2026
        FIG. 55 South  Korea Flavonoids  Market, 2016-2026 (Tons)
        FIG. 56 South-East Asia Flavonoids Market, 2016-2026
        FIG. 57 South-East Asia Flavonoids  Market, 2016-2026 (Tons)
        FIG. 58 Rest of Asia Pacific Flavonoids Market, 2016-2026
        FIG. 59 Rest of Asia Pacific Flavonoids  Market, 2016-2026 (Tons)
        FIG. 60 Latin America Flavonoids Market, 2016-2026
        FIG. 61 Latin America Flavonoids  Market, 2016-2026 (Tons)
        FIG. 62 Brazil Flavonoids Market, 2016-2026
        FIG. 63 Brazil Flavonoids  Market, 2016-2026 (Tons)
        FIG. 64 Mexico Flavonoids Market, 2016-2026
        FIG. 65 Mexico Flavonoids  Market, 2016-2026 (Tons)
        FIG. 66 Rest of Latin America Flavonoids Market, 2016-2026
        FIG. 67 Rest of Latin America Flavonoids  Market, 2016-2026 (Tons)
        FIG. 68 The Middle-East and Africa Flavonoids Market, 2016-2026
        FIG. 69 The Middle-East and Africa Flavonoids  Market, 2016-2026 (Tons)
        FIG. 70 GCC Countries Flavonoids Market, 2016-2026
        FIG. 71 GCC Countries Flavonoids  Market, 2016-2026 (Tons)
        FIG. 72 South Africa Flavonoids Market, 2016-2026
        FIG. 73 South Africa Flavonoids  Market, 2016-2026 (Tons)
        FIG. 74 Rest of Middle-East Africa Flavonoids Market, 2016-2026
        FIG. 75 Rest of Middle-East Africa Flavonoids  Market, 2016-2026 (Tons)
        FIG. 76 Global Flavonoids production and revenue, 2016-2026 (USD Million) (Tons)
        FIG. 77 North America Flavonoids production and revenue, 2016-2026 (USD Million) (Tons)
        FIG. 78 Europe Flavonoids production and revenue, 2016-2026 (USD Million) (Tons)
        FIG. 79 Asia Pacific Flavonoids production and revenue, 2016-2026 (USD Million) (Tons)
        FIG. 80 Latin America Flavonoids production and revenue, 2016-2026 (USD Million) (Tons)
        FIG. 81 Middle East and Africa Flavonoids production and revenue, 2016-2026 (USD Million) (Tons)
        FIG. 82 Competitor Market Share – Revenue
        FIG. 83 Competitor Market Share – Volume
        FIG. 84 Kemin Industries Revenue and Growth Rate
        FIG. 85 Kemin Industries Market Share
        FIG. 86 Foodchem International Corporation Revenue and Growth Rate
        FIG. 87 Foodchem International Corporation Market Share
        FIG. 88 EXTRA SYNTHE SE Revenue and Growth Rate
        FIG. 89 EXTRA SYNTHE SE Market Share
        FIG. 90 Meherrin Agricultural & Chemical Company Revenue and Growth Rate
        FIG. 91 Meherrin Agricultural & Chemical Company Market Share
        FIG. 92 Cayman Chemical Company Revenue and Growth Rate
        FIG. 93 Cayman Chemical Company Market Share
        FIG. 94 Quercegen Pharmaceuticals Revenue and Growth Rate
        FIG. 95 Quercegen Pharmaceuticals Market Share
        FIG. 96 International Flavors and Fragrances Revenue and Growth Rate
        FIG. 97 International Flavors and Fragrances Market Share
        FIG. 98 Aquapharm Bio-Discovery Limited Revenue and Growth Rate
        FIG. 99 Aquapharm Bio-Discovery Limited Market Share
        FIG. 100 Indofine Chemical Company Inc Revenue and Growth Rate
        FIG. 101 Indofine Chemical Company Inc Market Share
        FIG. 102 Market Dynamics
        FIG. 103 Global Flavonoids – Value Chain Analysis
        FIG. 104 Key Mandates and Regulations
        FIG. 105 Technology Roadmap and Timeline
        FIG. 106 Market Attractiveness Analysis – By Type
        FIG. 107 Market Attractiveness Analysis – By Application
        FIG. 108 Market Attractiveness Analysis – By Region
        FIG. 109 Manufacturing Cost Structure of Flavonoids
        FIG. 110 Flavonoids Industrial Chain Analysis
        FIG. 111 Market Channel
        FIG. 112 Marketing Channel Development Trend
        FIG. 113 Growth in World Gross Product, 2008-2019

        List of Tables

        TABLE 1 Global Flavonoids market, 2019 & 2026 (USD Million)
        TABLE 2 Global Flavonoids market, by Type, 2016-2026 (USD Million)
        TABLE 3 Global Flavonoids market, by Type, 2016-2026 (Tons)
        TABLE 4 Global Flavonoids market, by Application, 2016-2026 (USD Million)
        TABLE 5 Global Flavonoids market, by Application, 2016-2026 (Tons)
        TABLE 6 Global Flavonoids market, by region, 2016-2026 (USD Million)
        TABLE 7 Global Flavonoids market, by region, 2016-2026 (Tons)
        TABLE 8 North America Flavonoids Market, by Type, 2016-2026 (USD Million)
        TABLE 9 North America Flavonoids Market, by Type, 2016-2026 (Tons)
        TABLE 10 North America Flavonoids Market, by Application, 2016-2026 (USD Million)
        TABLE 11 North America Flavonoids Market, by Application, 2016-2026 (Tons)
        TABLE 12 Europe Flavonoids Market, by Type, 2016-2026 (USD Million)
        TABLE 13 Europe Flavonoids Market, by Type, 2016-2026 (Tons)
        TABLE 14 Europe Flavonoids Market, by Application, 2016-2026 (USD Million)
        TABLE 15 Europe Flavonoids Market, by Application, 2016-2026 (Tons)
        TABLE 16 Asia Pacific Flavonoids Market, by Type, 2016-2026 (USD Million)
        TABLE 17 Asia Pacific Flavonoids Market, by Type, 2016-2026 (Tons)
        TABLE 18 Asia Pacific Flavonoids Market, by Application, 2016-2026 (USD Million)
        TABLE 19 Asia Pacific Flavonoids Market, by Application, 2016-2026 (Tons)
        TABLE 20 Latin America Flavonoids Market, by Type, 2016-2026 (USD Million)
        TABLE 21 Latin America Flavonoids Market, by Type, 2016-2026 (Tons)
        TABLE 22 Latin America Flavonoids Market, by Application, 2016-2026 (USD Million)
        TABLE 23 Latin America Flavonoids Market, by Application, 2016-2026 (Tons)
        TABLE 24 The Middle-East and Africa Flavonoids Market, by Type, 2016-2026 (USD Million)
        TABLE 25 The Middle-East and Africa Flavonoids Market, by Type, 2016-2026 (Tons)
        TABLE 26 The Middle-East and Africa Flavonoids Market, by Application, 2016-2026 (USD Million)
        TABLE 27 The Middle-East and Africa Flavonoids Market, by Application, 2016-2026 (Tons)
        TABLE 28 North America Flavonoids Production, Consumption, Export, Import, 2016-2019
        TABLE 29 Europe Flavonoids Production, Consumption, Export, Import, 2016-2019
        TABLE 30 Asia Pacific Flavonoids Production, Consumption, Export, Import, 2016-2019
        TABLE 31 Latin America Flavonoids Production, Consumption, Export, Import, 2016-2019
        TABLE 32 Middle East & Africa Flavonoids Production, Consumption, Export, Import, 2016-2019
        TABLE 33 Global Flavonoids Market - Company Revenue Analysis 2016-2019 (USD Million)
        TABLE 34 Global Flavonoids Market - Company Revenue Share Analysis 2016-2019(%)
        TABLE 35 Global Flavonoids Market - Company Volume Analysis 2016-2019 (Tons)
        TABLE 36 Global Flavonoids Market - Company Volume Share Analysis 2016-2019(%)
        TABLE 37 Acquisitions and Mergers
        TABLE 38 New Product/Service Launch
        TABLE 39 Research & Development Activities
        TABLE 40 Market Drivers
        TABLE 41 Market Restraints
        TABLE 42 Market Opportunities
        TABLE 43 Production Base and Market Concentration Rate of Raw Material
        TABLE 44 Key Suppliers of Raw Materials
        TABLE 45 Raw Materials Sources of Flavonoids Major Manufacturers in 2016
        TABLE 46 Major Buyers of Flavonoids
        TABLE 47 Distributors/Traders of Flavonoids by Region

Industry Major Market Players

  •  Foodchem International Corporation
  •  Meherrin Agricultural & Chemical Company
  •  Quercegen Pharmaceuticals
  •  Aquapharm Bio-Discovery Limited
  •  Indofine Chemical Company Inc
  •  Kemin Industries
  •  EXTRA SYNTHE SE
  •  Cayman Chemical Company
  •  International Flavors and Fragrances