Search Market Research Report

Discover Our Latest Reports
Discover Our Featured Reports
Discover Top Selling Reports

Fault Indicators Market Size, Share Global Analysis Report, 2019–2026

report img

Fault Indicators Market By Product Type (Overhead Line Fault Indicators, Cable Fault Indicators, Underground Fault Indicators and Others), and By Application (Construction and Mining Industry, Automobiles, Equipment Manufacturing Industry, Military and Aerospace, Chemical and Pharmaceutical Industry, Power Industry and Others): Global Industry Perspective, Market Size, Statistical Research, Market Intelligence, Comprehensive Analysis, Historical Trends, and Forecast 2019–2026

Industry Insights

This professional and specialized report study examines the technical and business perspective of the Fault Indicators industry. The report provides a historical analysis of the industry as well as the projected trends expected to be witnessed in the Fault Indicators Market. The report study analyzes the market statistics at the global as well as the regional levels to gain an in-depth perspective of the overall Fault Indicators Market.

The historical insights are provided from 2016 to 2019 and projected trends are provided from 2020 to 2026. The quantitative data is provided in terms of both volumes (Thousand Units) and value (USD Million) for 2016 – 2026. The qualitative data is reinforced by analyzing and providing numerous market dynamics (directly or indirectly affecting the industry) such as growth drivers, restraints, challenges, and opportunities.

Fault Indicators Market Size

To know more about this report | Request Free Sample Copy

logoKey Insights from Primary Research

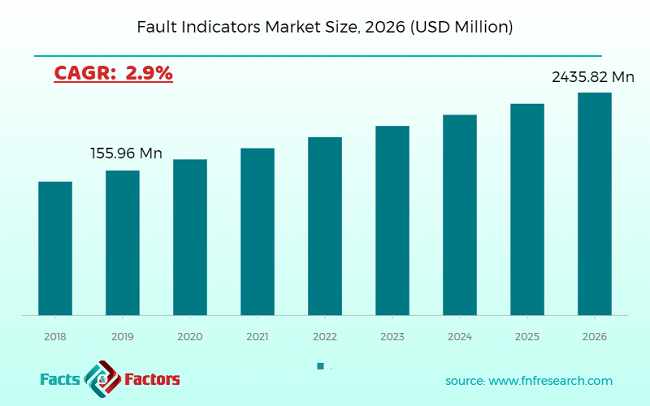
  • Our primary respondents believe the market to witness a steady growth of 2.9% over the forecast period on account of the rising need for efficient and safe electricity requirements around the globe.
  • Most of the CXOs predict the equipment manufacturing industry to maintain its dominance throughout 2026 due to the increase need for high capacity and efficient short circuit indicators. Furthermore, the manufacturers operating in this market are partnering with local and domestic players to increase their goodwill in the ever-competitive market ecosystem.
  • Some of the industry experts interviewed in the Asia Pacific revealed that the underground fault indicators type is expected to generate considerable revenues for the Fault indicators industry.
  • Regionally, Asia Pacific is expected to contribute largely to the global Fault indicators market. Some of the interviewees said that their future plans are to focus majorly on innovating in features of fault indicator device application areas. The manufacturers operating in countries such as China and India are expected to create higher adoption opportunities for the Fault indicators market.
  • The information & technology subject matter experts suggest investing in R&D activities to come up with newer, economic and more efficient Fault indicators. They believe advanced technology in the medical industry will witness widespread acceptance across the value chain of the Fault indicators market.

logoKey Recommendations from Analysts

  • Our analysts recommend focusing on the Asia Pacific Fault indicators market since their calculations revealed that this region turned out to be the top investment pocket across the globe owing to greater opportunities in countries such as India and China.
  • The major reason behind the upsurge growth and lucrative opportunities underlying in this region is the rising need for high volume electricity across the globe in several industry verticals.
  • Europe, on the other hand, is expected to foresee a robust growth of around 2.5% per annum. This is majorly attributed to rising equipment manufacturers requiring safe electricity measures in countries such as Germany, France, Netherland, and others.
  • The strategic mergers and acquisitions by key industry players and high demand across end-use industries is anticipated to fuel the market growth
  • The executive summary of the report reads the total incremental opportunity underlying in the global Fault indicators market is nearly USD 184.91 million between 2020 and 2026.

Fault Indicators Market

To know more about this report | Request Free Sample Copy

logoFault Indicators Market

Fault Indicators Market

To know more about this report | Request Free Sample Copy

We have included various industry analysis models in our report and extensively demonstrated the key business strategies and competitive landscape of the Fault Indicators Market in our study.

Our study also includes an analysis of Porter’s Five Forces framework for understanding the competitive strategies adopted by various stakeholders involved in the entire value chain of the Fault Indicators Market. It also encompasses PESTLE analysis and SWOT analysis.

The report also offers an in-depth analysis of the market shares of each industry player and gives an outline of the market position of key players in the Fault Indicators Market. Moreover, the study offers wide coverage of key strategic advances witnessed in the market such as new product launches, acquisitions & mergers, collaborations & joint ventures, funding & VC activities, agreements, partnerships, R&D activities, and regional expansion of key players of the Fault Indicators Market.

The research study provides a critical assessment of the Fault Indicators industry by logically segmenting the market on the basis of product type, connectivity, port, distribution channel, and regions. Based on the past, present, and future trends, all the segments were analyzed from the bottom up, and the market sizes have been estimated from 2020 to 2026. The regional segmentation of the Fault Indicators industry includes the holistic bifurcation of all the five major continents including North America, Europe, Asia Pacific, Latin America, and the Middle East & Africa.

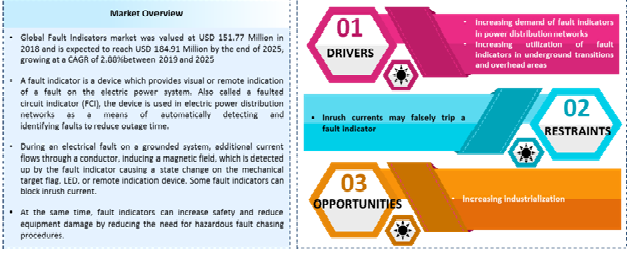
Fault indicators are devices used to detect short circuits in electric networks.

The primary aim of the fault indicator device is to enhance safety by indicating circuit faults. Once the fault indicator detects a short circuit in the system, the alarms and hazards lights are flashed; this information is transferred to the control system where appropriate actions can be taken to avoid any damage. These devices range in various voltages to indicate high as well as low power electric short circuits.

Fault indicators are expected to eliminate any hazardous incident due to short circuits by enhancing the safety of the electric supply network. This is one of the major reasons for the growth of the fault indicator market.

Fault Indicators provide multiple advantages such as result accuracy, time efficiency; accelerate R&D, human error elimination, reduced labor costs, and others. The complete process involving sample testing, data analysis and verification of sample tests becomes highly easier with automation processes.

Furthermore, these devices require high initial investment and maintenance this has created a limitation for the growth of the Fault Indicators market. However, Fault Indicators manufacturers are engaged in expanding their business presence by catering to wide industry verticals by introducing high capacity fault indicators.

The Fault Indicators Market is categorized into by product type and by the application. The product type segment is further divided into Overhead Line Fault Indicators, Cable Fault Indicators, Underground Fault Indicators and Others. By Application, the market is divided Construction and Mining Industry, Automobiles, Equipment Manufacturing Industry, Military and Aerospace, Chemical and Pharmaceutical Industry, Power Industry and Others.

logoReport Scope

Report Attribute

Details

Market Size in 2019

USD 155.96 Mn

Projected Market Size in 2026

USD 184.91 Mn

CAGR Growth Rate

2.9% CAGR

Base Year

2019

Forecast Years

2019-2026

Key Market Players

Dipl. Ing. H. Horstmann GmbH, SEL, Cooper Power Systems (Acquired by Eaton), Megacon, Suparule Systems Ltd., Elektro-Mechanik GMBH, Siemens, Bowden Bros Ltd, ABB Group, Schneider Electric, Nortroll AS, CelsaMessgeräte GmbH, ELECTRONSYSTEM MD srl, Littelfuse, Streamer Electric, Franklin Electric Grid Solution, Beijing HCRT Electrical Equipment, Creative Distribution Automation Co., Ltd. (CREAT) , Sentient Energy, Inc., Tollgrade Communications, Inc.and others.

Key Segment

By product type, By Application, By Region

Major Regions Covered

North America, Europe, Asia Pacific, Latin America, and the Middle East & Africa

Purchase Options

Request customized purchase options to meet your research needs. Explore purchase options

logoSome of the key players operating in the Fault Indicators Market around the globe include: 

  •  Dipl. Ing. H. Horstmann GmbH
  •  SEL
  •  Cooper Power Systems (Acquired by Eaton)
  •  Megacon
  •  Suparule Systems Ltd.
  •  Elektro-Mechanik GMBH
  •  Siemens
  •  Bowden Bros Ltd
  •  ABB Group
  •  Schneider Electric
  •  Nortroll AS
  •  Celsa Messgeräte GmbH
  •  ELECTRONSYSTEM MD srl
  •  Littelfuse
  •  Streamer Electric
  •  Franklin Electric Grid Solution
  •  Beijing HCRT Electrical Equipment
  •  Creative Distribution Automation Co.Ltd. (CREAT) 
  •  Sentient Energy Inc.
  •  Tollgrade Communications Inc.

The taxonomy of the Fault Indicators industry by its scope and segmentation is as follows:

logo By product type Segmentation Analysis

  • Overhead Line Fault Indicators
  • Cable Fault Indicators
  • Underground Fault Indicators
  • Others

logo By Application Segmentation Analysis

  • Construction and Mining Industry
  • Automobiles
  • Equipment Manufacturing Industry
  • Military and Aerospace
  • Chemical and Pharmaceutical Industry
  • Power Industry
  • Others

logo Regional Segmentation Analysis

  • North America
    • The U.S.
    • Canada
  • Europe
    • France
    • The UK
    • Spain
    • Germany
    • Italy
    • Rest of Europe
  • Asia Pacific
    • China
    • Japan
    • India
    • South Korea
    • Southeast Asia
    • Rest of Asia Pacific
  • Latin America
    • Brazil
    • Mexico
    • Rest of Latin America
  • Middle East & Africa
    • GCC
    • South Africa
    • Rest of Middle East & Africa

logoKEY BUSINESS POINTERS ADDRESSED & FOREMOST REASONS TO PROCURE THE REPORT:

  • Statistical Analysis of the Past, Current, and Future Trends of the Industry with Validated Market Sizes Data
  • Direct and Indirect Rationales Impacting the Industry
  • In-depth and Micro Analysis of Viable Segments and Sub-segments
  • Companies and Vendors Market Share, Competitive Landscape, and Player Positioning Analysis
  • Demand Side (Consumption) and Supply Side (Production) Perspective and Analysis wherever applicable
  • Key Buyers and End-Users Analysis
  • Value Chain and Manufacturing Cost Structure Analysis wherever relevant
  • Key Marketing Strategies as well as Key Sales Channels adopted in the market
  • Investment Opportunity Analysis & Patents Analysis wherever feasible
  • Technological Road Map & Technical Analysis
  • Robust Research Methodology comprising dynamic mix (65%~35%) of Extensive Primary Research (primary interviews, ad-hoc surveys, questionnaires) and Protracted Secondary Research (proprietary in-house database, paid external databases, publically available validated sources)

Table of Content

  1. CHAPTER 1. Executive Summary
  2. CHAPTER 2. Fault Indicators market – Product Analysis
    1. 2.1. Global Fault Indicators Market – Product Overview
    2. 2.2. Global Fault Indicators Market Share, by Product, 2018 & 2025 (USD Million)
    3. 2.3. Global Fault Indicators Market share, by Product, 2018 & 2025 (Thousand Units)
    4. 2.4. Overhead Line Fault Indicators
      1. 2.4.1. Global Overhead Line Fault Indicators Fault Indicators Market, 2016-2026 (USD Million)
      2. 2.4.2. Global Overhead Line Fault Indicators Fault Indicators Market, 2016-2026 (Thousand Units)
    5. 2.5. Cable Fault Indicators
      1. 2.5.1. Global Cable Fault Indicators Fault Indicators Market, 2016-2026 (USD Million)
      2. 2.5.2. Global Cable Fault Indicators Fault Indicators Market, 2016-2026 (Thousand Units)
    6. 2.6. Underground Fault Indicators
      1. 2.6.1. Global Underground Fault Indicators Fault Indicators Market, 2016-2026 (USD Million)
      2. 2.6.2. Global Underground Fault Indicators Fault Indicators Market, 2016-2026 (Thousand Units)
    7. 2.7. Others
      1. 2.7.1. Global Others Fault Indicators Market, 2016-2026 (USD Million)
      2. 2.7.2. Global Others Fault Indicators Market, 2016-2026 (Thousand Units)
  3. CHAPTER 3. Fault Indicators market – Application Analysis
    1. 3.1. Global Fault Indicators Market – Application Overview
    2. 3.2. Global Fault Indicators Market Share, by Application, 2018 & 2025 (USD Million)
    3. 3.3. Global Fault Indicators Market share, by Application, 2018 & 2025 (Thousand Units)
    4. 3.4. Construction and Mining Industry
      1. 3.4.1. Global Construction and Mining Industry Fault Indicators Market, 2016-2026 (USD Million)
      2. 3.4.2. Global Construction and Mining Industry Fault Indicators Market, 2016-2026 (Thousand Units)
    5. 3.5. Automobiles
      1. 3.5.1. Global Automobiles Fault Indicators Market, 2016-2026 (USD Million)
      2. 3.5.2. Global Automobiles Fault Indicators Market, 2016-2026 (Thousand Units)
    6. 3.6. Equipment Manufacturing Industry
      1. 3.6.1. Global Equipment Manufacturing Industry Fault Indicators Market, 2016-2026 (USD Million)
      2. 3.6.2. Global Equipment Manufacturing Industry Fault Indicators Market, 2016-2026 (Thousand Units)
    7. 3.7. Military and Aerospace
      1. 3.7.1. Global Military and Aerospace Fault Indicators Market, 2016-2026 (USD Million)
      2. 3.7.2. Global Military and Aerospace Fault Indicators Market, 2016-2026 (Thousand Units)
    8. 3.8. Chemical and Pharmaceutical Industry
      1. 3.8.1. Global Chemical and Pharmaceutical Industry Fault Indicators Market, 2016-2026 (USD Million)
      2. 3.8.2. Global Chemical and Pharmaceutical Industry Fault Indicators Market, 2016-2026 (Thousand Units)
    9. 3.9. Power Industry
      1. 3.9.1. Global Power Industry Fault Indicators Market, 2016-2026 (USD Million)
      2. 3.9.2. Global Power Industry Fault Indicators Market, 2016-2026 (Thousand Units)
    10. 3.10. Others
      1. 3.10.1. Global Others Fault Indicators Market, 2016-2026 (USD Million)
      2. 3.10.2. Global Others Fault Indicators Market, 2016-2026 (Thousand Units)
  4. CHAPTER 4. Fault Indicators market – Regional Analysis
    1. 4.1. Global Fault Indicators Market Regional Overview
    2. 4.2. Global Fault Indicators Market Share, by Region, 2018 & 2025 (Value)
    3. 4.3. Global Fault Indicators Market Share, by Region, 2018 & 2025 (Volume)
    4. 4.4. North America
      1. 4.4.1. North America Fault Indicators Market size and forecast, 2016-2026
      2. 4.4.2. North America Fault Indicators Market, by Country, 2018 - 2025 (USD Million)
      3. 4.4.3. North America Market size and forecast, 2016-2026 (Thousand Units)
      4. 4.4.4. North America Fault Indicators Market, by Country, 2018 - 2025 (Thousand Units)
      5. 4.4.5. North America Fault Indicators Market, by Product, 2016-2026
        1. 4.4.5.1. North America Fault Indicators Market, by Product, 2016-2026 (USD Million)
        2. 4.4.5.2. North America Fault Indicators Market, by Product, 2016-2026 (Thousand Units)
      6. 4.4.6. North America Fault Indicators Market, by Application, 2016-2026
        1. 4.4.6.1. North America Fault Indicators Market, by Application, 2016-2026 (USD Million)
        2. 4.4.6.2. North America Fault Indicators Market, by Application, 2016-2026 (Thousand Units)
      7. 4.4.7. U.S.
        1. 4.4.7.1. U.S. Market size and forecast, 2016-2026 (USD Million)
        2. 4.4.7.2. U.S. Market size and forecast, 2016-2026 (Thousand Units)
      8. 4.4.8. Canada
        1. 4.4.8.1. Canada Market size and forecast, 2016-2026 (USD Million)
        2. 4.4.8.2. Canada Market size and forecast, 2016-2026 (Thousand Units)
    5. 4.5. Europe
      1. 4.5.1. Europe Fault Indicators Market size and forecast, 2016-2026
      2. 4.5.2. Europe Fault Indicators Market, by Country, 2018 - 2025 (USD Million)
      3. 4.5.3. Europe Market size and forecast, 2016-2026 (Thousand Units)
      4. 4.5.4. Europe Fault Indicators Market, by Country, 2018 - 2025 (Thousand Units)
      5. 4.5.5. Europe Fault Indicators Market, by Product, 2016-2026
        1. 4.5.5.1. Europe Fault Indicators Market, by Product, 2016-2026 (USD Million)
        2. 4.5.5.2. Europe Fault Indicators Market, by Product, 2016-2026 (Thousand Units)
      6. 4.5.6. Europe Fault Indicators Market, by Application, 2016-2026
        1. 4.5.6.1. Europe Fault Indicators Market, by Application, 2016-2026 (USD Million)
        2. 4.5.6.2. Europe Fault Indicators Market, by Application, 2016-2026 (Thousand Units)
      7. 4.5.7. Germany
        1. 4.5.7.1. Germany Market size and forecast, 2016-2026 (USD Million)
        2. 4.5.7.2. Germany Market size and forecast, 2016-2026 (Thousand Units)
      8. 4.5.8. France
        1. 4.5.8.1. France Market size and forecast, 2016-2026 (USD Million)
        2. 4.5.8.2. France Market size and forecast, 2016-2026 (Thousand Units)
      9. 4.5.9. U.K.
        1. 4.5.9.1. U.K. Market size and forecast, 2016-2026 (USD Million)
        2. 4.5.9.2. U.K. Market size and forecast, 2016-2026 (Thousand Units)
      10. 4.5.10. Italy
        1. 4.5.10.1. Italy Market size and forecast, 2016-2026 (USD Million)
        2. 4.5.10.2. Italy Market size and forecast, 2016-2026 (Thousand Units)
      11. 4.5.11. Spain
        1. 4.5.11.1. Spain Market size and forecast, 2016-2026 (USD Million)
        2. 4.5.11.2. Spain Market size and forecast, 2016-2026 (Thousand Units)
      12. 4.5.12. Rest of Europe
        1. 4.5.12.1. Rest of Europe Market size and forecast, 2016-2026 (USD Million)
        2. 4.5.12.2. Rest of Europe Market size and forecast, 2016-2026 (Thousand Units)
    6. 4.6. Asia Pacific
      1. 4.6.1. Asia Pacific Fault Indicators Market size and forecast, 2016-2026
      2. 4.6.2. Asia Pacific Fault Indicators Market, by Country, 2018 - 2025 (USD Million)
      3. 4.6.3. Asia Pacific Market size and forecast, 2016-2026 (Thousand Units)
      4. 4.6.4. Asia Pacific Fault Indicators Market, by Country, 2018 - 2025 (Thousand Units)
      5. 4.6.5. Asia Pacific Fault Indicators Market, by Product, 2016-2026
        1. 4.6.5.1. Asia Pacific Fault Indicators Market, by Product, 2016-2026 (USD Million)
        2. 4.6.5.2. Asia Pacific Fault Indicators Market, by Product, 2016-2026 (Thousand Units)
      6. 4.6.6. Asia Pacific Fault Indicators Market, by Application, 2016-2026
        1. 4.6.6.1. Asia Pacific Fault Indicators Market, by Application, 2016-2026 (USD Million)
        2. 4.6.6.2. Asia Pacific Fault Indicators Market, by Application, 2016-2026 (Thousand Units)
      7. 4.6.7. China
        1. 4.6.7.1. China Market size and forecast, 2016-2026 (USD Million)
        2. 4.6.7.2. China Market size and forecast, 2016-2026 (Thousand Units)
      8. 4.6.8. Japan
        1. 4.6.8.1. Japan Market size and forecast, 2016-2026 (USD Million)
        2. 4.6.8.2. Japan Market size and forecast, 2016-2026 (Thousand Units)
      9. 4.6.9. India
        1. 4.6.9.1. India Market size and forecast, 2016-2026 (USD Million)
        2. 4.6.9.2. India Market size and forecast, 2016-2026 (Thousand Units)
      10. 4.6.10. South Korea
        1. 4.6.10.1. South Korea Market size and forecast, 2016-2026 (USD Million)
        2. 4.6.10.2. South Korea Market size and forecast, 2016-2026 (Thousand Units)
      11. 4.6.11. South-East Asia
        1. 4.6.11.1. South-East Asia Market size and forecast, 2016-2026 (USD Million)
        2. 4.6.11.2. South-East Asia Market size and forecast, 2016-2026 (Thousand Units)
      12. 4.6.12. Rest of Asia Pacific
        1. 4.6.12.1. Rest of Asia Pacific Market size and forecast, 2016-2026 (USD Million)
        2. 4.6.12.2. Rest of Asia Pacific Market size and forecast, 2016-2026 (Thousand Units)
    7. 4.7. Latin America
      1. 4.7.1. Latin America Fault Indicators Market size and forecast, 2016-2026
      2. 4.7.2. Latin America Fault Indicators Market, by Country, 2018 - 2025 (USD Million)
      3. 4.7.3. Latin America Market size and forecast, 2016-2026 (Thousand Units)
      4. 4.7.4. Latin America Fault Indicators Market, by Country, 2018 - 2025 (Thousand Units)
      5. 4.7.5. Latin America Fault Indicators Market, by Product, 2016-2026
        1. 4.7.5.1. Latin America Fault Indicators Market, by Product, 2016-2026 (USD Million)
        2. 4.7.5.2. Latin America Fault Indicators Market, by Product, 2016-2026 (Thousand Units)
      6. 4.7.6. Latin America Fault Indicators Market, by Application, 2016-2026
        1. 4.7.6.1. Latin America Fault Indicators Market, by Application, 2016-2026 (USD Million)
        2. 4.7.6.2. Latin America Fault Indicators Market, by Application, 2016-2026 (Thousand Units)
      7. 4.7.7. Brazil
        1. 4.7.7.1. Brazil Market size and forecast, 2016-2026 (USD Million)
        2. 4.7.7.2. Brazil Market size and forecast, 2016-2026 (Thousand Units)
      8. 4.7.8. Mexico
        1. 4.7.8.1. Mexico Market size and forecast, 2016-2026 (USD Million)
        2. 4.7.8.2. Mexico Market size and forecast, 2016-2026 (Thousand Units)
      9. 4.7.9. Rest of Latin America
        1. 4.7.9.1. Rest of Latin America Market size and forecast, 2016-2026 (USD Million)
        2. 4.7.9.2. Rest of Latin America Market size and forecast, 2016-2026 (Thousand Units)
    8. 4.8. The Middle-East and Africa
      1. 4.8.1. The Middle-East and Africa Fault Indicators Market size and forecast, 2016-2026
      2. 4.8.2. The Middle-East and Africa Fault Indicators Market, by Country, 2018 - 2025 (USD Million)
      3. 4.8.3. The Middle-East and Africa Market size and forecast, 2016-2026 (Thousand Units)
      4. 4.8.4. The Middle-East and Africa Fault Indicators Market, by Country, 2018 - 2025 (Thousand Units)
      5. 4.8.5. The Middle-East and Africa Fault Indicators Market, by Product, 2016-2026
        1. 4.8.5.1. The Middle-East and Africa Fault Indicators Market, by Product, 2016-2026 (USD Million)
        2. 4.8.5.2. The Middle-East and Africa Fault Indicators Market, by Product, 2016-2026 (Thousand Units)
      6. 4.8.6. The Middle-East and Africa Fault Indicators Market, by Application, 2016-2026
        1. 4.8.6.1. The Middle-East and Africa Fault Indicators Market, by Application, 2016-2026 (USD Million)
        2. 4.8.6.2. The Middle-East and Africa Fault Indicators Market, by Application, 2016-2026 (Thousand Units)
      7. 4.8.7. GCC Countries
        1. 4.8.7.1. GCC Countries Market size and forecast, 2016-2026 (USD Million)
        2. 4.8.7.2. GCC Countries Market size and forecast, 2016-2026 (Thousand Units)
      8. 4.8.8. South Africa
        1. 4.8.8.1. South Africa Market size and forecast, 2016-2026 (USD Million)
        2. 4.8.8.2. South Africa Market size and forecast, 2016-2026 (Thousand Units)
      9. 4.8.9. Rest of Middle-East Africa
        1. 4.8.9.1. Rest of Middle-East Africa Market size and forecast, 2016-2026 (USD Million)
        2. 4.8.9.2. Rest of Middle-East Africa Market size and forecast, 2016-2026 (Thousand Units)
  5. CHAPTER 5. Fault Indicators Production, Consumption, Export, Import by Regions
    1. 5.1. Global Fault Indicators production and revenue, 2015-2025 (USD Million) (Thousand Units)
    2. 5.2. Global Import and Export Analysis, by Region
  6. CHAPTER 6. Fault Indicators market – Competitive Landscape
    1. 6.1. Competitor Market Share – Revenue
    2. 6.2. Market Concentration Rate Analysis, Top 3 and Top 5 Players
    3. 6.3. Competitor Market Share – Volume
    4. 6.4. Strategic Development
      1. 6.4.1. Acquisitions and Mergers
      2. 6.4.2. New Products
      3. 6.4.3. Research & Development Activities
  7. CHAPTER 7. Company Profiles
    1. 7.1. Dipl. Ing. H. Horstmann GmbH
      1. 7.1.1. Company Overview
      2. 7.1.2. Dipl. Ing. H. Horstmann GmbH Sales, Revenue, Price, and Gross Margin
      3. 7.1.3. Product portfolio
      4. 7.1.4. Recent initiatives
    2. 7.2. SEL
      1. 7.2.1. Company Overview
      2. 7.2.2. SEL Sales, Revenue, Price, and Gross Margin
      3. 7.2.3. Product portfolio
      4. 7.2.4. Recent initiatives
    3. 7.3. Cooper Power Systems (Acquired by Eaton)
      1. 7.3.1. Company Overview
      2. 7.3.2. Cooper Power Systems (Acquired by Eaton) Sales, Revenue, Price, and Gross Margin
      3. 7.3.3. Product portfolio
      4. 7.3.4. Recent initiatives
    4. 7.4. Megacon
      1. 7.4.1. Company Overview
      2. 7.4.2. Megacon Sales, Revenue, Price, and Gross Margin
      3. 7.4.3. Product portfolio
      4. 7.4.4. Recent initiatives
    5. 7.5. Suparule Systems Ltd.
      1. 7.5.1. Company Overview
      2. 7.5.2. Suparule Systems Ltd. Sales, Revenue, Price, and Gross Margin
      3. 7.5.3. Product portfolio
      4. 7.5.4. Recent initiatives
    6. 7.6. Elektro-Mechanik GMBH
      1. 7.6.1. Company Overview
      2. 7.6.2. Elektro-Mechanik GMBH Sales, Revenue, Price, and Gross Margin
      3. 7.6.3. Product portfolio
      4. 7.6.4. Recent initiatives
    7. 7.7. Siemens
      1. 7.7.1. Company Overview
      2. 7.7.2. Siemens Sales, Revenue, Price, and Gross Margin
      3. 7.7.3. Product portfolio
      4. 7.7.4. Recent initiatives
    8. 7.8. Bowden Bros Ltd
      1. 7.8.1. Company Overview
      2. 7.8.2. Bowden Bros Ltd Sales, Revenue, Price, and Gross Margin
      3. 7.8.3. Product portfolio
      4. 7.8.4. Recent initiatives
    9. 7.9. ABB Group
      1. 7.9.1. Company Overview
      2. 7.9.2. ABB Group Sales, Revenue, Price, and Gross Margin
      3. 7.9.3. Product portfolio
      4. 7.9.4. Recent initiatives
    10. 7.10. Schneider Electric
      1. 7.10.1. Company Overview
      2. 7.10.2. Schneider Electric Sales, Revenue, Price, and Gross Margin
      3. 7.10.3. Product portfolio
      4. 7.10.4. Recent initiatives
    11. 7.11. Nortroll AS
      1. 7.11.1. Company Overview
      2. 7.11.2. Nortroll AS Sales, Revenue, Price, and Gross Margin
      3. 7.11.3. Product portfolio
      4. 7.11.4. Recent initiatives
    12. 7.12. Celsa Messgeräte GmbH
      1. 7.12.1. Company Overview
      2. 7.12.2. Celsa Messgeräte GmbH Sales, Revenue, Price, and Gross Margin
      3. 7.12.3. Product portfolio
      4. 7.12.4. Recent initiatives
    13. 7.13. ELECTRONSYSTEM MD srl
      1. 7.13.1. Company Overview
      2. 7.13.2. ELECTRONSYSTEM MD srl Sales, Revenue, Price, and Gross Margin
      3. 7.13.3. Product portfolio
      4. 7.13.4. Recent initiatives
    14. 7.14. Littelfuse
      1. 7.14.1. Company Overview
      2. 7.14.2. Littelfuse Sales, Revenue, Price, and Gross Margin
      3. 7.14.3. Product portfolio
      4. 7.14.4. Recent initiatives
    15. 7.15. Streamer Electric
      1. 7.15.1. Company Overview
      2. 7.15.2. Streamer Electric Sales, Revenue, Price, and Gross Margin
      3. 7.15.3. Product portfolio
      4. 7.15.4. Recent initiatives
    16. 7.16. Franklin Electric Grid Solution
      1. 7.16.1. Company Overview
      2. 7.16.2. Franklin Electric Grid Solution Sales, Revenue, Price, and Gross Margin
      3. 7.16.3. Product portfolio
      4. 7.16.4. Recent initiatives
    17. 7.17. Beijing HCRT Electrical Equipment
      1. 7.17.1. Company Overview
      2. 7.17.2. Beijing HCRT Electrical Equipment Sales, Revenue, Price, and Gross Margin
      3. 7.17.3. Product portfolio
      4. 7.17.4. Recent initiatives
    18. 7.18. Creative Distribution Automation Co., Ltd. (CREAT)
      1. 7.18.1. Company Overview
      2. 7.18.2. Creative Distribution Automation Co., Ltd. (CREAT) Sales, Revenue, Price, and Gross Margin
      3. 7.18.3. Product portfolio
      4. 7.18.4. Recent initiatives
    19. 7.19. Sentient Energy, Inc.
      1. 7.19.1. Company Overview
      2. 7.19.2. Sentient Energy, Inc. Sales, Revenue, Price, and Gross Margin
      3. 7.19.3. Product portfolio
      4. 7.19.4. Recent initiatives
    20. 7.20. Tollgrade Communications, Inc.
      1. 7.20.1. Company Overview
      2. 7.20.2. Tollgrade Communications, Inc. Sales, Revenue, Price, and Gross Margin
      3. 7.20.3. Product portfolio
      4. 7.20.4. Recent initiatives
  8. CHAPTER 8. Fault Indicators — Industry Analysis
    1. 8.1. Introduction and Taxonomy
    2. 8.2. Fault Indicators Market – Key Trends
      1. 8.2.1. Market Drivers
      2. 8.2.2. Market Restraints
      3. 8.2.3. Market Opportunities
    3. 8.3. Value Chain Analysis
    4. 8.4. Key Mandates and Regulations
    5. 8.5. Technology Roadmap and Timeline
    6. 8.6. Fault Indicators market – Attractiveness Analysis
      1. 8.6.1. By Product
      2. 8.6.2. By Application
      3. 8.6.3. By Region
  9. CHAPTER 9. Raw Material analysis
    1. 9.1. Fault Indicators Key Raw Material Analysis
      1. 9.1.1. Key Raw Materials
      2. 9.1.2. Price Trend of Key Raw Materials
    2. 9.2. Key Suppliers of Raw Materials
    3. 9.3. Proportion of Manufacturing Cost Structure
      1. 9.3.1. Raw Materials
      2. 9.3.2. Labor Cost
    4. 9.4. Manufacturing Expenses Analysis of Fault Indicators
  10. CHAPTER 10. Industrial Chain, Sourcing Strategy and Downstream Buyers
    1. 10.1. Fault Indicators Industrial Chain Analysis
    2. 10.2. Upstream Raw Materials Sourcing
      1. 10.2.1. Risk Mitigation:
      2. 10.2.2. Supplier Relationships:
      3. 10.2.3. Business Processes:
      4. 10.2.4. Securing the Product:
    3. 10.3. Raw Materials Sources of Fault Indicators Major Manufacturers in 2016
    4. 10.4. Downstream Buyers
    5. 10.5. Distributors/Traders List
  11. CHAPTER 11. Marketing Strategy Analysis, Distributors
    1. 11.1. Marketing Channel
    2. 11.2. Direct Marketing
    3. 11.3. Indirect Marketing
    4. 11.4. Marketing Channel Development Trend
    5. 11.5. Economic/Political Environmental Change
  12. CHAPTER 12. Report Conclusion
  13. CHAPTER 13. Research Approach & Methodology
    1. 13.1. Report Description
    2. 13.2. Research Scope
    3. 13.3. Research Methodology
      1. 13.3.1. Secondary Research
      2. 13.3.2. Primary Research
      3. 13.3.3. Models
        1. 13.3.3.1. Company Share Analysis Model
        2. 13.3.3.2. Revenue Based Modeling
        3. 13.3.3.3. Research Limitations

        List of Figures

        FIG. 1 Global Fault Indicators Market, 2016-2026 (USD Million)
        FIG. 2 Global Fault Indicators Market Share, by Product, 2018 & 2025 (USD Million)
        FIG. 3 Global Fault Indicators Market share, by Product, 2018 & 2025 (Thousand Units)
        FIG. 4 Global Overhead Line Fault Indicators Fault Indicators Market, 2016-2026 (USD Million)
        FIG. 5 Global Overhead Line Fault Indicators Fault Indicators  Market, 2016-2026 (Thousand Units)
        FIG. 6 Global Cable Fault Indicators Fault Indicators Market, 2016-2026 (USD Million)
        FIG. 7 Global Cable Fault Indicators Fault Indicators  Market, 2016-2026 (Thousand Units)
        FIG. 8 Global Underground Fault Indicators Fault Indicators Market, 2016-2026 (USD Million)
        FIG. 9 Global Underground Fault Indicators Fault Indicators  Market, 2016-2026 (Thousand Units)
        FIG. 10 Global Others Fault Indicators Market, 2016-2026 (USD Million)
        FIG. 11 Global Others Fault Indicators  Market, 2016-2026 (Thousand Units)
        FIG. 12 Global Fault Indicators Market Share, by Application, 2018 & 2025 (USD Million)
        FIG. 13 Global Fault Indicators Market share, by Application, 2018 & 2025 (Thousand Units)
        FIG. 14 Global Construction and Mining Industry Fault Indicators Market, 2016-2026 (USD Million)
        FIG. 15 Global Construction and Mining Industry Fault Indicators  Market, 2016-2026 (Thousand Units)
        FIG. 16 Global Automobiles Fault Indicators Market, 2016-2026 (USD Million)
        FIG. 17 Global Automobiles Fault Indicators  Market, 2016-2026 (Thousand Units)
        FIG. 18 Global Equipment Manufacturing Industry Fault Indicators Market, 2016-2026 (USD Million)
        FIG. 19 Global Equipment Manufacturing Industry Fault Indicators  Market, 2016-2026 (Thousand Units)
        FIG. 20 Global Military and Aerospace Fault Indicators Market, 2016-2026 (USD Million)
        FIG. 21 Global Military and Aerospace Fault Indicators  Market, 2016-2026 (Thousand Units)
        FIG. 22 Global Chemical and Pharmaceutical Industry Fault Indicators Market, 2016-2026 (USD Million)
        FIG. 23 Global Chemical and Pharmaceutical Industry Fault Indicators  Market, 2016-2026 (Thousand Units)
        FIG. 24 Global Power Industry Fault Indicators Market, 2016-2026 (USD Million)
        FIG. 25 Global Power Industry Fault Indicators  Market, 2016-2026 (Thousand Units)
        FIG. 26 Global Others Fault Indicators Market, 2016-2026 (USD Million)
        FIG. 27 Global Others Fault Indicators  Market, 2016-2026 (Thousand Units)
        FIG. 28 Global Fault Indicators Market Share, by Region, 2018 & 2025
        FIG. 29 Global Fault Indicators Market Share, by Region, 2018 & 2025
        FIG. 30 North America Fault Indicators Market, 2016-2026
        FIG. 31 North America Fault Indicators  Market, 2016-2026 (Thousand Units)
        FIG. 32 U.S. Fault Indicators Market, 2016-2026
        FIG. 33 U.S. Fault Indicators  Market, 2016-2026 (Thousand Units)
        FIG. 34 Canada Fault Indicators Market, 2016-2026
        FIG. 35 Canada Fault Indicators  Market, 2016-2026 (Thousand Units)
        FIG. 36 Europe Fault Indicators Market, 2016-2026
        FIG. 37 Europe Fault Indicators  Market, 2016-2026 (Thousand Units)
        FIG. 38 Germany Fault Indicators Market, 2016-2026
        FIG. 39 Germany Fault Indicators  Market, 2016-2026 (Thousand Units)
        FIG. 40 France Fault Indicators Market, 2016-2026
        FIG. 41 France Fault Indicators  Market, 2016-2026 (Thousand Units)
        FIG. 42 U.K. Fault Indicators Market, 2016-2026
        FIG. 43 U.K. Fault Indicators  Market, 2016-2026 (Thousand Units)
        FIG. 44 Italy Fault Indicators Market, 2016-2026
        FIG. 45 Italy Fault Indicators  Market, 2016-2026 (Thousand Units)
        FIG. 46 Spain Fault Indicators Market, 2016-2026
        FIG. 47 Spain Fault Indicators  Market, 2016-2026 (Thousand Units)
        FIG. 48 Rest of Europe Fault Indicators Market, 2016-2026
        FIG. 49 Rest of Europe Fault Indicators  Market, 2016-2026 (Thousand Units)
        FIG. 50 Asia Pacific Fault Indicators Market, 2016-2026
        FIG. 51 Asia Pacific Fault Indicators  Market, 2016-2026 (Thousand Units)
        FIG. 52 China Fault Indicators Market, 2016-2026
        FIG. 53 China Fault Indicators  Market, 2016-2026 (Thousand Units)
        FIG. 54 Japan Fault Indicators Market, 2016-2026
        FIG. 55 Japan Fault Indicators  Market, 2016-2026 (Thousand Units)
        FIG. 56 India Fault Indicators Market, 2016-2026
        FIG. 57 India Fault Indicators  Market, 2016-2026 (Thousand Units)
        FIG. 58 South  Korea Fault Indicators Market, 2016-2026
        FIG. 59 South  Korea Fault Indicators  Market, 2016-2026 (Thousand Units)
        FIG. 60 South-East Asia Fault Indicators Market, 2016-2026
        FIG. 61 South-East Asia Fault Indicators  Market, 2016-2026 (Thousand Units)
        FIG. 62 Rest of Asia Pacific Fault Indicators Market, 2016-2026
        FIG. 63 Rest of Asia Pacific Fault Indicators  Market, 2016-2026 (Thousand Units)
        FIG. 64 Latin America Fault Indicators Market, 2016-2026
        FIG. 65 Latin America Fault Indicators  Market, 2016-2026 (Thousand Units)
        FIG. 66 Brazil Fault Indicators Market, 2016-2026
        FIG. 67 Brazil Fault Indicators  Market, 2016-2026 (Thousand Units)
        FIG. 68 Mexico Fault Indicators Market, 2016-2026
        FIG. 69 Mexico Fault Indicators  Market, 2016-2026 (Thousand Units)
        FIG. 70 Rest of Latin America Fault Indicators Market, 2016-2026
        FIG. 71 Rest of Latin America Fault Indicators  Market, 2016-2026 (Thousand Units)
        FIG. 72 The Middle-East and Africa Fault Indicators Market, 2016-2026
        FIG. 73 The Middle-East and Africa Fault Indicators  Market, 2016-2026 (Thousand Units)
        FIG. 74 GCC Countries Fault Indicators Market, 2016-2026
        FIG. 75 GCC Countries Fault Indicators  Market, 2016-2026 (Thousand Units)
        FIG. 76 South Africa Fault Indicators Market, 2016-2026
        FIG. 77 South Africa Fault Indicators  Market, 2016-2026 (Thousand Units)
        FIG. 78 Rest of Middle-East Africa Fault Indicators Market, 2016-2026
        FIG. 79 Rest of Middle-East Africa Fault Indicators  Market, 2016-2026 (Thousand Units)
        FIG. 80 Global Fault Indicators production and revenue, 2015-2025 (USD Million) (Thousand Units)
        FIG. 81 North America Fault Indicators production and revenue, 2015-2025 (USD Million) (Thousand Units)
        FIG. 82 Europe Fault Indicators production and revenue, 2015-2025 (USD Million) (Thousand Units)
        FIG. 83 Asia Pacific Fault Indicators production and revenue, 2015-2025 (USD Million) (Thousand Units)
        FIG. 84 Latin America Fault Indicators production and revenue, 2015-2025 (USD Million) (Thousand Units)
        FIG. 85 Middle East and Africa Fault Indicators production and revenue, 2015-2025 (USD Million) (Thousand Units)
        FIG. 86 Competitor Market Share – Revenue
        FIG. 87 Competitor Market Share – Volume
        FIG. 88 Dipl. Ing. H. Horstmann GmbH Revenue and Growth Rate
        FIG. 89 Dipl. Ing. H. Horstmann GmbH Market Share
        FIG. 90 SEL Revenue and Growth Rate
        FIG. 91 SEL Market Share
        FIG. 92 Cooper Power Systems (Acquired by Eaton) Revenue and Growth Rate
        FIG. 93 Cooper Power Systems (Acquired by Eaton) Market Share
        FIG. 94 Megacon Revenue and Growth Rate
        FIG. 95 Megacon Market Share
        FIG. 96 Suparule Systems Ltd. Revenue and Growth Rate
        FIG. 97 Suparule Systems Ltd. Market Share
        FIG. 98 Elektro-Mechanik GMBH Revenue and Growth Rate
        FIG. 99 Elektro-Mechanik GMBH Market Share
        FIG. 100 Siemens Revenue and Growth Rate
        FIG. 101 Siemens Market Share
        FIG. 102 Bowden Bros Ltd Revenue and Growth Rate
        FIG. 103 Bowden Bros Ltd Market Share
        FIG. 104 ABB Group Revenue and Growth Rate
        FIG. 105 ABB Group Market Share
        FIG. 106 Schneider Electric Revenue and Growth Rate
        FIG. 107 Schneider Electric Market Share
        FIG. 108 Nortroll AS Revenue and Growth Rate
        FIG. 109 Nortroll AS Market Share
        FIG. 110 Celsa Messgeräte GmbH Revenue and Growth Rate
        FIG. 111 Celsa Messgeräte GmbH Market Share
        FIG. 112 ELECTRONSYSTEM MD srl Revenue and Growth Rate
        FIG. 113 ELECTRONSYSTEM MD srl Market Share
        FIG. 114 Littelfuse Revenue and Growth Rate
        FIG. 115 Littelfuse Market Share
        FIG. 116 Streamer Electric Revenue and Growth Rate
        FIG. 117 Streamer Electric Market Share
        FIG. 118 Franklin Electric Grid Solution Revenue and Growth Rate
        FIG. 119 Franklin Electric Grid Solution Market Share
        FIG. 120 Beijing HCRT Electrical Equipment Revenue and Growth Rate
        FIG. 121 Beijing HCRT Electrical Equipment Market Share
        FIG. 122 Creative Distribution Automation Co., Ltd. (CREAT) Revenue and Growth Rate
        FIG. 123 Creative Distribution Automation Co., Ltd. (CREAT) Market Share
        FIG. 124 Sentient Energy, Inc. Revenue and Growth Rate
        FIG. 125 Sentient Energy, Inc. Market Share
        FIG. 126 Tollgrade Communications, Inc. Revenue and Growth Rate
        FIG. 127 Tollgrade Communications, Inc. Market Share
        FIG. 128 Market Dynamics
        FIG. 129 Global Fault Indicators – Value Chain Analysis
        FIG. 130 Key Mandates and Regulations
        FIG. 131 Technology Roadmap and Timeline
        FIG. 132 Market Attractiveness Analysis – By Product
        FIG. 133 Market Attractiveness Analysis – By Application
        FIG. 134 Market Attractiveness Analysis – By Region
        FIG. 135 Manufacturing Cost Structure of Fault Indicators
        FIG. 136 Fault Indicators Industrial Chain Analysis
        FIG. 137 Market Channel
        FIG. 138 Marketing Channel Development Trend
        FIG. 139 Growth in World Gross Product, 2008-2018

        List of Tables

        TABLE 1 Global Fault Indicators market, 2018 & 2025 (USD Million)
        TABLE 2 Global Fault Indicators market, by Product, 2016-2026 (USD Million)
        TABLE 3 Global Fault Indicators market, by Product, 2016-2026 (Thousand Units)
        TABLE 4 Global Fault Indicators market, by Application, 2016-2026 (USD Million)
        TABLE 5 Global Fault Indicators market, by Application, 2016-2026 (Thousand Units)
        TABLE 6 Global Fault Indicators market, by region, 2016-2026 (USD Million)
        TABLE 7 Global Fault Indicators market, by region, 2016-2026 (Thousand Units)
        TABLE 8 North America Fault Indicators Market, by Product, 2016-2026 (USD Million)
        TABLE 9 North America Fault Indicators Market, by Product, 2016-2026 (Thousand Units)
        TABLE 10 North America Fault Indicators Market, by Application, 2016-2026 (USD Million)
        TABLE 11 North America Fault Indicators Market, by Application, 2016-2026 (Thousand Units)
        TABLE 12 Europe Fault Indicators Market, by Product, 2016-2026 (USD Million)
        TABLE 13 Europe Fault Indicators Market, by Product, 2016-2026 (Thousand Units)
        TABLE 14 Europe Fault Indicators Market, by Application, 2016-2026 (USD Million)
        TABLE 15 Europe Fault Indicators Market, by Application, 2016-2026 (Thousand Units)
        TABLE 16 Asia Pacific Fault Indicators Market, by Product, 2016-2026 (USD Million)
        TABLE 17 Asia Pacific Fault Indicators Market, by Product, 2016-2026 (Thousand Units)
        TABLE 18 Asia Pacific Fault Indicators Market, by Application, 2016-2026 (USD Million)
        TABLE 19 Asia Pacific Fault Indicators Market, by Application, 2016-2026 (Thousand Units)
        TABLE 20 Latin America Fault Indicators Market, by Product, 2016-2026 (USD Million)
        TABLE 21 Latin America Fault Indicators Market, by Product, 2016-2026 (Thousand Units)
        TABLE 22 Latin America Fault Indicators Market, by Application, 2016-2026 (USD Million)
        TABLE 23 Latin America Fault Indicators Market, by Application, 2016-2026 (Thousand Units)
        TABLE 24 The Middle-East and Africa Fault Indicators Market, by Product, 2016-2026 (USD Million)
        TABLE 25 The Middle-East and Africa Fault Indicators Market, by Product, 2016-2026 (Thousand Units)
        TABLE 26 The Middle-East and Africa Fault Indicators Market, by Application, 2016-2026 (USD Million)
        TABLE 27 The Middle-East and Africa Fault Indicators Market, by Application, 2016-2026 (Thousand Units)
        TABLE 28 North America Fault Indicators Production, Consumption, Export, Import, 2016-2019
        TABLE 29 Europe Fault Indicators Production, Consumption, Export, Import, 2016-2019
        TABLE 30 Asia Pacific Fault Indicators Production, Consumption, Export, Import, 2016-2019
        TABLE 31 Latin America Fault Indicators Production, Consumption, Export, Import, 2016-2019
        TABLE 32 Middle East & Africa Fault Indicators Production, Consumption, Export, Import, 2016-2019
        TABLE 33 Global Fault Indicators Market - Company Revenue Analysis 2016-2019 (USD Million)
        TABLE 34 Global Fault Indicators Market - Company Revenue Share Analysis 2016-2019(%)
        TABLE 35 Global Fault Indicators Market - Company Volume Analysis 2016-2019 (Thousand Units)
        TABLE 36 Global Fault Indicators Market - Company Volume Share Analysis 2016-2019(%)
        TABLE 37 Acquisitions and Mergers
        TABLE 38 New Product/Service Launch
        TABLE 39 Research & Development Activities
        TABLE 40 Market Drivers
        TABLE 41 Market Restraints
        TABLE 42 Market Opportunities
        TABLE 43 Production Base and Market Concentration Rate of Raw Material
        TABLE 44 Key Suppliers of Raw Materials
        TABLE 45 Raw Materials Sources of Fault Indicators Major Manufacturers in 2016
        TABLE 46 Major Buyers of Fault Indicators
        TABLE 47 Distributors/Traders of Fault Indicators by Region
        

Industry Major Market Players

  •  Dipl. Ing. H. Horstmann GmbH
  •  SEL
  •  Cooper Power Systems (Acquired by Eaton)
  •  Megacon
  •  Suparule Systems Ltd.
  •  Elektro-Mechanik GMBH
  •  Siemens
  •  Bowden Bros Ltd
  •  ABB Group
  •  Schneider Electric
  •  Nortroll AS
  •  Celsa Messgeräte GmbH
  •  ELECTRONSYSTEM MD srl
  •  Littelfuse
  •  Streamer Electric
  •  Franklin Electric Grid Solution
  •  Beijing HCRT Electrical Equipment
  •  Creative Distribution Automation Co.Ltd. (CREAT) 
  •  Sentient Energy Inc.
  •  Tollgrade Communications Inc.