Search Market Research Report

Discover Our Latest Reports
Discover Our Featured Reports
Discover Top Selling Reports

Fatty Acid Methyl Ester Market Size, Share Global Analysis Report, 2020–2026

report img

Fatty Acid Methyl Ester Market By Product (Polyol Esters, Sucrose Esters, Glyceryl Monostearate, Isopropyl Palmitate, Medium Chain Triglycerides and Glycol Esters) and By Application (Fuels, Polymers, Lubricants, Coatings, Food, Metalworking Fluids, Agriculture and Other): Global Industry Outlook, Market Size, Business Intelligence, Consumer Preferences, Statistical Surveys, Comprehensive Analysis, Historical Developments, Current Trends, and Forecast 2020–2026

Industry Insights

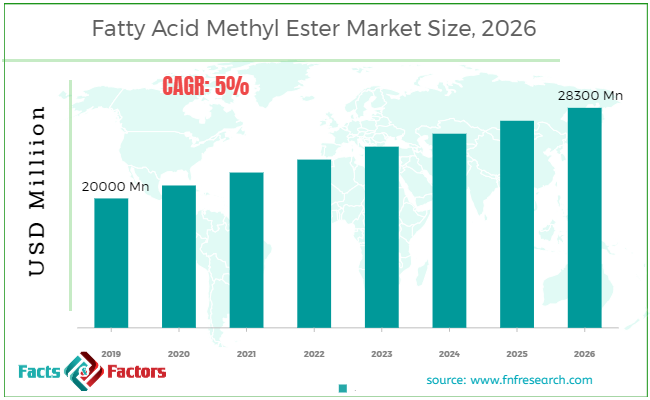
[172+ Pages Report] According to the report published by Facts Factors, the global fatty acid methyl ester market size was worth around USD 20,000 million in 2019 and is predicted to grow to around USD 28,300 million by 2026 with a compound annual growth rate (CAGR) of roughly 5% between 2020 and 2026. The report analyzes the global fatty acid methyl ester market drivers, restraints/challenges, and the effect they have on the demands during the projection period. In addition, the report explores emerging opportunities in the fatty acid methyl ester market.

Fatty Acid Methyl Ester Market

To know more about this report | Request Free Sample Copy

The fatty acid methyl ester market report analyzes and notifies the industry statistics at the global as well as regional and country levels in order to acquire a thorough perspective of the entire fatty acid methyl ester market. The historical and past insights are provided for FY 2016 to FY 2019 whereas projected trends are delivered for FY 2020 to FY 2026. The quantitative and numerical data is represented in terms of both volume (Kilo Tons) and value (USD Million) from FY 2016 – 2026.


logoKey Insights from Primary Research

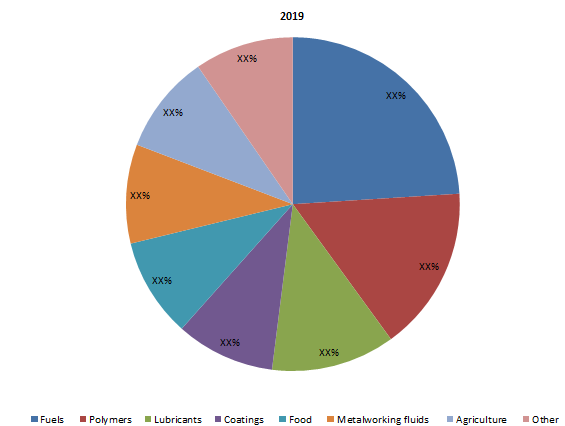
  • The “Polyol esters” type held the leading share at more than 20%, in 2019.
  • According to primary Participants, the FAME market is projected to grow annually at a rate of around 5%.
  • The Asia Pacific leads the market for FAME, owing to the escalating disposable income and rapid industrialization in India and China.
  • The “Fuels ” category, was the prominent revenue-producing category contributing to around 25% share, in 2019.
  • It was acknowledged through primary research that the FAME market was priced at around USD 20,000 million in 2019.

logoKey Recommendations from Analysts

  • The rising demand for detergents is projected to propel the growth of the global market in the forthcoming time.
  • Growing at a CAGR of around 5%, the FAME market delivers several opportunities for all of the comprised stakeholders through the entire value chain.
  • According to Analysts, the FAME industry across the world is growing at a significant rate.
  • Our analysts have recognized “Polyol esters” and “fuel” categories are the prominent investment options for the global Fatty Acid Methyl Ester market in terms of type and end-user segmentation respectively.
  • The Asia Pacific market is projected to support market growth due to escalating disposable income and rapid industrialization in India and China. Latin America and the Middle East & Africa are also projected to see substantial growth in the requirement of methyl esters of fatty acids in the forecasted period.

logoGlobal Fatty Acid Methyl Ester Market Share: By Application

Fatty Acid Methyl Ester Market

To know more about this report | Request Free Sample Copy


The quantitative data is further underlined and reinforced by comprehensive qualitative data which comprises various across-the-board market dynamics. The rationales which directly or indirectly impact the fatty acid methyl ester industry are exemplified through parameters such as growth drivers, restraints, challenges, and opportunities among other impacting factors.

Throughout our research report, we have encompassed all the proven models and tools of industry analysis and extensively illustrated all the key business strategies and business models adopted in the fatty acid methyl ester industry. The report provides an all-inclusive and detailed competitive landscape prevalent in the fatty acid methyl ester market.

The report utilizes established industry analysis tools and models such as Porter’s Five Forces framework to analyze and recognize critical business strategies adopted by various stakeholders involved in the entire value chain of the fatty acid methyl ester industry. The fatty acid methyl ester market report additionally employs SWOT analysis and PESTLE analysis models for further in-depth analysis.

The report study further includes an in-depth analysis of industry players' market shares and provides an overview of leading players' market position in the fatty acid methyl ester sector. Key strategic developments in the fatty acid methyl ester market competitive landscape such as acquisitions & mergers, inaugurations of different products and services, partnerships & joint ventures, MoU agreements, VC & funding activities, R&D activities, and geographic expansion among other noteworthy activities by key players of the fatty acid methyl ester market are appropriately highlighted in the report.

logoReport Scope

Report Attribute

Details

Market Size in 2019

USD 20,000 Million

Projected Market Size in 2026

USD 28,300 Million

CAGR Growth Rate

5% CAGR

Base Year

2019

Forecast Years

2020-2026

Key Market Players

Diester Industries, Western Iowa Energy, Biofuels Corporation, Novaol, Biopetrol Industries, Cargill and ADM Biodiesel., and Others

Key Segment

By Type, Application, and Region

Major Regions Covered

North America, Europe, Asia Pacific, Latin America, and the Middle East & Africa

Purchase Options

Request customized purchase options to meet your research needs. Explore purchase options

The fatty acid methyl ester market research report delivers an acute valuation and taxonomy of the fatty acid methyl ester industry by practically splitting the market on the basis of different types, applications, and regions. Through the analysis of the historical and projected trends, all the segments and sub-segments were evaluated through the bottom-up approach, and different market sizes have been projected for FY 2020 to FY 2026. The regional segmentation of the fatty acid methyl ester industry includes the complete classification of all the major continents including North America, Latin America, Europe, Asia Pacific, and the Middle East & Africa. Further, country-wise data for the fatty acid methyl ester industry is provided for the leading economies of the world.

The fatty acid methyl ester market is segmented based on product and application. On the basis of product segmentation, the market is classified into polyol esters, sucrose esters, glyceryl monostearate, isopropyl palmitate, medium-chain triglycerides, and glycol esters. In terms of application segmentation, the market is bifurcated into fuels, polymers, lubricants, coatings, food, metalworking fluids, agriculture and others.

logoSome of the essential players operating in the fatty acid methyl ester market, but not restricted to include:

  •  Western Iowa Energy
  •  Novaol
  •  ADM Biodiesel
  •  Cargill
  •  Biopetrol Industries
  •  Biofuels Corporation
  •  Diester Industries
  •  Green Fuels

The taxonomy of the fatty acid methyl ester industry by its scope and segmentation is as follows:

logo By Product Segmentation Analysis (Customizable)

  • Polyol Esters
  • Sucrose Esters
  • Glyceryl Monostearate
  • Isopropyl Palmitate
  • Medium Chain Triglycerides
  • Glycol Esters

logo By Application Segmentation Analysis (Customizable)

  • Fuels
  • Polymers
  • Lubricants
  • Coatings
  • Food
  • Metalworking fluids 
  • Agriculture
  • Other

logo Regional Segmentation Analysis (Customizable)

  • North America
    • The U.S.
    • Canada
  • Europe
    • Germany
    • The UK
    • France
    • Spain
    • Italy
    • Rest of Europe
  • Asia Pacific
    • China
    • Japan
    • India
    • South Korea
    • Southeast Asia
    • Rest of Asia Pacific
  • Latin America
    • Brazil
    • Mexico
    • Rest of Latin America
  • Middle East & Africa
    • GCC
    • South Africa
    • Rest of Middle East & Africa

Table of Content

  1. CHAPTER 1. Executive Summary
  2. CHAPTER 2. Fatty Acid Methyl Esters market – Product Analysis
    1. 2.1. Global Fatty Acid Methyl Esters Market – Product Overview
    2. 2.2. Global Fatty Acid Methyl Esters Market Share, by Product, 2019 & 2026 (USD Million)
    3. 2.3. Global Fatty Acid Methyl Esters Market share, by Product, 2019 & 2026 (Kilo Tons)
    4. 2.4. Polyol Esters
      1. 2.4.1. Global Polyol Esters Fatty Acid Methyl Esters Market, 2016-2026 (USD Million)
      2. 2.4.2. Global Polyol Esters Fatty Acid Methyl Esters Market, 2016-2026 (Kilo Tons)
    5. 2.5. Sucrose Esters
      1. 2.5.1. Global Sucrose Esters Fatty Acid Methyl Esters Market, 2016-2026 (USD Million)
      2. 2.5.2. Global Sucrose Esters Fatty Acid Methyl Esters Market, 2016-2026 (Kilo Tons)
    6. 2.6. Glyceryl Monostearate
      1. 2.6.1. Global Glyceryl Monostearate Fatty Acid Methyl Esters Market, 2016-2026 (USD Million)
      2. 2.6.2. Global Glyceryl Monostearate Fatty Acid Methyl Esters Market, 2016-2026 (Kilo Tons)
    7. 2.7. Isopropyl Palmitate
      1. 2.7.1. Global Isopropyl Palmitate Fatty Acid Methyl Esters Market, 2016-2026 (USD Million)
      2. 2.7.2. Global Isopropyl Palmitate Fatty Acid Methyl Esters Market, 2016-2026 (Kilo Tons)
    8. 2.8. Medium Chain Triglycerides
      1. 2.8.1. Global Medium Chain Triglycerides Fatty Acid Methyl Esters Market, 2016-2026 (USD Million)
      2. 2.8.2. Global Medium Chain Triglycerides Fatty Acid Methyl Esters Market, 2016-2026 (Kilo Tons)
    9. 2.9. Glycol Esters
      1. 2.9.1. Global Glycol Esters Fatty Acid Methyl Esters Market, 2016-2026 (USD Million)
      2. 2.9.2. Global Glycol Esters Fatty Acid Methyl Esters Market, 2016-2026 (Kilo Tons)
  3. CHAPTER 3. Fatty Acid Methyl Esters market – Application Analysis
    1. 3.1. Global Fatty Acid Methyl Esters Market – Application Overview
    2. 3.2. Global Fatty Acid Methyl Esters Market Share, by Application, 2019 & 2026 (USD Million)
    3. 3.3. Global Fatty Acid Methyl Esters Market share, by Application, 2019 & 2026 (Kilo Tons)
    4. 3.4. Fuels
      1. 3.4.1. Global Fuels Fatty Acid Methyl Esters Market, 2016-2026 (USD Million)
      2. 3.4.2. Global Fuels Fatty Acid Methyl Esters Market, 2016-2026 (Kilo Tons)
    5. 3.5. Polymers
      1. 3.5.1. Global Polymers Fatty Acid Methyl Esters Market, 2016-2026 (USD Million)
      2. 3.5.2. Global Polymers Fatty Acid Methyl Esters Market, 2016-2026 (Kilo Tons)
    6. 3.6. Lubricants
      1. 3.6.1. Global Lubricants Fatty Acid Methyl Esters Market, 2016-2026 (USD Million)
      2. 3.6.2. Global Lubricants Fatty Acid Methyl Esters Market, 2016-2026 (Kilo Tons)
    7. 3.7. Coatings
      1. 3.7.1. Global Coatings Fatty Acid Methyl Esters Market, 2016-2026 (USD Million)
      2. 3.7.2. Global Coatings Fatty Acid Methyl Esters Market, 2016-2026 (Kilo Tons)
    8. 3.8. Food
      1. 3.8.1. Global Food Fatty Acid Methyl Esters Market, 2016-2026 (USD Million)
      2. 3.8.2. Global Food Fatty Acid Methyl Esters Market, 2016-2026 (Kilo Tons)
    9. 3.9. Metalworking Fluids
      1. 3.9.1. Global Metalworking Fluids Fatty Acid Methyl Esters Market, 2016-2026 (USD Million)
      2. 3.9.2. Global Metalworking Fluids Fatty Acid Methyl Esters Market, 2016-2026 (Kilo Tons)
    10. 3.10. Agriculture
      1. 3.10.1. Global Agriculture Fatty Acid Methyl Esters Market, 2016-2026 (USD Million)
      2. 3.10.2. Global Agriculture Fatty Acid Methyl Esters Market, 2016-2026 (Kilo Tons)
    11. 3.11. Other
      1. 3.11.1. Global Other Fatty Acid Methyl Esters Market, 2016-2026 (USD Million)
      2. 3.11.2. Global Other Fatty Acid Methyl Esters Market, 2016-2026 (Kilo Tons)
  4. CHAPTER 4. Fatty Acid Methyl Esters market – Regional Analysis
    1. 4.1. Global Fatty Acid Methyl Esters Market Regional Overview
    2. 4.2. Global Fatty Acid Methyl Esters Market Share, by Region, 2019 & 2026 (Value)
    3. 4.3. Global Fatty Acid Methyl Esters Market Share, by Region, 2019 & 2026 (Volume)
    4. 4.4. North America
      1. 4.4.1. North America Fatty Acid Methyl Esters Market size and forecast, 2016-2026
      2. 4.4.2. North America Fatty Acid Methyl Esters Market, by Country, 2019 - 2026 (USD Million)
      3. 4.4.3. North America Market size and forecast, 2016-2026 (Kilo Tons)
      4. 4.4.4. North America Fatty Acid Methyl Esters Market, by Country, 2019 - 2026 (Kilo Tons)
      5. 4.4.5. North America Fatty Acid Methyl Esters Market, by Product, 2016-2026
        1. 4.4.5.1. North America Fatty Acid Methyl Esters Market, by Product, 2016-2026 (USD Million)
        2. 4.4.5.2. North America Fatty Acid Methyl Esters Market, by Product, 2016-2026 (Kilo Tons)
      6. 4.4.6. North America Fatty Acid Methyl Esters Market, by Application, 2016-2026
        1. 4.4.6.1. North America Fatty Acid Methyl Esters Market, by Application, 2016-2026 (USD Million)
        2. 4.4.6.2. North America Fatty Acid Methyl Esters Market, by Application, 2016-2026 (Kilo Tons)
      7. 4.4.7. U.S.
        1. 4.4.7.1. U.S. Market size and forecast, 2016-2026 (USD Million)
        2. 4.4.7.2. U.S. Market size and forecast, 2016-2026 (Kilo Tons)
      8. 4.4.8. Canada
        1. 4.4.8.1. Canada Market size and forecast, 2016-2026 (USD Million)
        2. 4.4.8.2. Canada Market size and forecast, 2016-2026 (Kilo Tons)
    5. 4.5. Europe
      1. 4.5.1. Europe Fatty Acid Methyl Esters Market size and forecast, 2016-2026
      2. 4.5.2. Europe Fatty Acid Methyl Esters Market, by Country, 2019 - 2026 (USD Million)
      3. 4.5.3. Europe Market size and forecast, 2016-2026 (Kilo Tons)
      4. 4.5.4. Europe Fatty Acid Methyl Esters Market, by Country, 2019 - 2026 (Kilo Tons)
      5. 4.5.5. Europe Fatty Acid Methyl Esters Market, by Product, 2016-2026
        1. 4.5.5.1. Europe Fatty Acid Methyl Esters Market, by Product, 2016-2026 (USD Million)
        2. 4.5.5.2. Europe Fatty Acid Methyl Esters Market, by Product, 2016-2026 (Kilo Tons)
      6. 4.5.6. Europe Fatty Acid Methyl Esters Market, by Application, 2016-2026
        1. 4.5.6.1. Europe Fatty Acid Methyl Esters Market, by Application, 2016-2026 (USD Million)
        2. 4.5.6.2. Europe Fatty Acid Methyl Esters Market, by Application, 2016-2026 (Kilo Tons)
      7. 4.5.7. Germany
        1. 4.5.7.1. Germany Market size and forecast, 2016-2026 (USD Million)
        2. 4.5.7.2. Germany Market size and forecast, 2016-2026 (Kilo Tons)
      8. 4.5.8. France
        1. 4.5.8.1. France Market size and forecast, 2016-2026 (USD Million)
        2. 4.5.8.2. France Market size and forecast, 2016-2026 (Kilo Tons)
      9. 4.5.9. U.K.
        1. 4.5.9.1. U.K. Market size and forecast, 2016-2026 (USD Million)
        2. 4.5.9.2. U.K. Market size and forecast, 2016-2026 (Kilo Tons)
      10. 4.5.10. Italy
        1. 4.5.10.1. Italy Market size and forecast, 2016-2026 (USD Million)
        2. 4.5.10.2. Italy Market size and forecast, 2016-2026 (Kilo Tons)
      11. 4.5.11. Spain
        1. 4.5.11.1. Spain Market size and forecast, 2016-2026 (USD Million)
        2. 4.5.11.2. Spain Market size and forecast, 2016-2026 (Kilo Tons)
      12. 4.5.12. Rest of Europe
        1. 4.5.12.1. Rest of Europe Market size and forecast, 2016-2026 (USD Million)
        2. 4.5.12.2. Rest of Europe Market size and forecast, 2016-2026 (Kilo Tons)
    6. 4.6. Asia Pacific
      1. 4.6.1. Asia Pacific Fatty Acid Methyl Esters Market size and forecast, 2016-2026
      2. 4.6.2. Asia Pacific Fatty Acid Methyl Esters Market, by Country, 2019 - 2026 (USD Million)
      3. 4.6.3. Asia Pacific Market size and forecast, 2016-2026 (Kilo Tons)
      4. 4.6.4. Asia Pacific Fatty Acid Methyl Esters Market, by Country, 2019 - 2026 (Kilo Tons)
      5. 4.6.5. Asia Pacific Fatty Acid Methyl Esters Market, by Product, 2016-2026
        1. 4.6.5.1. Asia Pacific Fatty Acid Methyl Esters Market, by Product, 2016-2026 (USD Million)
        2. 4.6.5.2. Asia Pacific Fatty Acid Methyl Esters Market, by Product, 2016-2026 (Kilo Tons)
      6. 4.6.6. Asia Pacific Fatty Acid Methyl Esters Market, by Application, 2016-2026
        1. 4.6.6.1. Asia Pacific Fatty Acid Methyl Esters Market, by Application, 2016-2026 (USD Million)
        2. 4.6.6.2. Asia Pacific Fatty Acid Methyl Esters Market, by Application, 2016-2026 (Kilo Tons)
      7. 4.6.7. China
        1. 4.6.7.1. China Market size and forecast, 2016-2026 (USD Million)
        2. 4.6.7.2. China Market size and forecast, 2016-2026 (Kilo Tons)
      8. 4.6.8. Japan
        1. 4.6.8.1. Japan Market size and forecast, 2016-2026 (USD Million)
        2. 4.6.8.2. Japan Market size and forecast, 2016-2026 (Kilo Tons)
      9. 4.6.9. India
        1. 4.6.9.1. India Market size and forecast, 2016-2026 (USD Million)
        2. 4.6.9.2. India Market size and forecast, 2016-2026 (Kilo Tons)
      10. 4.6.10. South Korea
        1. 4.6.10.1. South Korea Market size and forecast, 2016-2026 (USD Million)
        2. 4.6.10.2. South Korea Market size and forecast, 2016-2026 (Kilo Tons)
      11. 4.6.11. South-East Asia
        1. 4.6.11.1. South-East Asia Market size and forecast, 2016-2026 (USD Million)
        2. 4.6.11.2. South-East Asia Market size and forecast, 2016-2026 (Kilo Tons)
      12. 4.6.12. Rest of Asia Pacific
        1. 4.6.12.1. Rest of Asia Pacific Market size and forecast, 2016-2026 (USD Million)
        2. 4.6.12.2. Rest of Asia Pacific Market size and forecast, 2016-2026 (Kilo Tons)
    7. 4.7. Latin America
      1. 4.7.1. Latin America Fatty Acid Methyl Esters Market size and forecast, 2016-2026
      2. 4.7.2. Latin America Fatty Acid Methyl Esters Market, by Country, 2019 - 2026 (USD Million)
      3. 4.7.3. Latin America Market size and forecast, 2016-2026 (Kilo Tons)
      4. 4.7.4. Latin America Fatty Acid Methyl Esters Market, by Country, 2019 - 2026 (Kilo Tons)
      5. 4.7.5. Latin America Fatty Acid Methyl Esters Market, by Product, 2016-2026
        1. 4.7.5.1. Latin America Fatty Acid Methyl Esters Market, by Product, 2016-2026 (USD Million)
        2. 4.7.5.2. Latin America Fatty Acid Methyl Esters Market, by Product, 2016-2026 (Kilo Tons)
      6. 4.7.6. Latin America Fatty Acid Methyl Esters Market, by Application, 2016-2026
        1. 4.7.6.1. Latin America Fatty Acid Methyl Esters Market, by Application, 2016-2026 (USD Million)
        2. 4.7.6.2. Latin America Fatty Acid Methyl Esters Market, by Application, 2016-2026 (Kilo Tons)
      7. 4.7.7. Brazil
        1. 4.7.7.1. Brazil Market size and forecast, 2016-2026 (USD Million)
        2. 4.7.7.2. Brazil Market size and forecast, 2016-2026 (Kilo Tons)
      8. 4.7.8. Mexico
        1. 4.7.8.1. Mexico Market size and forecast, 2016-2026 (USD Million)
        2. 4.7.8.2. Mexico Market size and forecast, 2016-2026 (Kilo Tons)
      9. 4.7.9. Rest of Latin America
        1. 4.7.9.1. Rest of Latin America Market size and forecast, 2016-2026 (USD Million)
        2. 4.7.9.2. Rest of Latin America Market size and forecast, 2016-2026 (Kilo Tons)
    8. 4.8. The Middle-East and Africa
      1. 4.8.1. The Middle-East and Africa Fatty Acid Methyl Esters Market size and forecast, 2016-2026
      2. 4.8.2. The Middle-East and Africa Fatty Acid Methyl Esters Market, by Country, 2019 - 2026 (USD Million)
      3. 4.8.3. The Middle-East and Africa Market size and forecast, 2016-2026 (Kilo Tons)
      4. 4.8.4. The Middle-East and Africa Fatty Acid Methyl Esters Market, by Country, 2019 - 2026 (Kilo Tons)
      5. 4.8.5. The Middle-East and Africa Fatty Acid Methyl Esters Market, by Product, 2016-2026
        1. 4.8.5.1. The Middle-East and Africa Fatty Acid Methyl Esters Market, by Product, 2016-2026 (USD Million)
        2. 4.8.5.2. The Middle-East and Africa Fatty Acid Methyl Esters Market, by Product, 2016-2026 (Kilo Tons)
      6. 4.8.6. The Middle-East and Africa Fatty Acid Methyl Esters Market, by Application, 2016-2026
        1. 4.8.6.1. The Middle-East and Africa Fatty Acid Methyl Esters Market, by Application, 2016-2026 (USD Million)
        2. 4.8.6.2. The Middle-East and Africa Fatty Acid Methyl Esters Market, by Application, 2016-2026 (Kilo Tons)
      7. 4.8.7. GCC Countries
        1. 4.8.7.1. GCC Countries Market size and forecast, 2016-2026 (USD Million)
        2. 4.8.7.2. GCC Countries Market size and forecast, 2016-2026 (Kilo Tons)
      8. 4.8.8. South Africa
        1. 4.8.8.1. South Africa Market size and forecast, 2016-2026 (USD Million)
        2. 4.8.8.2. South Africa Market size and forecast, 2016-2026 (Kilo Tons)
      9. 4.8.9. Rest of Middle-East Africa
        1. 4.8.9.1. Rest of Middle-East Africa Market size and forecast, 2016-2026 (USD Million)
        2. 4.8.9.2. Rest of Middle-East Africa Market size and forecast, 2016-2026 (Kilo Tons)
  5. CHAPTER 5. Fatty Acid Methyl Esters Production, Consumption, Export, Import by Regions
    1. 5.1. Global Fatty Acid Methyl Esters production and revenue, 2016-2026 (USD Million) (Kilo Tons)
    2. 5.2. Global Import and Export Analysis, by Region
  6. CHAPTER 6. Fatty Acid Methyl Esters market – Competitive Landscape
    1. 6.1. Competitor Market Share – Revenue
    2. 6.2. Market Concentration Rate Analysis, Top 3 and Top 5 Players
    3. 6.3. Competitor Market Share – Volume
    4. 6.4. Strategic Development
      1. 6.4.1. Acquisitions and Mergers
      2. 6.4.2. New Products
      3. 6.4.3. Research & Development Activities
  7. CHAPTER 7. Company Profiles
    1. 7.1. Western Iowa Energy
      1. 7.1.1. Company Overview
      2. 7.1.2. Western Iowa Energy Sales, Revenue, Price, and Gross Margin
      3. 7.1.3. Product portfolio
      4. 7.1.4. Recent initiatives
    2. 7.2. Novaol
      1. 7.2.1. Company Overview
      2. 7.2.2. Novaol Sales, Revenue, Price, and Gross Margin
      3. 7.2.3. Product portfolio
      4. 7.2.4. Recent initiatives
    3. 7.3. ADM Biodiesel
      1. 7.3.1. Company Overview
      2. 7.3.2. ADM Biodiesel Sales, Revenue, Price, and Gross Margin
      3. 7.3.3. Product portfolio
      4. 7.3.4. Recent initiatives
    4. 7.4. Cargill
      1. 7.4.1. Company Overview
      2. 7.4.2. Cargill Sales, Revenue, Price, and Gross Margin
      3. 7.4.3. Product portfolio
      4. 7.4.4. Recent initiatives
    5. 7.5. Biopetrol Industries
      1. 7.5.1. Company Overview
      2. 7.5.2. Biopetrol Industries Sales, Revenue, Price, and Gross Margin
      3. 7.5.3. Product portfolio
      4. 7.5.4. Recent initiatives
    6. 7.6. Biofuels Corporation
      1. 7.6.1. Company Overview
      2. 7.6.2. Biofuels Corporation Sales, Revenue, Price, and Gross Margin
      3. 7.6.3. Product portfolio
      4. 7.6.4. Recent initiatives
    7. 7.7. Diester Industries
      1. 7.7.1. Company Overview
      2. 7.7.2. Diester Industries Sales, Revenue, Price, and Gross Margin
      3. 7.7.3. Product portfolio
      4. 7.7.4. Recent initiatives
    8. 7.8. Green Fuels
      1. 7.8.1. Company Overview
      2. 7.8.2. Green Fuels Sales, Revenue, Price, and Gross Margin
      3. 7.8.3. Product portfolio
      4. 7.8.4. Recent initiatives
  8. CHAPTER 8. Fatty Acid Methyl Esters — Industry Analysis
    1. 8.1. Introduction and Taxonomy
    2. 8.2. Fatty Acid Methyl Esters Market – Key Trends
      1. 8.2.1. Market Drivers
      2. 8.2.2. Market Restraints
      3. 8.2.3. Market Opportunities
    3. 8.3. Value Chain Analysis
    4. 8.4. Key Mandates and Regulations
    5. 8.5. Technology Roadmap and Timeline
    6. 8.6. Fatty Acid Methyl Esters market – Attractiveness Analysis
      1. 8.6.1. By Product
      2. 8.6.2. By Application
      3. 8.6.3. By Region
  9. CHAPTER 9. Raw Material analysis
    1. 9.1. Fatty Acid Methyl Esters Key Raw Material Analysis
      1. 9.1.1. Key Raw Materials
      2. 9.1.2. Price Trend of Key Raw Materials
    2. 9.2. Key Suppliers of Raw Materials
    3. 9.3. Proportion of Manufacturing Cost Structure
      1. 9.3.1. Raw Materials
      2. 9.3.2. Labor Cost
    4. 9.4. Manufacturing Expenses Analysis of Fatty Acid Methyl Esters
  10. CHAPTER 10. Industrial Chain, Sourcing Strategy and Downstream Buyers
    1. 10.1. Fatty Acid Methyl Esters Industrial Chain Analysis
    2. 10.2. Upstream Raw Materials Sourcing
      1. 10.2.1. Risk Mitigation:
      2. 10.2.2. Supplier Relationships:
      3. 10.2.3. Business Processes:
      4. 10.2.4. Securing the Product:
    3. 10.3. Raw Materials Sources of Fatty Acid Methyl Esters Major Manufacturers in 2016
    4. 10.4. Downstream Buyers
    5. 10.5. Distributors/Traders List
  11. CHAPTER 11. Marketing Strategy Analysis, Distributors
    1. 11.1. Marketing Channel
    2. 11.2. Direct Marketing
    3. 11.3. Indirect Marketing
    4. 11.4. Marketing Channel Development Trend
    5. 11.5. Economic/Political Environmental Change
  12. CHAPTER 12. Report Conclusion
  13. CHAPTER 13. Research Approach & Methodology
    1. 13.1. Report Description
    2. 13.2. Research Scope
    3. 13.3. Research Methodology
      1. 13.3.1. Secondary Research
      2. 13.3.2. Primary Research
      3. 13.3.3. Models
        1. 13.3.3.1. Company Share Analysis Model
        2. 13.3.3.2. Revenue Based Modeling
        3. 13.3.3.3. Research Limitations

        List of Figures

        FIG. 1 Global Fatty Acid Methyl Esters Market, 2016-2026 (USD Million)
        FIG. 2 Global Fatty Acid Methyl Esters Market Share, by Product, 2019 & 2026 (USD Million)
        FIG. 3 Global Fatty Acid Methyl Esters Market share, by Product, 2019 & 2026 (Kilo Tons)
        FIG. 4 Global Polyol Esters Fatty Acid Methyl Esters Market, 2016-2026 (USD Million)
        FIG. 5 Global Polyol Esters Fatty Acid Methyl Esters  Market, 2016-2026 (Kilo Tons)
        FIG. 6 Global Sucrose Esters Fatty Acid Methyl Esters Market, 2016-2026 (USD Million)
        FIG. 7 Global Sucrose Esters Fatty Acid Methyl Esters  Market, 2016-2026 (Kilo Tons)
        FIG. 8 Global Glyceryl Monostearate Fatty Acid Methyl Esters Market, 2016-2026 (USD Million)
        FIG. 9 Global Glyceryl Monostearate Fatty Acid Methyl Esters  Market, 2016-2026 (Kilo Tons)
        FIG. 10 Global Isopropyl Palmitate Fatty Acid Methyl Esters Market, 2016-2026 (USD Million)
        FIG. 11 Global Isopropyl Palmitate Fatty Acid Methyl Esters  Market, 2016-2026 (Kilo Tons)
        FIG. 12 Global Medium Chain Triglycerides Fatty Acid Methyl Esters Market, 2016-2026 (USD Million)
        FIG. 13 Global Medium Chain Triglycerides Fatty Acid Methyl Esters  Market, 2016-2026 (Kilo Tons)
        FIG. 14 Global Glycol Esters Fatty Acid Methyl Esters Market, 2016-2026 (USD Million)
        FIG. 15 Global Glycol Esters Fatty Acid Methyl Esters  Market, 2016-2026 (Kilo Tons)
        FIG. 16 Global Fatty Acid Methyl Esters Market Share, by Application, 2019 & 2026 (USD Million)
        FIG. 17 Global Fatty Acid Methyl Esters Market share, by Application, 2019 & 2026 (Kilo Tons)
        FIG. 18 Global Fuels Fatty Acid Methyl Esters Market, 2016-2026 (USD Million)
        FIG. 19 Global Fuels Fatty Acid Methyl Esters  Market, 2016-2026 (Kilo Tons)
        FIG. 20 Global Polymers Fatty Acid Methyl Esters Market, 2016-2026 (USD Million)
        FIG. 21 Global Polymers Fatty Acid Methyl Esters  Market, 2016-2026 (Kilo Tons)
        FIG. 22 Global Lubricants Fatty Acid Methyl Esters Market, 2016-2026 (USD Million)
        FIG. 23 Global Lubricants Fatty Acid Methyl Esters  Market, 2016-2026 (Kilo Tons)
        FIG. 24 Global Coatings Fatty Acid Methyl Esters Market, 2016-2026 (USD Million)
        FIG. 25 Global Coatings Fatty Acid Methyl Esters  Market, 2016-2026 (Kilo Tons)
        FIG. 26 Global Food Fatty Acid Methyl Esters Market, 2016-2026 (USD Million)
        FIG. 27 Global Food Fatty Acid Methyl Esters  Market, 2016-2026 (Kilo Tons)
        FIG. 28 Global Metalworking Fluids Fatty Acid Methyl Esters Market, 2016-2026 (USD Million)
        FIG. 29 Global Metalworking Fluids Fatty Acid Methyl Esters  Market, 2016-2026 (Kilo Tons)
        FIG. 30 Global Agriculture Fatty Acid Methyl Esters Market, 2016-2026 (USD Million)
        FIG. 31 Global Agriculture Fatty Acid Methyl Esters  Market, 2016-2026 (Kilo Tons)
        FIG. 32 Global Other Fatty Acid Methyl Esters Market, 2016-2026 (USD Million)
        FIG. 33 Global Other Fatty Acid Methyl Esters  Market, 2016-2026 (Kilo Tons)
        FIG. 34 Global Fatty Acid Methyl Esters Market Share, by Region, 2019 & 2026
        FIG. 35 Global Fatty Acid Methyl Esters Market Share, by Region, 2019 & 2026
        FIG. 36 North America Fatty Acid Methyl Esters Market, 2016-2026
        FIG. 37 North America Fatty Acid Methyl Esters  Market, 2016-2026 (Kilo Tons)
        FIG. 38 U.S. Fatty Acid Methyl Esters Market, 2016-2026
        FIG. 39 U.S. Fatty Acid Methyl Esters  Market, 2016-2026 (Kilo Tons)
        FIG. 40 Canada Fatty Acid Methyl Esters Market, 2016-2026
        FIG. 41 Canada Fatty Acid Methyl Esters  Market, 2016-2026 (Kilo Tons)
        FIG. 42 Europe Fatty Acid Methyl Esters Market, 2016-2026
        FIG. 43 Europe Fatty Acid Methyl Esters  Market, 2016-2026 (Kilo Tons)
        FIG. 44 Germany Fatty Acid Methyl Esters Market, 2016-2026
        FIG. 45 Germany Fatty Acid Methyl Esters  Market, 2016-2026 (Kilo Tons)
        FIG. 46 France Fatty Acid Methyl Esters Market, 2016-2026
        FIG. 47 France Fatty Acid Methyl Esters  Market, 2016-2026 (Kilo Tons)
        FIG. 48 U.K. Fatty Acid Methyl Esters Market, 2016-2026
        FIG. 49 U.K. Fatty Acid Methyl Esters  Market, 2016-2026 (Kilo Tons)
        FIG. 50 Italy Fatty Acid Methyl Esters Market, 2016-2026
        FIG. 51 Italy Fatty Acid Methyl Esters  Market, 2016-2026 (Kilo Tons)
        FIG. 52 Spain Fatty Acid Methyl Esters Market, 2016-2026
        FIG. 53 Spain Fatty Acid Methyl Esters  Market, 2016-2026 (Kilo Tons)
        FIG. 54 Rest of Europe Fatty Acid Methyl Esters Market, 2016-2026
        FIG. 55 Rest of Europe Fatty Acid Methyl Esters  Market, 2016-2026 (Kilo Tons)
        FIG. 56 Asia Pacific Fatty Acid Methyl Esters Market, 2016-2026
        FIG. 57 Asia Pacific Fatty Acid Methyl Esters  Market, 2016-2026 (Kilo Tons)
        FIG. 58 China Fatty Acid Methyl Esters Market, 2016-2026
        FIG. 59 China Fatty Acid Methyl Esters  Market, 2016-2026 (Kilo Tons)
        FIG. 60 Japan Fatty Acid Methyl Esters Market, 2016-2026
        FIG. 61 Japan Fatty Acid Methyl Esters  Market, 2016-2026 (Kilo Tons)
        FIG. 62 India Fatty Acid Methyl Esters Market, 2016-2026
        FIG. 63 India Fatty Acid Methyl Esters  Market, 2016-2026 (Kilo Tons)
        FIG. 64 South  Korea Fatty Acid Methyl Esters Market, 2016-2026
        FIG. 65 South  Korea Fatty Acid Methyl Esters  Market, 2016-2026 (Kilo Tons)
        FIG. 66 South-East Asia Fatty Acid Methyl Esters Market, 2016-2026
        FIG. 67 South-East Asia Fatty Acid Methyl Esters  Market, 2016-2026 (Kilo Tons)
        FIG. 68 Rest of Asia Pacific Fatty Acid Methyl Esters Market, 2016-2026
        FIG. 69 Rest of Asia Pacific Fatty Acid Methyl Esters  Market, 2016-2026 (Kilo Tons)
        FIG. 70 Latin America Fatty Acid Methyl Esters Market, 2016-2026
        FIG. 71 Latin America Fatty Acid Methyl Esters  Market, 2016-2026 (Kilo Tons)
        FIG. 72 Brazil Fatty Acid Methyl Esters Market, 2016-2026
        FIG. 73 Brazil Fatty Acid Methyl Esters  Market, 2016-2026 (Kilo Tons)
        FIG. 74 Mexico Fatty Acid Methyl Esters Market, 2016-2026
        FIG. 75 Mexico Fatty Acid Methyl Esters  Market, 2016-2026 (Kilo Tons)
        FIG. 76 Rest of Latin America Fatty Acid Methyl Esters Market, 2016-2026
        FIG. 77 Rest of Latin America Fatty Acid Methyl Esters  Market, 2016-2026 (Kilo Tons)
        FIG. 78 The Middle-East and Africa Fatty Acid Methyl Esters Market, 2016-2026
        FIG. 79 The Middle-East and Africa Fatty Acid Methyl Esters  Market, 2016-2026 (Kilo Tons)
        FIG. 80 GCC Countries Fatty Acid Methyl Esters Market, 2016-2026
        FIG. 81 GCC Countries Fatty Acid Methyl Esters  Market, 2016-2026 (Kilo Tons)
        FIG. 82 South Africa Fatty Acid Methyl Esters Market, 2016-2026
        FIG. 83 South Africa Fatty Acid Methyl Esters  Market, 2016-2026 (Kilo Tons)
        FIG. 84 Rest of Middle-East Africa Fatty Acid Methyl Esters Market, 2016-2026
        FIG. 85 Rest of Middle-East Africa Fatty Acid Methyl Esters  Market, 2016-2026 (Kilo Tons)
        FIG. 86 Global Fatty Acid Methyl Esters production and revenue, 2016-2026 (USD Million) (Kilo Tons)
        FIG. 87 North America Fatty Acid Methyl Esters production and revenue, 2016-2026 (USD Million) (Kilo Tons)
        FIG. 88 Europe Fatty Acid Methyl Esters production and revenue, 2016-2026 (USD Million) (Kilo Tons)
        FIG. 89 Asia Pacific Fatty Acid Methyl Esters production and revenue, 2016-2026 (USD Million) (Kilo Tons)
        FIG. 90 Latin America Fatty Acid Methyl Esters production and revenue, 2016-2026 (USD Million) (Kilo Tons)
        FIG. 91 Middle East and Africa Fatty Acid Methyl Esters production and revenue, 2016-2026 (USD Million) (Kilo Tons)
        FIG. 92 Competitor Market Share – Revenue
        FIG. 93 Competitor Market Share – Volume
        FIG. 94 Western Iowa Energy Revenue and Growth Rate
        FIG. 95 Western Iowa Energy Market Share
        FIG. 96 Novaol Revenue and Growth Rate
        FIG. 97 Novaol Market Share
        FIG. 98 ADM Biodiesel Revenue and Growth Rate
        FIG. 99 ADM Biodiesel Market Share
        FIG. 100 Cargill Revenue and Growth Rate
        FIG. 101 Cargill Market Share
        FIG. 102 Biopetrol Industries Revenue and Growth Rate
        FIG. 103 Biopetrol Industries Market Share
        FIG. 104 Biofuels Corporation Revenue and Growth Rate
        FIG. 105 Biofuels Corporation Market Share
        FIG. 106 Diester Industries Revenue and Growth Rate
        FIG. 107 Diester Industries Market Share
        FIG. 108 Green Fuels Revenue and Growth Rate
        FIG. 109 Green Fuels Market Share
        FIG. 110 Market Dynamics
        FIG. 111 Global Fatty Acid Methyl Esters – Value Chain Analysis
        FIG. 112 Key Mandates and Regulations
        FIG. 113 Technology Roadmap and Timeline
        FIG. 114 Market Attractiveness Analysis – By Product
        FIG. 115 Market Attractiveness Analysis – By Application
        FIG. 116 Market Attractiveness Analysis – By Region
        FIG. 117 Manufacturing Cost Structure of Fatty Acid Methyl Esters
        FIG. 118 Fatty Acid Methyl Esters Industrial Chain Analysis
        FIG. 119 Market Channel
        FIG. 120 Marketing Channel Development Trend
        FIG. 121 Growth in World Gross Product, 2008-2019

        List of Tables

        TABLE 1 Global Fatty Acid Methyl Esters market, 2019 & 2026 (USD Million)
        TABLE 2 Global Fatty Acid Methyl Esters market, by Product, 2016-2026 (USD Million)
        TABLE 3 Global Fatty Acid Methyl Esters market, by Product, 2016-2026 (Kilo Tons)
        TABLE 4 Global Fatty Acid Methyl Esters market, by Application, 2016-2026 (USD Million)
        TABLE 5 Global Fatty Acid Methyl Esters market, by Application, 2016-2026 (Kilo Tons)
        TABLE 6 Global Fatty Acid Methyl Esters market, by region, 2016-2026 (USD Million)
        TABLE 7 Global Fatty Acid Methyl Esters market, by region, 2016-2026 (Kilo Tons)
        TABLE 8 North America Fatty Acid Methyl Esters Market, by Product, 2016-2026 (USD Million)
        TABLE 9 North America Fatty Acid Methyl Esters Market, by Product, 2016-2026 (Kilo Tons)
        TABLE 10 North America Fatty Acid Methyl Esters Market, by Application, 2016-2026 (USD Million)
        TABLE 11 North America Fatty Acid Methyl Esters Market, by Application, 2016-2026 (Kilo Tons)
        TABLE 12 Europe Fatty Acid Methyl Esters Market, by Product, 2016-2026 (USD Million)
        TABLE 13 Europe Fatty Acid Methyl Esters Market, by Product, 2016-2026 (Kilo Tons)
        TABLE 14 Europe Fatty Acid Methyl Esters Market, by Application, 2016-2026 (USD Million)
        TABLE 15 Europe Fatty Acid Methyl Esters Market, by Application, 2016-2026 (Kilo Tons)
        TABLE 16 Asia Pacific Fatty Acid Methyl Esters Market, by Product, 2016-2026 (USD Million)
        TABLE 17 Asia Pacific Fatty Acid Methyl Esters Market, by Product, 2016-2026 (Kilo Tons)
        TABLE 18 Asia Pacific Fatty Acid Methyl Esters Market, by Application, 2016-2026 (USD Million)
        TABLE 19 Asia Pacific Fatty Acid Methyl Esters Market, by Application, 2016-2026 (Kilo Tons)
        TABLE 20 Latin America Fatty Acid Methyl Esters Market, by Product, 2016-2026 (USD Million)
        TABLE 21 Latin America Fatty Acid Methyl Esters Market, by Product, 2016-2026 (Kilo Tons)
        TABLE 22 Latin America Fatty Acid Methyl Esters Market, by Application, 2016-2026 (USD Million)
        TABLE 23 Latin America Fatty Acid Methyl Esters Market, by Application, 2016-2026 (Kilo Tons)
        TABLE 24 The Middle-East and Africa Fatty Acid Methyl Esters Market, by Product, 2016-2026 (USD Million)
        TABLE 25 The Middle-East and Africa Fatty Acid Methyl Esters Market, by Product, 2016-2026 (Kilo Tons)
        TABLE 26 The Middle-East and Africa Fatty Acid Methyl Esters Market, by Application, 2016-2026 (USD Million)
        TABLE 27 The Middle-East and Africa Fatty Acid Methyl Esters Market, by Application, 2016-2026 (Kilo Tons)
        TABLE 28 North America Fatty Acid Methyl Esters Production, Consumption, Export, Import, 2016-2019
        TABLE 29 Europe Fatty Acid Methyl Esters Production, Consumption, Export, Import, 2016-2019
        TABLE 30 Asia Pacific Fatty Acid Methyl Esters Production, Consumption, Export, Import, 2016-2019
        TABLE 31 Latin America Fatty Acid Methyl Esters Production, Consumption, Export, Import, 2016-2019
        TABLE 32 Middle East & Africa Fatty Acid Methyl Esters Production, Consumption, Export, Import, 2016-2019
        TABLE 33 Global Fatty Acid Methyl Esters Market - Company Revenue Analysis 2016-2019 (USD Million)
        TABLE 34 Global Fatty Acid Methyl Esters Market - Company Revenue Share Analysis 2016-2019(%)
        TABLE 35 Global Fatty Acid Methyl Esters Market - Company Volume Analysis 2016-2019 (Kilo Tons)
        TABLE 36 Global Fatty Acid Methyl Esters Market - Company Volume Share Analysis 2016-2019(%)
        TABLE 37 Acquisitions and Mergers
        TABLE 38 New Product/Service Launch
        TABLE 39 Research & Development Activities
        TABLE 40 Market Drivers
        TABLE 41 Market Restraints
        TABLE 42 Market Opportunities
        TABLE 43 Production Base and Market Concentration Rate of Raw Material
        TABLE 44 Key Suppliers of Raw Materials
        TABLE 45 Raw Materials Sources of Fatty Acid Methyl Esters Major Manufacturers in 2016
        TABLE 46 Major Buyers of Fatty Acid Methyl Esters
        TABLE 47 Distributors/Traders of Fatty Acid Methyl Esters by Region

Industry Major Market Players

  •  Western Iowa Energy
  •  Novaol
  •  ADM Biodiesel
  •  Cargill
  •  Biopetrol Industries
  •  Biofuels Corporation
  •  Diester Industries
  •  Green Fuels