Search Market Research Report

Discover Our Latest Reports
Discover Our Featured Reports
Discover Top Selling Reports

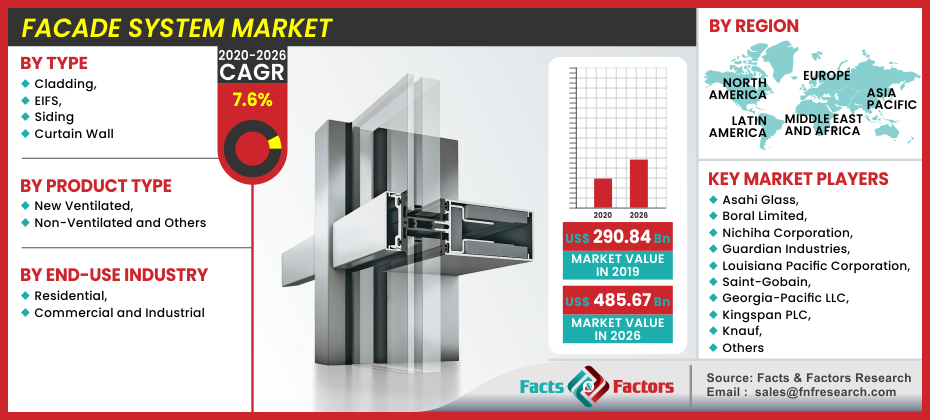
Facade System Market Size, Share Global Analysis Report, , 2020 – 2026

report img

Facade System Market by Type (Cladding, EIFS, Siding and Curtain Wall) By Product Type (New Ventilated, Non-Ventilated and Others), By End-Use Industry (Residential, Commercial and Industrial): Global Industry Perspective, Comprehensive Analysis, and Forecast, 2020 – 2026

Industry Insights

[195+ Pages Report] Global Facade System market was projected at USD 290.84 billion in 2019, which is expected to hit USD 485.67 billion in 2026 and is expected to rise to CAGR by 7.6% between 2020 and 2026.

logoMarket Overview

Facade systems comprise structural elements which give lateral or vertical resistance to wind and other forces as well as structural envelopes that provide thermal, acoustic, and fire-resistance. The type and the scale of the construction and the local zoning requirements that may affect the appearance of the building in relation to its setting determine how the façade scheme is used. For instance, although the external facade also requires brickwork, lightweight steel wall elements in the construction of an internal leaf (known as infill walls) have increasingly replaced more traditional block work.

This reinforcement method provides a ventilated environment between reinforcement and separation, avoiding thermal bridging and condensation. This offers excellent thermal stability and reduces humidity. As a result, the most effective solution for building isolation problems is generally agreed by architects, developers, and builders.

logoIndustry Growth Factor

The expansion of construction operations was one of the industry's main drivers. Furthermore, technological developments lead to energy-efficient materials being developed. In a number of industrial and residential buildings, this advanced commodity consumes solar and is commonly used as a secondary energy source. The demand is predicted to grow considerably over the projected period. The growth in consumer buying power can be attributed to the need to provide workers with safe working conditions, in particular in China, Japan India, and Brazil. In addition, with metal composite materials, the appearance of the building is sturdy, harmonious, and new. The increasing use of such composite materials is expected to stimulate demand growth in the next years in the construction of facades.

Because of its wide range of uses in the residential and non-residential sectors, the Cladding is in high demand because it provides benefits like separation, fire safety, emissions control, and the aesthetic appeal to buildings.

Facade System Market

To know more about this report | Request Free Sample Copy

logoGlobal Facade System Market: Segmentation

Global Facade System market is segmented into four notable segments which are type, product type, and end-user.

Based on type the market is further classified into the cladding, EIFS, siding, and curtain wall. During the forecast era, the cladding segment represented the largest market share. A wide variety of applications in the residential and non-residential market drives the market for cladding as it provides architectural appeals and provides advantages such as isolation, fire protection, and emission prevention. Additionally, based on product type the market is further classified into new ventilated, non-ventilated, and others. Moreover, based on end-users the market is classified into residential, commercial, and industrial.

logoCOVID-19 Impact

A significant influence on the global constructive sector was the present COVID-19 pandemic. Moreover, a global economic downturn in 2020 affected considerably by the complete shutdown of various towns in main countries such as China, the United States, Germany, the United Kingdom, and India. In addition, the global dissemination of the virus has led to the end of many ongoing residential, commercial, and manufacturing developments across the globe. The slower growth in construction and immobilizing sectors as a result of lower demand for purchasing homes and offices is expected in the near future to slow demand for façade products and services. Moreover, the easing of lock-down policies in federal governments, together with the release of economic stimulus packages in main countries including the US, the UK, China, and Germany, is expected to revive corporate growth over the next seven years.

logoReport Scope

Report Attribute

Details

Market Size in 2019

USD 290.84 Billion

Projected Market Size in 2026

USD 485.67 Billion

CAGR Growth Rate

7.6% CAGR

Base Year

2019

Forecast Years

2020-2026

Key Market Players

Asahi Glass, Boral Limited, Nichiha Corporation, Guardian Industries, Louisiana Pacific Corporation, Saint-Gobain, Georgia-Pacific LLC, Kingspan PLC, Vinh Tuong Industrial Corporation, Knauf, Nippon Sheet Glass, Central Glass, BASF, Dryvit Systems Inc., ParexGroup SA, Sto SE & Co KGaA, James Hardie Industries PLC, Etex Group, SHERA, Universal Cement Corporation (UCC), USG Corporation, Terraco Group, and Others.

Key Segment

By Type, Product, End Use, and Region

Major Regions Covered

North America, Europe, Asia Pacific, Latin America, and the Middle East & Africa

Purchase Options

Request customized purchase options to meet your research needs.Explore purchase options

logoGlobal Facade System Market: Regional Analysis

Based on regions, the global Facade System market can be divided into five main regions.

The largest share of Asia Pacific was over 38.5% in 2020. Increased development of new commercial and industrial buildings in countries such as China, Indian, and Southeast Asia helps the growth of the regional economy. Furthermore, the APAC market is expected to improve development dramatically in the coming years with evolving facade architecture design trends responsive to geographical location, building use, social aspects and protection, and sustainability issues. In addition, the emphasis on energy conservation and the hot/wet conditions in the Middle East and Africa area is projected to boost the regional demand.

In addition to this, innovative, environmentally sustainable materials are being created to attract consumers, particularly in the United States and the United Kingdom, to refurbish/renovate houses. Those regions are highly technologically adaptable. The outcome is a strong degree of penetration for both the industrial and residential markets, which is projected to have a significant effect on the development of the industry.

logoGlobal Facade System Market: Competitive Players

Some of the key players in the Facade System market are :

  • Asahi Glass
  • Boral Limited
  • Nichiha Corporation
  • Guardian Industries
  • Louisiana Pacific Corporation
  • Saint-Gobain
  • Georgia-Pacific LLC
  • Kingspan PLC
  • Vinh Tuong Industrial Corporation
  • Knauf
  • Nippon Sheet Glass
  • Central Glass
  • BASF
  • Dryvit Systems Inc.
  • ParexGroup SA
  • Sto SE & Co KGaA
  • James Hardie Industries PLC
  • Etex Group
  • SHERA
  • Universal Cement Corporation (UCC)
  • USG Corporation
  • Terraco Group 

logoGlobal Facade System Market: Regional Segment Analysis

  • North America
    • U.S.
    • Canada
  • Europe
    • U.K.
    • France
    • Germany
  • The Asia Pacific
    • China
    • Japan
    • India
  • Latin America
    • Brazil
    • Mexico
  • The Middle East and Africa

Table of Content

  1. Chapter 1 Executive Summary
    1. 1.1. Introduction of Facade System
    2. 1.2. Global Facade System Market, 2019 & 2026 (USD Billion)
    3. 1.3. COVID-19 Impacts on Facade System Market
      1. 1.3.1. Short Term COVID-19 Impact on the Market
      2. 1.3.2. Mid-Term COVID-19 Impact on the Market
      3. 1.3.3. Long-Term COVID-19 Impact on the Market
    4. 1.4. Business Strategies and Recommendations
    5. 1.5. Global Facade System Market, 2016 – 2026 (USD Billion)
    6. 1.6. Global Facade System Market Absolute Revenue Opportunity, 2016 – 2026 (USD Billion)
    7. 1.7. Global Facade System Market Incremental Revenue Opportunity, 2020 – 2026 (USD Billion)
  2. Chapter 2 Facade System Market – Type Analysis
    1. 2.1. Global Facade System Market – Type Overview
    2. 2.2. Global Facade System Market Share, by Type, 2019 & 2026 (USD Billion)
    3. 2.3. Cladding
      1. 2.3.1. Global Cladding Facade System Market, 2016 – 2026 (USD Billion)
    4. 2.4. EIFS
      1. 2.4.1. Global EIFS Facade System Market, 2016 – 2026 (USD Billion)
    5. 2.5. Siding
      1. 2.5.1. Global Siding Facade System Market, 2016 – 2026 (USD Billion)
    6. 2.6. Curtain Wall
      1. 2.6.1. Global Curtain Wall Facade System Market, 2016 – 2026 (USD Billion)
  3. Chapter 3 Facade System Market – Product Type Analysis
    1. 3.1. Global Facade System Market – Product Type Overview
    2. 3.2. Global Facade System Market Share, by Product Type, 2019 & 2026 (USD Billion)
    3. 3.3. New Ventilated
      1. 3.3.1. Global New Ventilated Facade System Market, 2016 – 2026 (USD Billion)
    4. 3.4. Non-Ventilated
      1. 3.4.1. Global Non-Ventilated Facade System Market, 2016 – 2026 (USD Billion)
    5. 3.5. Others
      1. 3.5.1. Global Others Facade System Market, 2016 – 2026 (USD Billion)
  4. Chapter 4 Facade System Market – End User Analysis
    1. 4.1. Global Facade System Market – End User Overview
    2. 4.2. Global Facade System Market Share, by End User, 2019 & 2026 (USD Billion)
    3. 4.3. Residential
      1. 4.3.1. Global Residential Facade System Market, 2016 – 2026 (USD Billion)
    4. 4.4. Commercial
      1. 4.4.1. Global Commercial Facade System Market, 2016 – 2026 (USD Billion)
    5. 4.5. Industrial
      1. 4.5.1. Global Industrial Facade System Market, 2016 – 2026 (USD Billion)
  5. Chapter 5 Facade System Market – Regional Analysis
    1. 5.1. Global Facade System Market Regional Overview
    2. 5.2. Global Facade System Market Share, by Region, 2019 & 2026 (USD Billion)
    3. 5.3. North America
      1. 5.3.1. North America Facade System Market, 2016 – 2026 (USD Billion)
      2. 5.3.2. North America Facade System Market, by Type, 2016 – 2026
      3. 5.3.3. North America Facade System Market, by Product Type, 2016 – 2026
      4. 5.3.4. North America Facade System Market, by End User, 2016 – 2026
      5. 5.3.5. U.S.
      6. 5.3.6. Canada
    4. 5.4. Europe
      1. 5.4.1. Europe Facade System Market, 2016 – 2026 (USD Billion)
      2. 5.4.2. Europe Facade System Market, by Type, 2016 – 2026
      3. 5.4.3. Europe Facade System Market, by Product Type, 2016 – 2026
      4. 5.4.4. Europe Facade System Market, by End User, 2016 – 2026
      5. 5.4.5. Germany
      6. 5.4.6. France
      7. 5.4.7. U.K.
      8. 5.4.8. Italy
      9. 5.4.9. Spain
      10. 5.4.10. Rest of Europe
    5. 5.5. Asia Pacific
      1. 5.5.1. Asia Pacific Facade System Market, 2016 – 2026 (USD Billion)
      2. 5.5.2. Asia Pacific Facade System Market, by Type, 2016 – 2026
      3. 5.5.3. Asia Pacific Facade System Market, by Product Type, 2016 – 2026
      4. 5.5.4. Asia Pacific Facade System Market, by End User, 2016 – 2026
      5. 5.5.5. China
      6. 5.5.6. Japan
      7. 5.5.7. India
      8. 5.5.8. SouthKorea
      9. 5.5.9. South-East Asia
      10. 5.5.10. Rest of Asia Pacific
    6. 5.6. Latin America
      1. 5.6.1. Latin America Facade System Market, 2016 – 2026 (USD Billion)
      2. 5.6.2. Latin America Facade System Market, by Type, 2016 – 2026
      3. 5.6.3. Latin America Facade System Market, by Product Type, 2016 – 2026
      4. 5.6.4. Latin America Facade System Market, by End User, 2016 – 2026
      5. 5.6.5. Brazil
      6. 5.6.6. Mexico
      7. 5.6.7. Rest of Latin America
    7. 5.7. The Middle-East and Africa
      1. 5.7.1. The Middle-East and Africa Facade System Market, 2016 – 2026 (USD Billion)
      2. 5.7.2. The Middle-East and Africa Facade System Market, by Type, 2016 – 2026
      3. 5.7.3. The Middle-East and Africa Facade System Market, by Product Type, 2016 – 2026
      4. 5.7.4. The Middle-East and Africa Facade System Market, by End User, 2016 – 2026
      5. 5.7.5. GCC Countries
      6. 5.7.6. South Africa
      7. 5.7.7. Rest of Middle-East Africa
  6. Chapter 6 Facade System Market – Competitive Landscape
    1. 6.1. Competitor Market Share – Revenue
    2. 6.2. Market Concentration Rate Analysis, Top 3 and Top 5 Players
    3. 6.3. Strategic Developments
      1. 6.3.1. Acquisitions and Mergers
      2. 6.3.2. New Products
      3. 6.3.3. Research & Development Activities
  7. Chapter 7 Company Profiles
    1. 7.1. Nichiha Corporation
      1. 7.1.1. Company Overview
      2. 7.1.2. Product/Service Portfolio
      3. 7.1.3. Nichiha Corporation Sales, Revenue, and Gross Margin
      4. 7.1.4. Nichiha Corporation Revenue and Growth Rate
      5. 7.1.5. Nichiha Corporation Market Share
      6. 7.1.6. Recent Initiatives, Funding/VC Activities, and Technological Innovations
    2. 7.2. Boral Limited
      1. 7.2.1. Company Overview
      2. 7.2.2. Product/Service Portfolio
      3. 7.2.3. Boral Limited Sales, Revenue, and Gross Margin
      4. 7.2.4. Boral Limited Revenue and Growth Rate
      5. 7.2.5. Boral Limited Market Share
      6. 7.2.6. Recent Initiatives, Funding/VC Activities, and Technological Innovations
    3. 7.3. Louisiana Pacific Corporation
      1. 7.3.1. Company Overview
      2. 7.3.2. Product/Service Portfolio
      3. 7.3.3. Louisiana Pacific Corporation Sales, Revenue, and Gross Margin
      4. 7.3.4. Louisiana Pacific Corporation Revenue and Growth Rate
      5. 7.3.5. Louisiana Pacific Corporation Market Share
      6. 7.3.6. Recent Initiatives, Funding/VC Activities, and Technological Innovations
    4. 7.4. Kingspan PLC
      1. 7.4.1. Company Overview
      2. 7.4.2. Product/Service Portfolio
      3. 7.4.3. Kingspan PLC Sales, Revenue, and Gross Margin
      4. 7.4.4. Kingspan PLC Revenue and Growth Rate
      5. 7.4.5. Kingspan PLC Market Share
      6. 7.4.6. Recent Initiatives, Funding/VC Activities, and Technological Innovations
    5. 7.5. Georgia-Pacific LLC
      1. 7.5.1. Company Overview
      2. 7.5.2. Product/Service Portfolio
      3. 7.5.3. Georgia-Pacific LLC Sales, Revenue, and Gross Margin
      4. 7.5.4. Georgia-Pacific LLC Revenue and Growth Rate
      5. 7.5.5. Georgia-Pacific LLC Market Share
      6. 7.5.6. Recent Initiatives, Funding/VC Activities, and Technological Innovations
    6. 7.6. Knauf
      1. 7.6.1. Company Overview
      2. 7.6.2. Product/Service Portfolio
      3. 7.6.3. Knauf Sales, Revenue, and Gross Margin
      4. 7.6.4. Knauf Revenue and Growth Rate
      5. 7.6.5. Knauf Market Share
      6. 7.6.6. Recent Initiatives, Funding/VC Activities, and Technological Innovations
    7. 7.7. Vinh Tuong Industrial Corporation
      1. 7.7.1. Company Overview
      2. 7.7.2. Product/Service Portfolio
      3. 7.7.3. Vinh Tuong Industrial Corporation Sales, Revenue, and Gross Margin
      4. 7.7.4. Vinh Tuong Industrial Corporation Revenue and Growth Rate
      5. 7.7.5. Vinh Tuong Industrial Corporation Market Share
      6. 7.7.6. Recent Initiatives, Funding/VC Activities, and Technological Innovations
    8. 7.8. Saint-Gobain
      1. 7.8.1. Company Overview
      2. 7.8.2. Product/Service Portfolio
      3. 7.8.3. Saint-Gobain Sales, Revenue, and Gross Margin
      4. 7.8.4. Saint-Gobain Revenue and Growth Rate
      5. 7.8.5. Saint-Gobain Market Share
      6. 7.8.6. Recent Initiatives, Funding/VC Activities, and Technological Innovations
    9. 7.9. Nippon Sheet Glass
      1. 7.9.1. Company Overview
      2. 7.9.2. Product/Service Portfolio
      3. 7.9.3. Nippon Sheet Glass Sales, Revenue, and Gross Margin
      4. 7.9.4. Nippon Sheet Glass Revenue and Growth Rate
      5. 7.9.5. Nippon Sheet Glass Market Share
      6. 7.9.6. Recent Initiatives, Funding/VC Activities, and Technological Innovations
    10. 7.10. Asahi Glass
      1. 7.10.1. Company Overview
      2. 7.10.2. Product/Service Portfolio
      3. 7.10.3. Asahi Glass Sales, Revenue, and Gross Margin
      4. 7.10.4. Asahi Glass Revenue and Growth Rate
      5. 7.10.5. Asahi Glass Market Share
      6. 7.10.6. Recent Initiatives, Funding/VC Activities, and Technological Innovations
    11. 7.11. Central Glass
      1. 7.11.1. Company Overview
      2. 7.11.2. Product/Service Portfolio
      3. 7.11.3. Central Glass Sales, Revenue, and Gross Margin
      4. 7.11.4. Central Glass Revenue and Growth Rate
      5. 7.11.5. Central Glass Market Share
      6. 7.11.6. Recent Initiatives, Funding/VC Activities, and Technological Innovations
    12. 7.12. Guardian Industries
      1. 7.12.1. Company Overview
      2. 7.12.2. Product/Service Portfolio
      3. 7.12.3. Guardian Industries Sales, Revenue, and Gross Margin
      4. 7.12.4. Guardian Industries Revenue and Growth Rate
      5. 7.12.5. Guardian Industries Market Share
      6. 7.12.6. Recent Initiatives, Funding/VC Activities, and Technological Innovations
    13. 7.13. BASF
      1. 7.13.1. Company Overview
      2. 7.13.2. Product/Service Portfolio
      3. 7.13.3. BASF Sales, Revenue, and Gross Margin
      4. 7.13.4. BASF Revenue and Growth Rate
      5. 7.13.5. BASF Market Share
      6. 7.13.6. Recent Initiatives, Funding/VC Activities, and Technological Innovations
    14. 7.14. Sto SE & Co KGaA
      1. 7.14.1. Company Overview
      2. 7.14.2. Product/Service Portfolio
      3. 7.14.3. Sto SE & Co KGaA Sales, Revenue, and Gross Margin
      4. 7.14.4. Sto SE & Co KGaA Revenue and Growth Rate
      5. 7.14.5. Sto SE & Co KGaA Market Share
      6. 7.14.6. Recent Initiatives, Funding/VC Activities, and Technological Innovations
    15. 7.15. Dryvit Systems Inc.
      1. 7.15.1. Company Overview
      2. 7.15.2. Product/Service Portfolio
      3. 7.15.3. Dryvit Systems Inc. Sales, Revenue, and Gross Margin
      4. 7.15.4. Dryvit Systems Inc. Revenue and Growth Rate
      5. 7.15.5. Dryvit Systems Inc. Market Share
      6. 7.15.6. Recent Initiatives, Funding/VC Activities, and Technological Innovations
    16. 7.16. ParexGroup SA
      1. 7.16.1. Company Overview
      2. 7.16.2. Product/Service Portfolio
      3. 7.16.3. ParexGroup SA Sales, Revenue, and Gross Margin
      4. 7.16.4. ParexGroup SA Revenue and Growth Rate
      5. 7.16.5. ParexGroup SA Market Share
      6. 7.16.6. Recent Initiatives, Funding/VC Activities, and Technological Innovations
    17. 7.17. Etex Group
      1. 7.17.1. Company Overview
      2. 7.17.2. Product/Service Portfolio
      3. 7.17.3. Etex Group Sales, Revenue, and Gross Margin
      4. 7.17.4. Etex Group Revenue and Growth Rate
      5. 7.17.5. Etex Group Market Share
      6. 7.17.6. Recent Initiatives, Funding/VC Activities, and Technological Innovations
    18. 7.18. James Hardie Industries PLC
      1. 7.18.1. Company Overview
      2. 7.18.2. Product/Service Portfolio
      3. 7.18.3. James Hardie Industries PLC Sales, Revenue, and Gross Margin
      4. 7.18.4. James Hardie Industries PLC Revenue and Growth Rate
      5. 7.18.5. James Hardie Industries PLC Market Share
      6. 7.18.6. Recent Initiatives, Funding/VC Activities, and Technological Innovations
    19. 7.19. USG Corporation
      1. 7.19.1. Company Overview
      2. 7.19.2. Product/Service Portfolio
      3. 7.19.3. USG Corporation Sales, Revenue, and Gross Margin
      4. 7.19.4. USG Corporation Revenue and Growth Rate
      5. 7.19.5. USG Corporation Market Share
      6. 7.19.6. Recent Initiatives, Funding/VC Activities, and Technological Innovations
    20. 7.20. SHERA
      1. 7.20.1. Company Overview
      2. 7.20.2. Product/Service Portfolio
      3. 7.20.3. SHERA Sales, Revenue, and Gross Margin
      4. 7.20.4. SHERA Revenue and Growth Rate
      5. 7.20.5. SHERA Market Share
      6. 7.20.6. Recent Initiatives, Funding/VC Activities, and Technological Innovations
    21. 7.21. Universal Cement Corporation (UCC)
      1. 7.21.1. Company Overview
      2. 7.21.2. Product/Service Portfolio
      3. 7.21.3. Universal Cement Corporation (UCC) Sales, Revenue, and Gross Margin
      4. 7.21.4. Universal Cement Corporation (UCC) Revenue and Growth Rate
      5. 7.21.5. Universal Cement Corporation (UCC) Market Share
      6. 7.21.6. Recent Initiatives, Funding/VC Activities, and Technological Innovations
    22. 7.22. and Terraco Group
      1. 7.22.1. Company Overview
      2. 7.22.2. Product/Service Portfolio
      3. 7.22.3. and Terraco Group Sales, Revenue, and Gross Margin
      4. 7.22.4. and Terraco Group Revenue and Growth Rate
      5. 7.22.5. and Terraco Group Market Share
      6. 7.22.6. Recent Initiatives, Funding/VC Activities, and Technological Innovations
  8. Chapter 8 Facade System — Industry Analysis
    1. 8.1. Introduction and Taxonomy
    2. 8.2. Facade System Market – Key Trends
      1. 8.2.1. Market Drivers
      2. 8.2.2. Market Restraints
      3. 8.2.3. Market Opportunities
    3. 8.3. Value Chain Analysis
    4. 8.4. Key Mandates and Regulations
    5. 8.5. Technology Roadmap and Timeline
    6. 8.6. Facade System Market – Attractiveness Analysis
      1. 8.6.1. By Type
      2. 8.6.2. By Product Type
      3. 8.6.3. By End User
      4. 8.6.4. By Region
  9. Chapter 9 Industrial Chain, Sourcing Strategy, and Downstream Buyers
    1. 9.1. Facade System Industrial Chain Analysis
    2. 9.2. Downstream Buyers
    3. 9.3. Distributors/Traders List
  10. Chapter 10 Marketing Strategy Analysis
    1. 10.1. Marketing Channel
    2. 10.2. Direct Marketing
    3. 10.3. Indirect Marketing
    4. 10.4. Marketing Channel Development Trends
    5. 10.5. Economic/Political Environmental Change
  11. Chapter 11 Report Conclusion & Key Insights
    1. 11.1. Key Insights from Primary Interviews & Surveys Respondents
    2. 11.2. Key Takeaways from Analysts, Consultants, and Industry Leaders
  12. Chapter 12 Research Approach & Methodology
    1. 12.1. Report Description
    2. 12.2. Research Scope
    3. 12.3. Research Methodology
      1. 12.3.1. Secondary Research
      2. 12.3.2. Primary Research
      3. 12.3.3. Statistical Models
      4. 12.3.4. Research Limitations

      List of Figures

      Fig.1	Product Picture of Facade System
      Fig.2	COVID-19 Impacts on Facade System Market
      Fig.3	Business Strategies and Recommendations
      Fig.4	Global Facade System Market, 2016 – 2026 (USD Billion)
      Fig.5	Global Facade System Market Absolute Revenue Opportunity, 2016 – 2026 (USD Billion)
      Fig.6	Global Facade System Market Incremental Revenue Opportunity, 2020 – 2026 (USD Billion)
      Fig.7	Global Facade System Market Share, by Type, 2019 & 2026 (USD Billion)
      Fig.8	Global Cladding Facade System Market, 2016 – 2026 (USD Billion)
      Fig.9	Global EIFS Facade System Market, 2016 – 2026 (USD Billion)
      Fig.10	Global Siding Facade System Market, 2016 – 2026 (USD Billion)
      Fig.11	Global Curtain Wall Facade System Market, 2016 – 2026 (USD Billion)
      Fig.12	Global Facade System Market Share, by Product Type, 2019 & 2026 (USD Billion)
      Fig.13	Global New Ventilated Facade System Market, 2016 – 2026 (USD Billion)
      Fig.14	Global Non-Ventilated Facade System Market, 2016 – 2026 (USD Billion)
      Fig.15	Global Others Facade System Market, 2016 – 2026 (USD Billion)
      Fig.16	Global Facade System Market Share, by End User, 2019 & 2026 (USD Billion)
      Fig.17	Global Residential Facade System Market, 2016 – 2026 (USD Billion)
      Fig.18	Global Commercial Facade System Market, 2016 – 2026 (USD Billion)
      Fig.19	Global Industrial Facade System Market, 2016 – 2026 (USD Billion)
      Fig.20	Global Facade System Market Share, by Region, 2019 & 2026 (USD Billion)
      Fig.21	North America Facade System Market, 2016 – 2026 (USD Billion)
      Fig.22	U.S. Facade System Market, 2016 – 2026 (USD Billion)
      Fig.23	Canada Facade System Market, 2016 – 2026 (USD Billion)
      Fig.24	Europe Facade System Market, 2016 – 2026 (USD Billion)
      Fig.25	Germany Facade System Market, 2016 – 2026 (USD Billion)
      Fig.26	France Facade System Market, 2016 – 2026 (USD Billion)
      Fig.27	U.K. Facade System Market, 2016 – 2026 (USD Billion)
      Fig.28	Italy Facade System Market, 2016 – 2026 (USD Billion)
      Fig.29	Spain Facade System Market, 2016 – 2026 (USD Billion)
      Fig.30	Rest of Europe Facade System Market, 2016 – 2026 (USD Billion)
      Fig.31	Asia Pacific Facade System Market, 2016 – 2026 (USD Billion)
      Fig.32	China Facade System Market, 2016 – 2026 (USD Billion)
      Fig.33	Japan Facade System Market, 2016 – 2026 (USD Billion)
      Fig.34	India Facade System Market, 2016 – 2026 (USD Billion)
      Fig.35	SouthKorea Facade System Market, 2016 – 2026 (USD Billion)
      Fig.36	South-East Asia Facade System Market, 2016 – 2026 (USD Billion)
      Fig.37	Rest of Asia Pacific Facade System Market, 2016 – 2026 (USD Billion)
      Fig.38	Latin America Facade System Market, 2016 – 2026 (USD Billion)
      Fig.39	Brazil Facade System Market, 2016 – 2026 (USD Billion)
      Fig.40	Mexico Facade System Market, 2016 – 2026 (USD Billion)
      Fig.41	Rest of Latin America Facade System Market, 2016 – 2026 (USD Billion)
      Fig.42	The Middle-East and Africa Facade System Market, 2016 – 2026 (USD Billion)
      Fig.43	GCC Countries Facade System Market, 2016 – 2026 (USD Billion)
      Fig.44	South Africa Facade System Market, 2016 – 2026 (USD Billion)
      Fig.45	Rest of Middle-East Africa Facade System Market, 2016 – 2026 (USD Billion)
      Fig.46	Competitor Market Share – Revenue
      Fig.47	Nichiha Corporation Revenue and Growth Rate
      Fig.48	Nichiha Corporation Market Share
      Fig.49	Boral Limited Revenue and Growth Rate
      Fig.50	Boral Limited Market Share
      Fig.51	Louisiana Pacific Corporation Revenue and Growth Rate
      Fig.52	Louisiana Pacific Corporation Market Share
      Fig.53	Kingspan PLC Revenue and Growth Rate
      Fig.54	Kingspan PLC Market Share
      Fig.55	Georgia-Pacific LLC Revenue and Growth Rate
      Fig.56	Georgia-Pacific LLC Market Share
      Fig.57	Knauf Revenue and Growth Rate
      Fig.58	Knauf Market Share
      Fig.59	Vinh Tuong Industrial Corporation Revenue and Growth Rate
      Fig.60	Vinh Tuong Industrial Corporation Market Share
      Fig.61	Saint-Gobain Revenue and Growth Rate
      Fig.62	Saint-Gobain Market Share
      Fig.63	Nippon Sheet Glass Revenue and Growth Rate
      Fig.64	Nippon Sheet Glass Market Share
      Fig.65	Asahi Glass Revenue and Growth Rate
      Fig.66	Asahi Glass Market Share
      Fig.67	Central Glass Revenue and Growth Rate
      Fig.68	Central Glass Market Share
      Fig.69	Guardian Industries Revenue and Growth Rate
      Fig.70	Guardian Industries Market Share
      Fig.71	BASF Revenue and Growth Rate
      Fig.72	BASF Market Share
      Fig.73	Sto SE & Co KGaA Revenue and Growth Rate
      Fig.74	Sto SE & Co KGaA Market Share
      Fig.75	Dryvit Systems Inc. Revenue and Growth Rate
      Fig.76	Dryvit Systems Inc. Market Share
      Fig.77	ParexGroup SA Revenue and Growth Rate
      Fig.78	ParexGroup SA Market Share
      Fig.79	Etex Group Revenue and Growth Rate
      Fig.80	Etex Group Market Share
      Fig.81	James Hardie Industries PLC Revenue and Growth Rate
      Fig.82	James Hardie Industries PLC Market Share
      Fig.83	USG Corporation Revenue and Growth Rate
      Fig.84	USG Corporation Market Share
      Fig.85	SHERA Revenue and Growth Rate
      Fig.86	SHERA Market Share
      Fig.87	Universal Cement Corporation (UCC) Revenue and Growth Rate
      Fig.88	Universal Cement Corporation (UCC) Market Share
      Fig.89	and Terraco Group Revenue and Growth Rate
      Fig.90	and Terraco Group Market Share
      Fig.91	Market Dynamics
      Fig.92	Global Facade System – Value Chain Analysis
      Fig.93	Key Mandates and Regulations
      Fig.94	Technology Roadmap and Timeline
      Fig.95	Market Attractiveness Analysis – By Type
      Fig.96	Market Attractiveness Analysis – By Product Type
      Fig.97	Market Attractiveness Analysis – By End User
      Fig.98	Market Attractiveness Analysis – By Region
      Fig.99	Facade System Industrial Chain Analysis
      Fig.100	Market Channels
      Fig.101	Marketing Channel Development Trend
      Fig.102	Growth in World Gross Product, 2008-2018
      

      List of Tables

      Table 1	Global Facade System Market, 2019 & 2026 (USD Billion)
      Table 2	Global Facade System Market, by Type, 2016 – 2026 (USD Billion)
      Table 3	Global Facade System Market, by Product Type, 2016 – 2026 (USD Billion)
      Table 4	Global Facade System Market, by End User, 2016 – 2026 (USD Billion)
      Table 5	Global Facade System Market, by Region, 2016 – 2026 (USD Billion)
      Table 6	North America Facade System Market, by Country, 2016 – 2026 (USD Billion)
      Table 7	North America Facade System Market, by Type, 2016 – 2026 (USD Billion)
      Table 8	North America Facade System Market, by Product Type, 2016 – 2026 (USD Billion)
      Table 9	North America Facade System Market, by End User, 2016 – 2026 (USD Billion)
      Table 10 Europe Facade System Market, by Country, 2016 – 2026 (USD Billion)
      Table 11 Europe Facade System Market, by Type, 2016 – 2026 (USD Billion)
      Table 12 Europe Facade System Market, by Product Type, 2016 – 2026 (USD Billion)
      Table 13 Europe Facade System Market, by End User, 2016 – 2026 (USD Billion)
      Table 14 Asia Pacific Facade System Market, by Country, 2016 – 2026 (USD Billion)
      Table 15 Asia Pacific Facade System Market, by Type, 2016 – 2026 (USD Billion)
      Table 16 Asia Pacific Facade System Market, by Product Type, 2016 – 2026 (USD Billion)
      Table 17 Asia Pacific Facade System Market, by End User, 2016 – 2026 (USD Billion)
      Table 18 Latin America Facade System Market, by Country, 2016 – 2026 (USD Billion)
      Table 19 Latin America Facade System Market, by Type, 2016 – 2026 (USD Billion)
      Table 20 Latin America Facade System Market, by Product Type, 2016 – 2026 (USD Billion)
      Table 21 Latin America Facade System Market, by End User, 2016 – 2026 (USD Billion)
      Table 22 The Middle-East and Africa Facade System Market, by Country, 2016 – 2026 (USD Billion)
      Table 23 The Middle-East and Africa Facade System Market, by Type, 2016 – 2026 (USD Billion)
      Table 24 The Middle-East and Africa Facade System Market, by Product Type, 2016 – 2026 (USD Billion)
      Table 25 The Middle-East and Africa Facade System Market, by End User, 2016 – 2026 (USD Billion)
      Table 26 Global Facade System Market - Company Revenue Analysis, 2016 – 2019 (USD Billion)
      Table 27 Global Facade System Market - Company Revenue Share Analysis, 2016 – 2019 (%)
      Table 28 Acquisitions and Mergers
      Table 29 Market Drivers – Impact Analysis
      Table 30 Market Restraints
      Table 31 Market Opportunities
      Table 32 Major Buyers of Facade System
      Table 33 Distributors/Traders of Facade System by Region
      

Industry Major Market Players

  • Asahi Glass
  • Boral Limited
  • Nichiha Corporation
  • Guardian Industries
  • Louisiana Pacific Corporation
  • Saint-Gobain
  • Georgia-Pacific LLC
  • Kingspan PLC
  • Vinh Tuong Industrial Corporation
  • Knauf
  • Nippon Sheet Glass
  • Central Glass
  • BASF
  • Dryvit Systems Inc.
  • ParexGroup SA
  • Sto SE & Co KGaA
  • James Hardie Industries PLC
  • Etex Group
  • SHERA
  • Universal Cement Corporation (UCC)
  • USG Corporation
  • Terraco Group