![]()
Search Market Research Report
Fabry Disease Treatment Market Size, Share Global Analysis Report, 2024 – 2032

Fabry Disease Treatment Market Size, Share, Growth Analysis Report By Treatment (Substrate Reduction Therapy (SRT), Enzyme Replacement Therapy (ERT), Pharmacological Chaperone Therapy, and Others), By Route of Administration (Oral and Intravenous), By End-User (Hospitals, Specialty Clinics, and Research Institutions), and By Region - Global Industry Insights, Overview, Comprehensive Analysis, Trends, Statistical Research, Market Intelligence, Historical Data and Forecast 2024 – 2032
Industry Insights
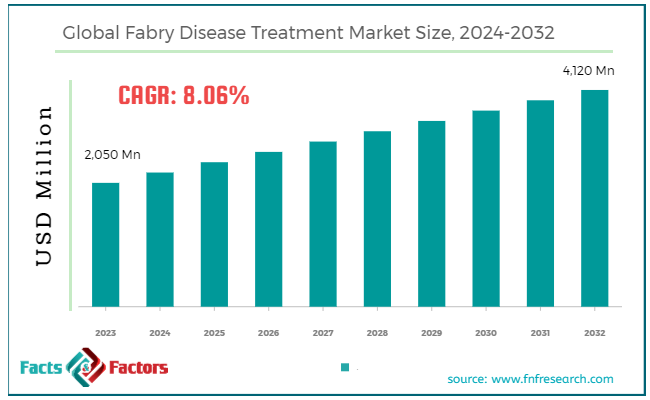
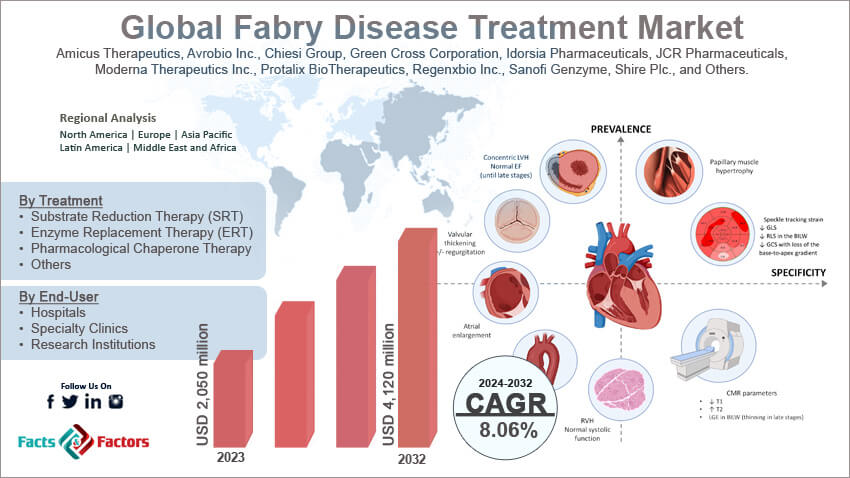
[209+ Pages Report] According to Facts & Factors, the global Fabry disease treatment market size in terms of revenue was valued at around USD 2,050 million in 2023 and is expected to reach a value of USD 4,120 million by 2032, growing at a CAGR of roughly 8.06% from 2024 to 2032. The global Fabry disease treatment market is projected to grow at a significant growth rate due to several driving factors.
 Market Overview
Fabry disease is a rare genetic disorder caused by the deficiency of the enzyme alpha-galactosidase A (α-Gal A), leading to the accumulation of globotriaosylceramide (Gb3) in various body tissues. This accumulation results in a range of symptoms, including pain, kidney dysfunction, heart disease, and stroke. The treatment of Fabry disease aims to manage symptoms, prevent complications, and improve the quality of life for patients.
The Fabry disease treatment market is driven by advancements in enzyme replacement therapy (ERT), increasing awareness about the disease, and ongoing research into novel therapeutic approaches. The market includes various treatment options such as enzyme replacement therapy, pharmacological chaperone therapy, substrate reduction therapy, and gene therapy.
Key Highlights
- The Fabry disease treatment market has registered a CAGR of 8.06% during the forecast period.
- In terms of revenue, the global Fabry disease treatment market was estimated at roughly USD 2,050 million in 2023 and is predicted to attain a value of USD 4,120 million by 2032.
- The Fabry disease treatment market is poised for substantial growth, driven by advancements in enzyme replacement therapy, increasing awareness and diagnosis rates, and ongoing research into novel therapies.
- On the basis of treatment, the enzyme replacement therapy (ERT) segment is growing at a high rate and is projected to dominate the global market.
- Based on the end-user, the hospital segment is expected to dominate the global market.
- By region, North America dominates the market due to advanced healthcare infrastructure, high awareness, and significant research funding. The United States is a major contributor.
Growth Drivers:
- Advancements in Enzyme Replacement Therapy (ERT): ERT involves the intravenous infusion of synthetic alpha-galactosidase an enzyme to replace the deficient enzyme in Fabry patients. This treatment helps reduce Gb3 accumulation and alleviate symptoms.
- Rising Prevalence: The increasing identification and diagnosis of Fabry disease fuels the need for treatment options.
- Growing Awareness: Greater public and healthcare professional awareness of Fabry disease leads to earlier diagnosis and treatment initiation.
- Improved Reimbursement: Favorable government policies and insurance coverage for Fabry disease treatments make them more accessible to patients.
- Advancements in Treatment: Development of new and more effective therapies, like chaperone therapy, offers broader treatment options for patients.
Restraints:
- High Cost of Treatment: The high cost of enzyme replacement therapy, the current mainstay of treatment, can be a significant burden for patients and healthcare systems.
- Limited Treatment Options: While treatment options are expanding, there's still a need for more diverse and affordable therapies.
- Rare Disease Challenges: The rarity of Fabry disease presents challenges in clinical trial recruitment and drug development.
- Stringent Regulatory Requirements: Navigating strict regulatory processes can delay the market entry of new treatments.
Opportunities:
- Emerging Therapies: The development of gene therapy and other novel treatment approaches holds immense promise for the future.
- Focus on Patient Outcomes: A growing focus on improving patient outcomes and quality of life is driving research towards more effective therapies with fewer side effects.
- Orphan Drug Incentives: Government incentives for orphan drug development can attract pharmaceutical companies to invest in Fabry disease treatments.
- Increasing Collaboration: Collaboration between pharmaceutical companies, research institutions, and patient advocacy groups can accelerate advancements in this field.
Challenges:
- Maintaining Affordability: Balancing the high cost of drug development with ensuring treatment affordability for patients remains a challenge.
- Managing Complications: Minimizing potential complications associated with enzyme replacement therapy requires ongoing research and development.
- Ensuring Equitable Access: Ensuring access to Fabry disease treatment for patients in developing countries requires innovative solutions.
- Raising Public Awareness: Continued efforts are needed to raise public awareness of Fabry disease to promote earlier diagnosis and treatment.
Fabry Disease Treatment Market: Segmentation Analysis
The global Fabry disease treatment market is segmented based on treatment, route of administration, end-user, and region.
By Treatment Insights
Based on Treatment, the global Fabry disease treatment market is divided into substrate reduction therapy (SRT), enzyme replacement therapy (ERT), pharmacological chaperone therapy, and others.
Substrate Reduction Therapy (SRT) aims to reduce the production of the substrate that accumulates in Fabry disease due to enzyme deficiency. This treatment is designed to decrease the substrate load on the lysosomes, thereby reducing the symptoms and progression of the disease. The demand for SRT in Fabry disease treatment is driven by its effectiveness in reducing substrate accumulation and improving patient outcomes.
The Enzyme Replacement Therapy (ERT) segment is expected to maintain a dominant position in the Fabry disease treatment market, with a significant CAGR over the forecast period. Enzyme Replacement Therapy (ERT) involves the regular infusion of synthetic enzymes to replace the deficient or malfunctioning enzymes in patients with Fabry disease. This treatment helps reduce the accumulation of globotriaosylceramide (GL-3) in various organs, alleviating symptoms and slowing disease progression. ERT is the most established and widely used treatment for Fabry disease. The effectiveness of ERT in managing symptoms and improving quality of life for patients has led to its widespread adoption. Major pharmaceutical companies are actively involved in producing and improving ERT formulations, contributing to market growth.
Pharmacological Chaperone Therapy involves small molecules that stabilize the structure of the malfunctioning enzyme in Fabry disease, allowing it to function more effectively. This therapy is particularly beneficial for patients with certain genetic mutations that result in misfolded enzymes. The market for pharmacological chaperone therapy is driven by its potential to offer a less invasive treatment option compared to ERT. This therapy is particularly attractive for patients with amenable mutations who can benefit from oral administration.
By Route of Administration Insights
On the basis of Route of Administration, the global Fabry disease treatment market is bifurcated into oral and intravenous. The intravenous administration segment is expected to maintain a strong position in the Fabry disease treatment market. Intravenous (IV) administration is a common route for delivering enzyme replacement therapy (ERT) for Fabry disease. This method involves infusing the therapeutic enzyme directly into the bloodstream, ensuring that it reaches the target cells efficiently. The intravenous route is widely adopted for Fabry disease treatments, particularly for enzyme replacement therapies such as agalsidase beta (Fabrazyme) and agalsidase alfa (Replagal). The high efficacy of intravenous administration in delivering therapeutic enzymes directly into the bloodstream drives its dominance in the market. This route ensures rapid and complete delivery of the medication, which is crucial for managing Fabry disease effectively.
Oral administration is an emerging route for treating Fabry disease, primarily utilized in pharmacological chaperone therapy. This method offers a convenient and non-invasive alternative to intravenous infusions, potentially improving patient compliance. The oral administration segment is anticipated to grow significantly, supported by the increasing adoption of pharmacological chaperone therapy and the development of new oral treatments. The segment's growth is driven by the advantages of ease of administration, improved patient compliance, and ongoing innovations in oral drug formulations.
By End-User Insights
Based on End-User, the global Fabry disease treatment market is categorized into hospitals, specialty clinics, and research institutions. The hospital segment dominates the Fabry disease treatment market due to its ability to handle the complexities associated with advanced therapies. Hospitals are primary end-users of Fabry disease treatments, providing comprehensive care including diagnosis, treatment, and monitoring of patients.
The specialty clinics segment is anticipated to grow robustly due to the increasing preference for specialized care and the expansion of clinics focusing on rare diseases. The growing awareness of Fabry disease and the benefits of specialized treatment approaches will drive this segment’s growth.
The research institutions segment is expected to grow significantly, driven by increased funding for rare disease research and the development of new treatment modalities. The continuous push for innovation and the translation of research findings into clinical practice will further support the growth of this segment.
Recent Developments:
- In May 2023, Chiesi Global Rare Diseases and Protalix BioTherapeutics secured FDA approval for Elfabrio in the United States, offering a new treatment option for adult Fabry patients. This single-dose vial comes as a preservative-free solution.
- In May 2023, Sangamo Therapeutics, a company focused on genomic medicine, received a significant boost for its Fabry disease treatment. Their gene therapy candidate, isaralgagene civaparvovec (ST-920), secured Fast Track Designation from the FDA. This designation signifies faster FDA review timelines, potentially expediting the path to approval for ST-920. Currently, the treatment is undergoing evaluation in a Phase 1/2 clinical trial called STAAR, with 20 patients already enrolled and diagnosed with Fabry disease. This progress suggests promising potential for ST-920 to become a future gene therapy option for Fabry patients.
Report Scope
Report Attribute |
Details |
Market Size in 2023 |
USD 2,050 Million |
Projected Market Size in 2032 |
USD 4,120 Million |
CAGR Growth Rate |
8.06% CAGR |
Base Year |
2023 |
Forecast Years |
2024-2032 |
Key Market Players |
Amicus Therapeutics, Avrobio Inc., Chiesi Group, Green Cross Corporation, Idorsia Pharmaceuticals, JCR Pharmaceuticals, Moderna Therapeutics Inc., Protalix BioTherapeutics, Regenxbio Inc., Sanofi Genzyme, Shire Plc., and Others. |
Key Segment |
By Treatment, By Route of Administration, By End-User, and By Region |
Major Regions Covered |
North America, Europe, Asia Pacific, Latin America, and the Middle East &, Africa |
Purchase Options |
Request customized purchase options to meet your research needs. Explore purchase options |
Fabry Disease Treatment Market: Regional Analysis
- North America leads the Fabry disease treatment market
North America dominated the market in 2023 and is expected to continue its dominance with a strong CAGR from 2024 to 2033?, primarily due to the higher adoption of novel therapies, better healthcare facilities, and favorable reimbursement policies. The United States, in particular, leads the market with substantial investments in research and development and a strong presence of major pharmaceutical companies. The region benefits from high healthcare expenditure and supportive government policies encouraging pharmaceutical innovation and development for rare diseases.
Europe holds a substantial share of the Fabry disease treatment market, driven by a well-established healthcare system and significant government support for rare disease research. Countries like Germany, the UK, and France are leading in this region, benefiting from strong regulatory frameworks and increasing awareness about Fabry disease. Europe is expected to grow steadily, with continuous advancements in therapeutic options and a favorable regulatory environment supporting market expansion
The Asia-Pacific region is anticipated to witness the fastest growth in the Fabry disease treatment market. This rapid growth is driven by increasing healthcare expenditure, improving healthcare infrastructure, and rising awareness about rare diseases in countries such as China, Japan, and India. The region's market potential is substantial, supported by significant investments in healthcare and an increasing prevalence of genetic disorders. Asia-Pacific is projected to grow at a 7.9% CAGR, making it the fastest-growing region globally.
Latin America is emerging as a notable market, with countries like Brazil and Mexico showing significant growth. This region's expansion is supported by increasing healthcare investments, rising awareness about rare diseases, and improving access to advanced medical treatments. Latin America is expected to grow steadily, driven by healthcare reforms and increasing demand for specialized treatments
The Middle East & Africa region is gradually expanding its market for Fabry disease treatment, driven by efforts to modernize healthcare systems and increasing investments in healthcare infrastructure. Countries such as the UAE and South Africa are leading the region in adopting advanced medical technologies.
Fabry Disease Treatment Market: Competitive Landscape
The analysis-intensive report provides key insights into companies and organizations operating in the global myocardial infarction market. The study further makes a relative examination of the organizations highlighting essential business parameters such as geographic presence, business overviews, product offerings, segment-based market share, operational strategies, and SWOT analysis. Recent enterprise developments including novel product launches, joint ventures, partnerships, strategic alliances, mergers & acquisitions, and product development are elaborated upon in the report. The in-depth study thus facilitates a comprehensive analysis of market competition.
Some of the main competitors dominating the global Fabry disease treatment market include;
- Amicus Therapeutics
- Avrobio Inc.
- Chiesi Group
- Green Cross Corporation
- Idorsia Pharmaceuticals
- JCR Pharmaceuticals
- Moderna Therapeutics Inc.
- Protalix BioTherapeutics
- Regenxbio Inc.
- Sanofi Genzyme
- Shire Plc.
The global Fabry disease treatment market is segmented as follows:
By Treatment Segment Analysis
- Substrate Reduction Therapy (SRT)
- Enzyme Replacement Therapy (ERT)
- Pharmacological Chaperone Therapy
- Others
By Route of Administration Segment Analysis
- Intravenous
- Oral
By End-User Segment Analysis
- Hospitals
- Specialty Clinics
- Research Institutions
By Regional Segment Analysis
- North America
- The U.S.
- Canada
- Mexico
- Europe
- France
- The UK
- Spain
- Germany
- Italy
- Rest of Europe
- Asia Pacific
- China
- Japan
- India
- Australia
- Southeast Asia
- Rest of Asia Pacific
- The Middle East & Africa
- Saudi Arabia
- UAE
- Egypt
- Kuwait
- South Africa
- Rest of the Middle East & Africa
- Latin America
- Brazil
- Argentina
- Rest of Latin America
Table of Content
Industry Major Market Players
- Amicus Therapeutics
- Avrobio Inc.
- Chiesi Group
- Green Cross Corporation
- Idorsia Pharmaceuticals
- JCR Pharmaceuticals
- Moderna Therapeutics Inc.
- Protalix BioTherapeutics
- Regenxbio Inc.
- Sanofi Genzyme
- Shire Plc.


Copyright © 2024 - 2025, All Rights Reserved, Facts and Factors