Search Market Research Report

Discover Our Latest Reports
Discover Our Featured Reports
Discover Top Selling Reports

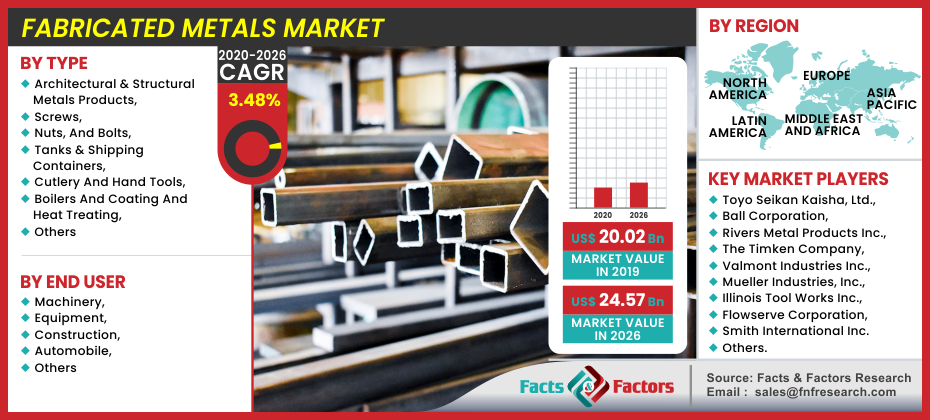
Fabricated Metals Market Size, Share Global Analysis Report, , 2020 – 2026

report img

Fabricated Metals Market by Type (Architectural & Structural Metals Products, Screws, Nuts, And Bolts, Tanks & Shipping Containers, Cutlery And Hand Tools, Boilers And Coating And Heat Treating, and Others) By End User (Machinery, Equipment, Construction, Automobile, And Others) By Region: Global Industry Perspective, Comprehensive Analysis, and Forecast, 2020 – 2026

Industry Insights

[195+ Pages Report] According to the report published by Facts and Factors, the global fabricated metals market was valued at approximately USD 20.02 billion in 2019 and is expected to generate revenue of around USD 24.57 billion by end of 2026, growing at a CAGR of around 3.48% between 2020 and 2026.

logoMarket Overview     

The fabricated metal goods manufacturing cluster includes companies that make everything from nails and screws to boilers and building frames out of metal. The end products of the cluster are classified into sub-sectors based on their uses. Metal forges and hand tool makers, structural metals, tanks, threaded materials, and heat-treated metals are among them.

Several supplier industries are related to the fabrication of metal products and include the materials, products, and services needed for production. According to IMPLAN results, steel/iron products for instance steel bars that are molded into the preferred products account for 19.1 percent of production costs. Aluminum sheets and plates account for an extra 12.3% of manufacturing costs.

logoIndustry Growth Factors

From 2012 to 2016, the fabricated metal industry grew noticeably, thanks to developing Asian economies and increased automotive and industrial exports from European countries. The increase in consumption from Asian countries was the sole driver of growth from 2016 to 2019. Shifting developments in the finance and manufacturing sectors around the world are driving up demand. Companies were compelled to relocate their manufacturing operations to the Asia Pacific because of the region's growing population and large markets for various industry verticals. Manufacturing firms are the biggest users of fabricated metal, followed by the automotive industry and its ancillary industries. Over the forecast period, demand and supply for major industries in the fabricated metal market, such as aerospace and defense, are expected to grow. Global population growth is driving energy consumption and demand. Fabricated metal is expected to be in high demand as a result of rapid industrialization. The high cost of raw materials, on the other hand, is expected to be a major stumbling block to market expansion. Nonetheless, technological advancements and efforts to develop customized equipment are expected to provide manufacturers with new business opportunities in the near future.

Fabricated Metals Market

To know more about this report | Request Free Sample Copy

logoSegmentation Analysis

The global Fabricated Metals Market is segregated based type, end-user, and region

Architectural & structural metals products, screws, nuts, and bolts, tanks & shipping containers, cutlery and hand tools, boilers and coating and heat treating, and others make up type segment of the global fabricated metal industry. The global fabricated metal industry is dominated by architectural and structural metals. During the forecast period, the segment is expected to grow at a rapid rate. Demand for structural metal products is expected to rise as the construction industry, particularly the infrastructure market, expands. Due to favorable government policies and increased FDI inflow, industrial and manufacturing activities are rapidly expanding in the Asia Pacific, specifically in Japan and China. As a result, the coating and heat treating, as well as boilers, tanks, and shipping containers segments, are expected to grow rapidly during the analysis period. The global fabricated metal market can be divided into machinery, equipment, construction, automobile, and others, depending on the end-user. The automotive industry is a significant end-user of the market.

logoReport Scope

Report Attribute

Details

Market Size in 2019

USD 20.02 Billion

Projected Market Size in 2026

USD 24.57 Billion

CAGR Growth Rate

3.48% CAGR

Base Year

2019

Forecast Years

2020-2026

Key Market Players

Toyo Seikan Kaisha, Ltd., Ball Corporation, Rivers Metal Products Inc., The Timken Company, Valmont Industries Inc., Mueller Industries, Inc., Illinois Tool Works Inc., Flowserve Corporation, Schaeffler Technologies AG & Co. KG, and Smith International Inc. amongst others.

Key Segment

By Type, End User, and Region

Major Regions Covered

North America, Europe, Asia Pacific, Latin America, and the Middle East & Africa

Purchase Options

Request customized purchase options to meet your research needs.Explore purchase options

logo Regional Analysis

Asia-Pacific is the world's largest market for fabricated metal and is home to some of the world's fastest-growing economies, including India and China. Economic activity has increased in Asia Pacific countries such as China, India, Malaysia, Indonesia, and the Philippines, owing to the steady growth of the manufacturing industry, which is expected to play a significant role. Singapore, Australia, Japan, and South Korea, as well as other developed nations in the area, are highly industrialized and provide strong demand for the fabricated metal. Because of the growing population, the fabricated metal market is expected to grow at a rapid rate as the world moves toward industrialization.

The second-largest market for fabricated metal is Europe. Demand is expected to be fueled in the near future by developed nations such as Germany, France, and Italy, among others. Because of its massive automotive and ancillary industries, Germany is Europe's largest economy. Italy, along with other markets such as Switzerland and Russia, leads Germany.

logo Competitive Players

Some main participants of the global fabricated metals market are :

  • The Timken Company
  • Valmont Industries Inc.
  • Mueller Industries, Inc.
  • Illinois Tool Works Inc.
  • Toyo Seikan Kaisha, Ltd.
  • Ball Corporation
  • Rivers Metal Products Inc.
  • Flowserve Corporation
  • Schaeffler Technologies AG & Co. KG
  • Smith International Inc.

logoFabricated Metals Market: Regional Segment Analysis

  • North America
    • U.S.
    • Canada
  • Europe
    • UK
    • France
    • Germany
    • Italy
    • Spain
    • Rest of Europe
  • Asia Pacific
    • China
    • Japan
    • India
    • South Korea
    • Southeast Asia
    • Rest of Asia Pacific
  • Latin America
    • Brazil
    • Mexico
    • Rest of Latin America
  • Middle East and Africa
    • GCC Countries
    • South Africa
    • Rest of MEA

Table of Content

  1. Chapter 1 Executive Summary
    1. 1.1. Introduction of Fabricated Metals
    2. 1.2. Global Fabricated Metals Market, 2019 & 2026 (USD Billion)
    3. 1.3. Global Fabricated Metals Market, 2016 – 2026 (USD Billion)
    4. 1.4. Global Fabricated Metals Market Absolute Revenue Opportunity, 2016 – 2026 (USD Billion)
    5. 1.5. Global Fabricated Metals Market Incremental Revenue Opportunity, 2020 – 2026 (USD Billion)
    6. 1.6. COVID-19 Impacts on Fabricated Metal Market
      1. 1.6.1. COVID-19 Impact on the Players
      2. 1.6.2. Business Strategies and Recommendations
  2. Chapter 2 Fabricated Metals Market – Type Analysis
    1. 2.1. Global Fabricated Metals Market – Type Overview
    2. 2.2. Global Fabricated Metals Market Share, by Type, 2019 & 2026 (USD Billion)
    3. 2.3. Architectural & Structural Products
      1. 2.3.1. Global Architectural & Structural Products Fabricated Metals Market, 2016 – 2026 (USD Billion)
    4. 2.4. Screws, Nuts, and Bolts
      1. 2.4.1. Global Screws, Nuts, and Bolts Fabricated Metals Market, 2016 – 2026 (USD Billion)
    5. 2.5. Tanks & Shipping Containers
      1. 2.5.1. Global Tanks & Shipping Containers Fabricated Metals Market, 2016 – 2026 (USD Billion)
    6. 2.6. Cutlery and Hand Tools
      1. 2.6.1. Global Cutlery and Hand Tools Fabricated Metals Market, 2016 – 2026 (USD Billion)
    7. 2.7. Boilers
      1. 2.7.1. Global Boilers Fabricated Metals Market, 2016 – 2026 (USD Billion)
    8. 2.8. Coating and Heat Treating
      1. 2.8.1. Global Coating and Heat Treating Fabricated Metals Market, 2016 – 2026 (USD Billion)
    9. 2.9. Others
      1. 2.9.1. Global Others Fabricated Metals Market, 2016 – 2026 (USD Billion)
  3. Chapter 3 Fabricated Metals Market – End User Analysis
    1. 3.1. Global Fabricated Metals Market – End User Overview
    2. 3.2. Global Fabricated Metals Market Share, by End User, 2019 & 2026 (USD Billion)
    3. 3.3. Machinery
      1. 3.3.1. Global Machinery Fabricated Metals Market, 2016 – 2026 (USD Billion)
    4. 3.4. Equipment
      1. 3.4.1. Global Equipment Fabricated Metals Market, 2016 – 2026 (USD Billion)
    5. 3.5. Construction
      1. 3.5.1. Global Construction Fabricated Metals Market, 2016 – 2026 (USD Billion)
    6. 3.6. Automobile
      1. 3.6.1. Global Automobile Fabricated Metals Market, 2016 – 2026 (USD Billion)
    7. 3.7. Others
      1. 3.7.1. Global Others Fabricated Metals Market, 2016 – 2026 (USD Billion)
  4. Chapter 4 Fabricated Metals Market – Regional Analysis
    1. 4.1. Global Fabricated Metals Market Regional Overview
    2. 4.2. Global Fabricated Metals Market Share, by Region, 2019 & 2026 (USD Billion)
    3. 4.3. North America
      1. 4.3.1. North America Fabricated Metals Market, 2016 – 2026 (USD Billion)
        1. 4.3.1.1. North America Fabricated Metals Market, by Country, 2016 - 2026 (USD Billion)
      2. 4.3.2. North America Fabricated Metals Market, by Type, 2016 – 2026
        1. 4.3.2.1. North America Fabricated Metals Market, by Type, 2016 – 2026 (USD Billion)
      3. 4.3.3. North America Fabricated Metals Market, by End User, 2016 – 2026
        1. 4.3.3.1. North America Fabricated Metals Market, by End User, 2016 – 2026 (USD Billion)
      4. 4.3.4. U.S.
        1. 4.3.4.1. U.S. Fabricated Metals Market, 2016 – 2026 (USD Billion)
      5. 4.3.5. Canada
        1. 4.3.5.1. Canada Fabricated Metals Market, 2016 – 2026 (USD Billion)
    4. 4.4. Europe
      1. 4.4.1. Europe Fabricated Metals Market, 2016 – 2026 (USD Billion)
        1. 4.4.1.1. Europe Fabricated Metals Market, by Country, 2016 - 2026 (USD Billion)
      2. 4.4.2. Europe Fabricated Metals Market, by Type, 2016 – 2026
        1. 4.4.2.1. Europe Fabricated Metals Market, by Type, 2016 – 2026 (USD Billion)
      3. 4.4.3. Europe Fabricated Metals Market, by End User, 2016 – 2026
        1. 4.4.3.1. Europe Fabricated Metals Market, by End User, 2016 – 2026 (USD Billion)
      4. 4.4.4. Germany
        1. 4.4.4.1. Germany Fabricated Metals Market, 2016 – 2026 (USD Billion)
      5. 4.4.5. France
        1. 4.4.5.1. France Fabricated Metals Market, 2016 – 2026 (USD Billion)
      6. 4.4.6. U.K.
        1. 4.4.6.1. U.K. Fabricated Metals Market, 2016 – 2026 (USD Billion)
      7. 4.4.7. Italy
        1. 4.4.7.1. Italy Fabricated Metals Market, 2016 – 2026 (USD Billion)
      8. 4.4.8. Spain
        1. 4.4.8.1. Spain Fabricated Metals Market, 2016 – 2026 (USD Billion)
      9. 4.4.9. Rest of Europe
        1. 4.4.9.1. Rest of Europe Fabricated Metals Market, 2016 – 2026 (USD Billion)
    5. 4.5. Asia Pacific
      1. 4.5.1. Asia Pacific Fabricated Metals Market, 2016 – 2026 (USD Billion)
        1. 4.5.1.1. Asia Pacific Fabricated Metals Market, by Country, 2016 - 2026 (USD Billion)
      2. 4.5.2. Asia Pacific Fabricated Metals Market, by Type, 2016 – 2026
        1. 4.5.2.1. Asia Pacific Fabricated Metals Market, by Type, 2016 – 2026 (USD Billion)
      3. 4.5.3. Asia Pacific Fabricated Metals Market, by End User, 2016 – 2026
        1. 4.5.3.1. Asia Pacific Fabricated Metals Market, by End User, 2016 – 2026 (USD Billion)
      4. 4.5.4. China
        1. 4.5.4.1. China Fabricated Metals Market, 2016 – 2026 (USD Billion)
      5. 4.5.5. Japan
        1. 4.5.5.1. Japan Fabricated Metals Market, 2016 – 2026 (USD Billion)
      6. 4.5.6. India
        1. 4.5.6.1. India Fabricated Metals Market, 2016 – 2026 (USD Billion)
      7. 4.5.7. South Korea
        1. 4.5.7.1. South Korea Fabricated Metals Market, 2016 – 2026 (USD Billion)
      8. 4.5.8. South-East Asia
        1. 4.5.8.1. South-East Asia Fabricated Metals Market, 2016 – 2026 (USD Billion)
      9. 4.5.9. Rest of Asia Pacific
        1. 4.5.9.1. Rest of Asia Pacific Fabricated Metals Market, 2016 – 2026 (USD Billion)
    6. 4.6. Latin America
      1. 4.6.1. Latin America Fabricated Metals Market, 2016 – 2026 (USD Billion)
        1. 4.6.1.1. Latin America Fabricated Metals Market, by Country, 2016 - 2026 (USD Billion)
      2. 4.6.2. Latin America Fabricated Metals Market, by Type, 2016 – 2026
        1. 4.6.2.1. Latin America Fabricated Metals Market, by Type, 2016 – 2026 (USD Billion)
      3. 4.6.3. Latin America Fabricated Metals Market, by End User, 2016 – 2026
        1. 4.6.3.1. Latin America Fabricated Metals Market, by End User, 2016 – 2026 (USD Billion)
      4. 4.6.4. Brazil
        1. 4.6.4.1. Brazil Fabricated Metals Market, 2016 – 2026 (USD Billion)
      5. 4.6.5. Mexico
        1. 4.6.5.1. Mexico Fabricated Metals Market, 2016 – 2026 (USD Billion)
      6. 4.6.6. Rest of Latin America
        1. 4.6.6.1. Rest of Latin America Fabricated Metals Market, 2016 – 2026 (USD Billion)
    7. 4.7. The Middle-East and Africa
      1. 4.7.1. The Middle-East and Africa Fabricated Metals Market, 2016 – 2026 (USD Billion)
        1. 4.7.1.1. The Middle-East and Africa Fabricated Metals Market, by Country, 2016 - 2026 (USD Billion)
      2. 4.7.2. The Middle-East and Africa Fabricated Metals Market, by Type, 2016 – 2026
        1. 4.7.2.1. The Middle-East and Africa Fabricated Metals Market, by Type, 2016 – 2026 (USD Billion)
      3. 4.7.3. The Middle-East and Africa Fabricated Metals Market, by End User, 2016 – 2026
        1. 4.7.3.1. The Middle-East and Africa Fabricated Metals Market, by End User, 2016 – 2026 (USD Billion)
      4. 4.7.4. GCC Countries
        1. 4.7.4.1. GCC Countries Fabricated Metals Market, 2016 – 2026 (USD Billion)
      5. 4.7.5. South Africa
        1. 4.7.5.1. South Africa Fabricated Metals Market, 2016 – 2026 (USD Billion)
      6. 4.7.6. Rest of Middle-East Africa
        1. 4.7.6.1. Rest of Middle-East Africa Fabricated Metals Market, 2016 – 2026 (USD Billion)
  5. Chapter 5 Fabricated Metals Market – Competitive Landscape
    1. 5.1. Competitor Market Share – Revenue
    2. 5.2. Market Concentration Rate Analysis, Top 3 and Top 5 Players
    3. 5.3. Strategic Developments
      1. 5.3.1. Acquisitions and Mergers
      2. 5.3.2. New Products
      3. 5.3.3. Research & Development Activities
  6. Chapter 6 Company Profiles
    1. 6.1. Toyo Seikan Kaisha, Ltd.
      1. 6.1.1. Company Overview
      2. 6.1.2. Product/Service Portfolio
      3. 6.1.3. Toyo Seikan Kaisha, Ltd. Sales, Revenue, and Gross Margin
      4. 6.1.4. Toyo Seikan Kaisha, Ltd. Revenue and Growth Rate
      5. 6.1.5. Toyo Seikan Kaisha, Ltd. Market Share
      6. 6.1.6. Recent Initiatives, Funding/VC Activities, and Technological Innovations
    2. 6.2. Ball Corporation
      1. 6.2.1. Company Overview
      2. 6.2.2. Product/Service Portfolio
      3. 6.2.3. Ball Corporation Sales, Revenue, and Gross Margin
      4. 6.2.4. Ball Corporation Revenue and Growth Rate
      5. 6.2.5. Ball Corporation Market Share
      6. 6.2.6. Recent Initiatives, Funding/VC Activities, and Technological Innovations
    3. 6.3. Rivers Metal Products Inc.
      1. 6.3.1. Company Overview
      2. 6.3.2. Product/Service Portfolio
      3. 6.3.3. Rivers Metal Products Inc. Sales, Revenue, and Gross Margin
      4. 6.3.4. Rivers Metal Products Inc. Revenue and Growth Rate
      5. 6.3.5. Rivers Metal Products Inc. Market Share
      6. 6.3.6. Recent Initiatives, Funding/VC Activities, and Technological Innovations
    4. 6.4. The Timken Company
      1. 6.4.1. Company Overview
      2. 6.4.2. Product/Service Portfolio
      3. 6.4.3. The Timken Company Sales, Revenue, and Gross Margin
      4. 6.4.4. The Timken Company Revenue and Growth Rate
      5. 6.4.5. The Timken Company Market Share
      6. 6.4.6. Recent Initiatives, Funding/VC Activities, and Technological Innovations
    5. 6.5. Valmont Industries Inc.
      1. 6.5.1. Company Overview
      2. 6.5.2. Product/Service Portfolio
      3. 6.5.3. Valmont Industries Inc. Sales, Revenue, and Gross Margin
      4. 6.5.4. Valmont Industries Inc. Revenue and Growth Rate
      5. 6.5.5. Valmont Industries Inc. Market Share
      6. 6.5.6. Recent Initiatives, Funding/VC Activities, and Technological Innovations
    6. 6.6. Mueller Industries, Inc.
      1. 6.6.1. Company Overview
      2. 6.6.2. Product/Service Portfolio
      3. 6.6.3. Mueller Industries, Inc. Sales, Revenue, and Gross Margin
      4. 6.6.4. Mueller Industries, Inc. Revenue and Growth Rate
      5. 6.6.5. Mueller Industries, Inc. Market Share
      6. 6.6.6. Recent Initiatives, Funding/VC Activities, and Technological Innovations
    7. 6.7. Illinois Tool Works Inc.
      1. 6.7.1. Company Overview
      2. 6.7.2. Product/Service Portfolio
      3. 6.7.3. Illinois Tool Works Inc. Sales, Revenue, and Gross Margin
      4. 6.7.4. Illinois Tool Works Inc. Revenue and Growth Rate
      5. 6.7.5. Illinois Tool Works Inc. Market Share
      6. 6.7.6. Recent Initiatives, Funding/VC Activities, and Technological Innovations
    8. 6.8. Flowserve Corporation
      1. 6.8.1. Company Overview
      2. 6.8.2. Product/Service Portfolio
      3. 6.8.3. Flowserve Corporation Sales, Revenue, and Gross Margin
      4. 6.8.4. Flowserve Corporation Revenue and Growth Rate
      5. 6.8.5. Flowserve Corporation Market Share
      6. 6.8.6. Recent Initiatives, Funding/VC Activities, and Technological Innovations
    9. 6.9. Schaeffler Technologies AG & Co. KG
      1. 6.9.1. Company Overview
      2. 6.9.2. Product/Service Portfolio
      3. 6.9.3. Schaeffler Technologies AG & Co. KG Sales, Revenue, and Gross Margin
      4. 6.9.4. Schaeffler Technologies AG & Co. KG Revenue and Growth Rate
      5. 6.9.5. Schaeffler Technologies AG & Co. KG Market Share
      6. 6.9.6. Recent Initiatives, Funding/VC Activities, and Technological Innovations
    10. 6.10. Smith International Inc
      1. 6.10.1. Company Overview
      2. 6.10.2. Product/Service Portfolio
      3. 6.10.3. Smith International Inc Sales, Revenue, and Gross Margin
      4. 6.10.4. Smith International Inc Revenue and Growth Rate
      5. 6.10.5. Smith International Inc Market Share
      6. 6.10.6. Recent Initiatives, Funding/VC Activities, and Technological Innovations
  7. Chapter 7 Fabricated Metals — Industry Analysis
    1. 7.1. Introduction and Taxonomy
    2. 7.2. Fabricated Metals Market – Key Trends
      1. 7.2.1. Market Drivers
      2. 7.2.2. Market Restraints
      3. 7.2.3. Market Opportunities
    3. 7.3. Value Chain Analysis
    4. 7.4. Key Mandates and Regulations
    5. 7.5. Technology Roadmap and Timeline
    6. 7.6. Fabricated Metals Market – Attractiveness Analysis
      1. 7.6.1. By Type
      2. 7.6.2. By End User
      3. 7.6.3. By Region
  8. Chapter 8 Industrial Chain, Sourcing Strategy, and Downstream Buyers
    1. 8.1. Fabricated Metals Industrial Chain Analysis
    2. 8.2. Downstream Buyers
    3. 8.3. Distributors/Traders List
  9. Chapter 9 Marketing Strategy Analysis
    1. 9.1. Marketing Channel
    2. 9.2. Direct Marketing
    3. 9.3. Indirect Marketing
    4. 9.4. Marketing Channel Development Trends
    5. 9.5. Economic/Political Environmental Change
  10. Chapter 10 Report Conclusion & Key Insights
    1. 10.1. Key Insights from Primary Interviews & Surveys Respondents
    2. 10.2. Key Takeaways from Analysts, Consultants, and Industry Leaders
  11. Chapter 11 Research Approach & Methodology
    1. 11.1. Report Description
    2. 11.2. Research Scope
    3. 11.3. Research Methodology
      1. 11.3.1. Secondary Research
      2. 11.3.2. Primary Research
      3. 11.3.3. Statistical Models
        1. 11.3.3.1. Company Share Analysis Model
        2. 11.3.3.2. Revenue Based Modeling
      4. 11.3.4. Research Limitations

      List of Figures

      Fig.1	Product Picture of Fabricated Metals
      Fig.2	Global Fabricated Metals Market, 2016 – 2026 (USD Billion)
      Fig.3	Global Fabricated Metals Market Absolute Revenue Opportunity, 2016 – 2026 (USD Billion)
      Fig.4	Global Fabricated Metals Market Incremental Revenue Opportunity, 2020 – 2026 (USD Billion)
      Fig.5	COVID-19 Impacts on Fabricated Metal Market
      Fig.6	COVID-19 Impact on the Players
      Fig.7	Business Strategies and Recommendations
      Fig.8	Global Fabricated Metals Market Share, by Type, 2019 & 2026 (USD Billion)
      Fig.9	Global Architectural & Structural Products Fabricated Metals Market, 2016 – 2026 (USD Billion)
      Fig.10	Global Screws, Nuts, and Bolts Fabricated Metals Market, 2016 – 2026 (USD Billion)
      Fig.11	Global Tanks & Shipping Containers Fabricated Metals Market, 2016 – 2026 (USD Billion)
      Fig.12	Global Cutlery and Hand Tools Fabricated Metals Market, 2016 – 2026 (USD Billion)
      Fig.13	Global Boilers Fabricated Metals Market, 2016 – 2026 (USD Billion)
      Fig.14	Global Coating and Heat Treating Fabricated Metals Market, 2016 – 2026 (USD Billion)
      Fig.15	Global Others Fabricated Metals Market, 2016 – 2026 (USD Billion)
      Fig.16	Global Fabricated Metals Market Share, by End User, 2019 & 2026 (USD Billion)
      Fig.17	Global Machinery Fabricated Metals Market, 2016 – 2026 (USD Billion)
      Fig.18	Global Equipment Fabricated Metals Market, 2016 – 2026 (USD Billion)
      Fig.19	Global Construction Fabricated Metals Market, 2016 – 2026 (USD Billion)
      Fig.20	Global Automobile Fabricated Metals Market, 2016 – 2026 (USD Billion)
      Fig.21	Global Others Fabricated Metals Market, 2016 – 2026 (USD Billion)
      Fig.22	Global Fabricated Metals Market Share, by Region, 2019 & 2026 (USD Billion)
      Fig.23	North America Fabricated Metals Market, 2016 – 2026 (USD Billion)
      Fig.24  U.S. Fabricated Metals Market, 2016 – 2026 (USD Billion)
      Fig.25	Canada Fabricated Metals Market, 2016 – 2026 (USD Billion)
      Fig.26	Europe Fabricated Metals Market, 2016 – 2026 (USD Billion)
      Fig.27	Germany Fabricated Metals Market, 2016 – 2026 (USD Billion)
      Fig.28	France Fabricated Metals Market, 2016 – 2026 (USD Billion)
      Fig.29	U.K. Fabricated Metals Market, 2016 – 2026 (USD Billion)
      Fig.30	Italy Fabricated Metals Market, 2016 – 2026 (USD Billion)
      Fig.31	Spain Fabricated Metals Market, 2016 – 2026 (USD Billion)
      Fig.32	Rest of Europe Fabricated Metals Market, 2016 – 2026 (USD Billion)
      Fig.33	Asia Pacific Fabricated Metals Market, 2016 – 2026 (USD Billion)
      Fig.34	China Fabricated Metals Market, 2016 – 2026 (USD Billion)
      Fig.35	Japan Fabricated Metals Market, 2016 – 2026 (USD Billion)
      Fig.36	India Fabricated Metals Market, 2016 – 2026 (USD Billion)
      Fig.37	South  Korea Fabricated Metals Market, 2016 – 2026 (USD Billion)
      Fig.38	South-East Asia Fabricated Metals Market, 2016 – 2026 (USD Billion)
      Fig.39	Rest of Asia Pacific Fabricated Metals Market, 2016 – 2026 (USD Billion)
      Fig.40	Latin America Fabricated Metals Market, 2016 – 2026 (USD Billion)
      Fig.41	Brazil Fabricated Metals Market, 2016 – 2026 (USD Billion)
      Fig.42	Mexico Fabricated Metals Market, 2016 – 2026 (USD Billion)
      Fig.43	Rest of Latin America Fabricated Metals Market, 2016 – 2026 (USD Billion)
      Fig.44	The Middle-East and Africa Fabricated Metals Market, 2016 – 2026 (USD Billion)
      Fig.45	GCC Countries Fabricated Metals Market, 2016 – 2026 (USD Billion)
      Fig.46	South Africa Fabricated Metals Market, 2016 – 2026 (USD Billion)
      Fig.47	Rest of Middle-East Africa Fabricated Metals Market, 2016 – 2026 (USD Billion)
      Fig.48	Competitor Market Share – Revenue
      Fig.49	Toyo Seikan Kaisha, Ltd. Revenue and Growth Rate
      Fig.50	Toyo Seikan Kaisha, Ltd. Market Share
      Fig.51	Ball Corporation Revenue and Growth Rate
      Fig.52	Ball Corporation Market Share
      Fig.53	Rivers Metal Products Inc. Revenue and Growth Rate
      Fig.54	Rivers Metal Products Inc. Market Share
      Fig.55	The Timken Company Revenue and Growth Rate
      Fig.56	The Timken Company Market Share
      Fig.57	Valmont Industries Inc. Revenue and Growth Rate
      Fig.58	Valmont Industries Inc. Market Share
      Fig.59	Mueller Industries, Inc. Revenue and Growth Rate
      Fig.60	Mueller Industries, Inc. Market Share
      Fig.61	Illinois Tool Works Inc. Revenue and Growth Rate
      Fig.62	Illinois Tool Works Inc. Market Share
      Fig.63	Flowserve Corporation Revenue and Growth Rate
      Fig.64	Flowserve Corporation Market Share
      Fig.65	Schaeffler Technologies AG & Co. KG Revenue and Growth Rate
      Fig.66	Schaeffler Technologies AG & Co. KG Market Share
      Fig.67	Smith International Inc Revenue and Growth Rate
      Fig.68	Smith International Inc Market Share
      Fig.69	Market Dynamics
      Fig.70	Global Fabricated Metals – Value Chain Analysis
      Fig.71	Key Mandates and Regulations
      Fig.72	Technology Roadmap and Timeline
      Fig.73	Market Attractiveness Analysis – By Type
      Fig.74	Market Attractiveness Analysis – By End User
      Fig.75	Market Attractiveness Analysis – By Region
      Fig.76	Fabricated Metals Industrial Chain Analysis
      Fig.77	Market Channels
      Fig.78	Marketing Channel Development Trend
      Fig.79	Growth in World Gross Product, 2008-2018
      

      List of Tables

      Table 1	Global Fabricated Metals Market, 2019 & 2026 (USD Billion)
      Table 2	Global Fabricated Metals Market, by Type, 2016 – 2026 (USD Billion)
      Table 3	Global Fabricated Metals Market, by End User, 2016 – 2026 (USD Billion)
      Table 4	Global Fabricated Metals Market, by Region, 2016 – 2026 (USD Billion)
      Table 5	North America Fabricated Metals Market, by Country, 2016 – 2026 (USD Billion)
      Table 6	North America Fabricated Metals Market, by Type, 2016 – 2026 (USD Billion)
      Table 7	North America Fabricated Metals Market, by End User, 2016 – 2026 (USD Billion)
      Table 8 Europe Fabricated Metals Market, by Country, 2016 – 2026 (USD Billion)
      Table 9 Europe Fabricated Metals Market, by Type, 2016 – 2026 (USD Billion)
      Table 10 Europe Fabricated Metals Market, by End User, 2016 – 2026 (USD Billion)
      Table 11 Asia Pacific Fabricated Metals Market, by Country, 2016 – 2026 (USD Billion)
      Table 12 Asia Pacific Fabricated Metals Market, by Type, 2016 – 2026 (USD Billion)
      Table 13 Asia Pacific Fabricated Metals Market, by End User, 2016 – 2026 (USD Billion)
      Table 14 Latin America Fabricated Metals Market, by Country, 2016 – 2026 (USD Billion)
      Table 15 Latin America Fabricated Metals Market, by Type, 2016 – 2026 (USD Billion)
      Table 16 Latin America Fabricated Metals Market, by End User, 2016 – 2026 (USD Billion)
      Table 17 The Middle-East and Africa Fabricated Metals Market, by Country, 2016 – 2026 (USD Billion)
      Table 18 The Middle-East and Africa Fabricated Metals Market, by Type, 2016 – 2026 (USD Billion)
      Table 19 The Middle-East and Africa Fabricated Metals Market, by End User, 2016 – 2026 (USD Billion)
      Table 20 Global Fabricated Metals Market - Company Revenue Analysis, 2016 – 2019 (USD Billion)
      Table 21 Global Fabricated Metals Market - Company Revenue Share Analysis, 2016 – 2019 (%)
      Table 22 Acquisitions and Mergers
      Table 23 Market Drivers – Impact Analysis
      Table 24 Market Restraints
      Table 25 Market Opportunities
      Table 26 Major Buyers of Fabricated Metals
      Table 27	Distributors/Traders of Fabricated Metals by Region
      

Industry Major Market Players

  • The Timken Company
  • Valmont Industries Inc.
  • Mueller Industries, Inc.
  • Illinois Tool Works Inc.
  • Toyo Seikan Kaisha, Ltd.
  • Ball Corporation
  • Rivers Metal Products Inc.
  • Flowserve Corporation
  • Schaeffler Technologies AG & Co. KG
  • Smith International Inc.