Search Market Research Report

Discover Our Latest Reports
Discover Our Featured Reports
Discover Top Selling Reports

Ethylene Vinyl Acetate Market Size, Share Global Analysis Report, 2020–2026

report img

Ethylene Vinyl Acetate Market By Type (VLEVA, LEVA, MEVA, and HEVA) and By Application (Film, Foam, Adhesives, and Others) and By End User Industry (Packaging, Solar, Agriculture, Wire & cable, Automotive, Footwear, and Others): Global Industry Outlook, Market Size, Business Intelligence, Consumer Preferences, Statistical Surveys, Comprehensive Analysis, Historical Developments, Current Trends, and Forecast 2020–2026

Industry Insights

The Ethylene-vinyl acetate market report analyzes and notifies the industry statistics at the global as well as regional and country levels in order to acquire a thorough perspective of the entire Ethylene-vinyl acetate market. The historical and past insights are provided for FY 2016 to FY 2019 whereas projected trends are delivered for FY 2020 to FY 2026. The quantitative and numerical data is represented in terms of both volume (Kilo Tons) and value (USD Million) from FY 2016 – 2026.

This specialized and expertise oriented industry research report scrutinizes the technical and commercial business outlook of the Ethylene-vinyl acetate industry. The report analyzes and declares the historical and current trends analysis of the Ethylene-vinyl acetate industry and subsequently recommends the projected trends anticipated to be observed in the Ethylene-vinyl acetate market during the upcoming years.

Ethylene Vinyl Acetate Market Size

To know more about this report | Request Free Sample Copy


logoKey Insights from Primary Research

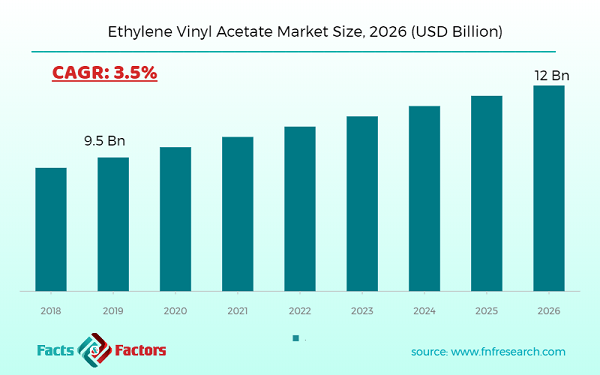
  • It was recognized through primary research that the ethylene vinyl acetate market was valued at around USD 9.5 Billion in 2019.
  • Asia Pacific is expected to hold the largest market share of the ethylene vinyl acetate in terms of revenue, in 2019.
  • Based on type based segmentation the “HEVA” category, was the leading revenue-generating category in 2019.
  • Based on application, the “packaging” category, , contributing to the largest revenue-generation.
  • According to our primary respondents, the ethylene vinyl acetate market is set to grow annually at a rate of around 3.5%

logoKey Recommendations from Analysts

  • As per our Analysts, The Asia Pacific is expected to hold the largest market share owing to augmented demand from end-use industries such as packaging, footwear & foam, agriculture, and pharmaceutical in Asia-Pacific.
  • North America is projected to the second largest market share followed by Europe. The growth in the injection molding adhesives and film is expected to generate significant demand in the countries.
  • Adhesives and film applications are projected to generate momentous demand. The augmented demand from the automotive and packaging industry is expected to fetch maximum volume for the market.
  • The ethylene vinyl acetate market is expected to grow at a significant rate owing to high efficiency and affordable pricing is driving the ethylene vinyl acetate market in the forecasted time.
  • Rapid industrialization and an increase in disposable income across emerging economies, such as India and China are expected to boost the automobile's demand.

logo
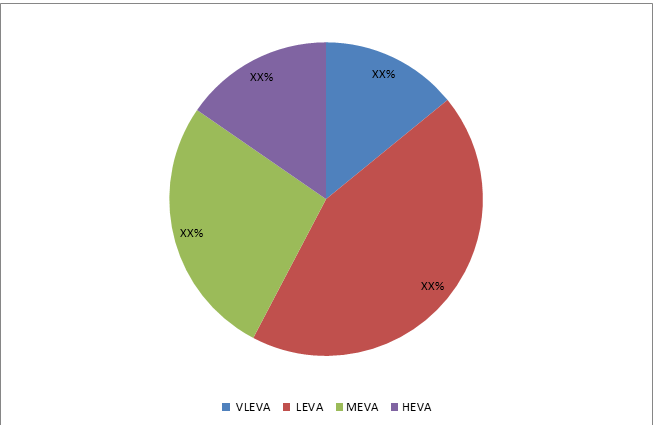
Ethylene Vinyl Acetate Market share in 2019, by Application

Ethylene-vinyl acetate Market

To know more about this report | Request Free Sample Copy


The quantitative data is further underlined and reinforced by comprehensive qualitative data which comprises various across-the-board market dynamics. The rationales which directly or indirectly impact the Ethylene-vinyl acetate industry are exemplified through parameters such as growth drivers, restraints, challenges, and opportunities among other impacting factors.

Throughout our research report, we have encompassed all the proven models and tools of industry analysis and extensively illustrated all the key business strategies and business models adopted in the Ethylene-vinyl acetate industry. The report provides an all-inclusive and detailed competitive landscape prevalent in the Ethylene-vinyl acetate market.

The report utilizes established industry analysis tools and models such as Porter’s Five Forces framework to analyze and recognize critical business strategies adopted by various stakeholders involved in the entire value chain of the Ethylene-vinyl acetate industry. The Ethylene-vinyl acetate market report additionally employs SWOT analysis and PESTLE analysis models for further in-depth analysis.

The report study further includes an in-depth analysis of industry players' market shares and provides an overview of leading players' market position in the Ethylene-vinyl acetate sector. Key strategic developments in the Ethylene-vinyl acetate market competitive landscape such as acquisitions & mergers, inaugurations of different products and services, partnerships & joint ventures, MoU agreements, VC & funding activities, R&D activities, and geographic expansion among other noteworthy activities by key players of the Ethylene-vinyl acetate market are appropriately highlighted in the report.

The Ethylene-vinyl acetate market research report delivers an acute valuation and taxonomy of the Ethylene-vinyl acetate industry by practically splitting the market on the basis of different types, applications, and regions. Through the analysis of the historical and projected trends, all the segments and sub-segments were evaluated through the bottom-up approach, and different market sizes have been projected for FY 2020 to FY 2026. The regional segmentation of the Ethylene-vinyl acetate industry includes the complete classification of all the major continents including North America, Latin America, Europe, Asia Pacific, and the Middle East & Africa. Further, country-wise data for the Ethylene-vinyl acetate industry is provided for the leading economies of the world.

The Ethylene-vinyl acetate market is segmented based on Type and Application.  On the basis of type segmentation, the market is classified into VLEVA, LEVA, MEVA, and HEVA. In terms of Application segmentation, the market is bifurcated into Film, Foam, Adhesives, and Others. Moreover, On the basis of end-user segmentation, the market is classified into packaging, solar, agriculture, wire & cable, automotive, footwear, and others.

logoReport Scope

Report Attribute

Details

Market Size in 2019

USD 9.5 Billion

Projected Market Size in 2026

USD 12 Billion

CAGR Growth Rate

3.5% CAGR

Base Year

2019

Forecast Years

2020-2026

Key Market Players

E. I. du Pont de Nemours and Company, Versalis S.p.A., Hanwha Chemical, Lotte Chemical Corporation, USI Corporation, ExxonMobil Corporation, Celanese Corporation, Arkema S.A., LyondellBasell Industries NV, Formosa Plastics Corporation., and others.

Key Segment

By Type, Application, End-use industry, and Region

Major Regions Covered

North America, Europe, Asia Pacific, Latin America, and the Middle East &, Africa

Purchase Options

Request customized purchase options to meet your research needs. Explore purchase options

logoSome of the essential players operating in the Ethylene-vinyl acetate market, but not restricted to include

  •  E. I. du Pont de Nemours and Company
  •  Versalis S.p.A.
  •  Hanwha Chemical
  •  Lotte Chemical Corporation
  •  USI Corporation
  •  ExxonMobil Corporation
  •  Celansese Corporation
  •  Arkema S.A.
  •  LyondellBasell Industries NV
  •  Formosa Plastics Corporation.

The taxonomy of the Ethylene-vinyl acetate industry by its scope and segmentation is as follows:

logoGlobal ethylene vinyl acetate Market: By Type Segmentation Analysis (Customizable)

  • VLEVA
  • LEVA
  • MEVA
  • HEVA

logoGlobal ethylene vinyl acetate Market: By Application Segmentation Analysis (Customizable)

  • Film
  • Foam
  • Adhesives
  • Others

logoGlobal ethylene vinyl acetate Market: By End use industry Segmentation Analysis (Customizable)

  • Packaging
  • Solar
  • Agriculture
  • Wire & cable
  • Automotive
  • Footwear
  • Others

logoGlobal Ethylene-vinyl Acetate Market: Regional Segmentation Analysis (Customizable)

  • North America
    • The U.S.
    • Canada
  • Europe
    • Germany
    • The UK
    • France
    • Spain
    • Italy
    • Rest of Europe
  • Asia Pacific
    • China
    • Japan
    • India
    • South Korea
    • Southeast Asia
    • Rest of Asia Pacific
  • Latin America
    • Brazil
    • Mexico
    • Rest of Latin America
  • Middle East & Africa
    • GCC
    • South Africa
    • Rest of the Middle East & Africa

Table of Content

  1. CHAPTER 1. Executive Summary
  2. CHAPTER 2. Ethylene Vinyl Acetate market – Type Analysis
    1. 2.1. Global Ethylene Vinyl Acetate Market – Type Overview
    2. 2.2. Global Ethylene Vinyl Acetate Market Share, by Type, 2018 & 2025 (USD Million)
    3. 2.3. Global Ethylene Vinyl Acetate Market share, by Type, 2018 & 2025 (Kilo Tons)
    4. 2.4. VLEVA
      1. 2.4.1. Global VLEVA Ethylene Vinyl Acetate Market, 2016-2026 (USD Million)
      2. 2.4.2. Global VLEVA Ethylene Vinyl Acetate Market, 2016-2026 (Kilo Tons)
    5. 2.5. LEVA
      1. 2.5.1. Global LEVA Ethylene Vinyl Acetate Market, 2016-2026 (USD Million)
      2. 2.5.2. Global LEVA Ethylene Vinyl Acetate Market, 2016-2026 (Kilo Tons)
    6. 2.6. MEVA
      1. 2.6.1. Global MEVA Ethylene Vinyl Acetate Market, 2016-2026 (USD Million)
      2. 2.6.2. Global MEVA Ethylene Vinyl Acetate Market, 2016-2026 (Kilo Tons)
    7. 2.7. HEVA
      1. 2.7.1. Global HEVA Ethylene Vinyl Acetate Market, 2016-2026 (USD Million)
      2. 2.7.2. Global HEVA Ethylene Vinyl Acetate Market, 2016-2026 (Kilo Tons)
  3. CHAPTER 3. Ethylene Vinyl Acetate market – Application Analysis
    1. 3.1. Global Ethylene Vinyl Acetate Market – Application Overview
    2. 3.2. Global Ethylene Vinyl Acetate Market Share, by Application, 2018 & 2025 (USD Million)
    3. 3.3. Global Ethylene Vinyl Acetate Market share, by Application, 2018 & 2025 (Kilo Tons)
    4. 3.4. Film
      1. 3.4.1. Global Film Ethylene Vinyl Acetate Market, 2016-2026 (USD Million)
      2. 3.4.2. Global Film Ethylene Vinyl Acetate Market, 2016-2026 (Kilo Tons)
    5. 3.5. Foam
      1. 3.5.1. Global Foam Ethylene Vinyl Acetate Market, 2016-2026 (USD Million)
      2. 3.5.2. Global Foam Ethylene Vinyl Acetate Market, 2016-2026 (Kilo Tons)
    6. 3.6. Adhesives
      1. 3.6.1. Global Adhesives Ethylene Vinyl Acetate Market, 2016-2026 (USD Million)
      2. 3.6.2. Global Adhesives Ethylene Vinyl Acetate Market, 2016-2026 (Kilo Tons)
    7. 3.7. Others
      1. 3.7.1. Global Others Ethylene Vinyl Acetate Market, 2016-2026 (USD Million)
      2. 3.7.2. Global Others Ethylene Vinyl Acetate Market, 2016-2026 (Kilo Tons)
  4. CHAPTER 4. Ethylene Vinyl Acetate market – End Use Analysis
    1. 4.1. Global Ethylene Vinyl Acetate Market – End Use Overview
    2. 4.2. Global Ethylene Vinyl Acetate Market Share, by End Use, 2018 & 2025 (USD Million)
    3. 4.3. Global Ethylene Vinyl Acetate Market share, by End Use, 2018 & 2025 (Kilo Tons)
    4. 4.4. Packaging
      1. 4.4.1. Global Packaging Ethylene Vinyl Acetate Market, 2016-2026 (USD Million)
      2. 4.4.2. Global Packaging Ethylene Vinyl Acetate Market, 2016-2026 (Kilo Tons)
    5. 4.5. Solar
      1. 4.5.1. Global Solar Ethylene Vinyl Acetate Market, 2016-2026 (USD Million)
      2. 4.5.2. Global Solar Ethylene Vinyl Acetate Market, 2016-2026 (Kilo Tons)
    6. 4.6. Agriculture
      1. 4.6.1. Global Agriculture Ethylene Vinyl Acetate Market, 2016-2026 (USD Million)
      2. 4.6.2. Global Agriculture Ethylene Vinyl Acetate Market, 2016-2026 (Kilo Tons)
    7. 4.7. Wire & cable
      1. 4.7.1. Global Wire & cable Ethylene Vinyl Acetate Market, 2016-2026 (USD Million)
      2. 4.7.2. Global Wire & cable Ethylene Vinyl Acetate Market, 2016-2026 (Kilo Tons)
    8. 4.8. Automotive
      1. 4.8.1. Global Automotive Ethylene Vinyl Acetate Market, 2016-2026 (USD Million)
      2. 4.8.2. Global Automotive Ethylene Vinyl Acetate Market, 2016-2026 (Kilo Tons)
    9. 4.9. Footwear
      1. 4.9.1. Global Footwear Ethylene Vinyl Acetate Market, 2016-2026 (USD Million)
      2. 4.9.2. Global Footwear Ethylene Vinyl Acetate Market, 2016-2026 (Kilo Tons)
    10. 4.10. Others
      1. 4.10.1. Global Others Ethylene Vinyl Acetate Market, 2016-2026 (USD Million)
      2. 4.10.2. Global Others Ethylene Vinyl Acetate Market, 2016-2026 (Kilo Tons)
  5. CHAPTER 5. Ethylene Vinyl Acetate market – Regional Analysis
    1. 5.1. Global Ethylene Vinyl Acetate Market Regional Overview
    2. 5.2. Global Ethylene Vinyl Acetate Market Share, by Region, 2018 & 2025 (Value)
    3. 5.3. Global Ethylene Vinyl Acetate Market Share, by Region, 2018 & 2025 (Volume)
    4. 5.4. North America
      1. 5.4.1. North America Ethylene Vinyl Acetate Market size and forecast, 2016-2026
      2. 5.4.2. North America Ethylene Vinyl Acetate Market, by Country, 2018 - 2025 (USD Million)
      3. 5.4.3. North America Market size and forecast, 2016-2026 (Kilo Tons)
      4. 5.4.4. North America Ethylene Vinyl Acetate Market, by Country, 2018 - 2025 (Kilo Tons)
      5. 5.4.5. North America Ethylene Vinyl Acetate Market, by Type, 2016-2026
        1. 5.4.5.1. North America Ethylene Vinyl Acetate Market, by Type, 2016-2026 (USD Million)
        2. 5.4.5.2. North America Ethylene Vinyl Acetate Market, by Type, 2016-2026 (Kilo Tons)
      6. 5.4.6. North America Ethylene Vinyl Acetate Market, by Application, 2016-2026
        1. 5.4.6.1. North America Ethylene Vinyl Acetate Market, by Application, 2016-2026 (USD Million)
        2. 5.4.6.2. North America Ethylene Vinyl Acetate Market, by Application, 2016-2026 (Kilo Tons)
      7. 5.4.7. North America Ethylene Vinyl Acetate Market, by End Use, 2016-2026
        1. 5.4.7.1. North America Ethylene Vinyl Acetate Market, by End Use, 2016-2026 (USD Million)
        2. 5.4.7.2. North America Ethylene Vinyl Acetate Market, by End Use, 2016-2026 (Kilo Tons)
      8. 5.4.8. U.S.
        1. 5.4.8.1. U.S. Market size and forecast, 2016-2026 (USD Million)
        2. 5.4.8.2. U.S. Market size and forecast, 2016-2026 (Kilo Tons)
      9. 5.4.9. Canada
        1. 5.4.9.1. Canada Market size and forecast, 2016-2026 (USD Million)
        2. 5.4.9.2. Canada Market size and forecast, 2016-2026 (Kilo Tons)
    5. 5.5. Europe
      1. 5.5.1. Europe Ethylene Vinyl Acetate Market size and forecast, 2016-2026
      2. 5.5.2. Europe Ethylene Vinyl Acetate Market, by Country, 2018 - 2025 (USD Million)
      3. 5.5.3. Europe Market size and forecast, 2016-2026 (Kilo Tons)
      4. 5.5.4. Europe Ethylene Vinyl Acetate Market, by Country, 2018 - 2025 (Kilo Tons)
      5. 5.5.5. Europe Ethylene Vinyl Acetate Market, by Type, 2016-2026
        1. 5.5.5.1. Europe Ethylene Vinyl Acetate Market, by Type, 2016-2026 (USD Million)
        2. 5.5.5.2. Europe Ethylene Vinyl Acetate Market, by Type, 2016-2026 (Kilo Tons)
      6. 5.5.6. Europe Ethylene Vinyl Acetate Market, by Application, 2016-2026
        1. 5.5.6.1. Europe Ethylene Vinyl Acetate Market, by Application, 2016-2026 (USD Million)
        2. 5.5.6.2. Europe Ethylene Vinyl Acetate Market, by Application, 2016-2026 (Kilo Tons)
      7. 5.5.7. Europe Ethylene Vinyl Acetate Market, by End Use, 2016-2026
        1. 5.5.7.1. Europe Ethylene Vinyl Acetate Market, by End Use, 2016-2026 (USD Million)
        2. 5.5.7.2. Europe Ethylene Vinyl Acetate Market, by End Use, 2016-2026 (Kilo Tons)
      8. 5.5.8. Germany
        1. 5.5.8.1. Germany Market size and forecast, 2016-2026 (USD Million)
        2. 5.5.8.2. Germany Market size and forecast, 2016-2026 (Kilo Tons)
      9. 5.5.9. France
        1. 5.5.9.1. France Market size and forecast, 2016-2026 (USD Million)
        2. 5.5.9.2. France Market size and forecast, 2016-2026 (Kilo Tons)
      10. 5.5.10. U.K.
        1. 5.5.10.1. U.K. Market size and forecast, 2016-2026 (USD Million)
        2. 5.5.10.2. U.K. Market size and forecast, 2016-2026 (Kilo Tons)
      11. 5.5.11. Italy
        1. 5.5.11.1. Italy Market size and forecast, 2016-2026 (USD Million)
        2. 5.5.11.2. Italy Market size and forecast, 2016-2026 (Kilo Tons)
      12. 5.5.12. Spain
        1. 5.5.12.1. Spain Market size and forecast, 2016-2026 (USD Million)
        2. 5.5.12.2. Spain Market size and forecast, 2016-2026 (Kilo Tons)
      13. 5.5.13. Rest of Europe
        1. 5.5.13.1. Rest of Europe Market size and forecast, 2016-2026 (USD Million)
        2. 5.5.13.2. Rest of Europe Market size and forecast, 2016-2026 (Kilo Tons)
    6. 5.6. Asia Pacific
      1. 5.6.1. Asia Pacific Ethylene Vinyl Acetate Market size and forecast, 2016-2026
      2. 5.6.2. Asia Pacific Ethylene Vinyl Acetate Market, by Country, 2018 - 2025 (USD Million)
      3. 5.6.3. Asia Pacific Market size and forecast, 2016-2026 (Kilo Tons)
      4. 5.6.4. Asia Pacific Ethylene Vinyl Acetate Market, by Country, 2018 - 2025 (Kilo Tons)
      5. 5.6.5. Asia Pacific Ethylene Vinyl Acetate Market, by Type, 2016-2026
        1. 5.6.5.1. Asia Pacific Ethylene Vinyl Acetate Market, by Type, 2016-2026 (USD Million)
        2. 5.6.5.2. Asia Pacific Ethylene Vinyl Acetate Market, by Type, 2016-2026 (Kilo Tons)
      6. 5.6.6. Asia Pacific Ethylene Vinyl Acetate Market, by Application, 2016-2026
        1. 5.6.6.1. Asia Pacific Ethylene Vinyl Acetate Market, by Application, 2016-2026 (USD Million)
        2. 5.6.6.2. Asia Pacific Ethylene Vinyl Acetate Market, by Application, 2016-2026 (Kilo Tons)
      7. 5.6.7. Asia Pacific Ethylene Vinyl Acetate Market, by End Use, 2016-2026
        1. 5.6.7.1. Asia Pacific Ethylene Vinyl Acetate Market, by End Use, 2016-2026 (USD Million)
        2. 5.6.7.2. Asia Pacific Ethylene Vinyl Acetate Market, by End Use, 2016-2026 (Kilo Tons)
      8. 5.6.8. China
        1. 5.6.8.1. China Market size and forecast, 2016-2026 (USD Million)
        2. 5.6.8.2. China Market size and forecast, 2016-2026 (Kilo Tons)
      9. 5.6.9. Japan
        1. 5.6.9.1. Japan Market size and forecast, 2016-2026 (USD Million)
        2. 5.6.9.2. Japan Market size and forecast, 2016-2026 (Kilo Tons)
      10. 5.6.10. India
        1. 5.6.10.1. India Market size and forecast, 2016-2026 (USD Million)
        2. 5.6.10.2. India Market size and forecast, 2016-2026 (Kilo Tons)
      11. 5.6.11. South Korea
        1. 5.6.11.1. South Korea Market size and forecast, 2016-2026 (USD Million)
        2. 5.6.11.2. South Korea Market size and forecast, 2016-2026 (Kilo Tons)
      12. 5.6.12. South-East Asia
        1. 5.6.12.1. South-East Asia Market size and forecast, 2016-2026 (USD Million)
        2. 5.6.12.2. South-East Asia Market size and forecast, 2016-2026 (Kilo Tons)
      13. 5.6.13. Rest of Asia Pacific
        1. 5.6.13.1. Rest of Asia Pacific Market size and forecast, 2016-2026 (USD Million)
        2. 5.6.13.2. Rest of Asia Pacific Market size and forecast, 2016-2026 (Kilo Tons)
    7. 5.7. Latin America
      1. 5.7.1. Latin America Ethylene Vinyl Acetate Market size and forecast, 2016-2026
      2. 5.7.2. Latin America Ethylene Vinyl Acetate Market, by Country, 2018 - 2025 (USD Million)
      3. 5.7.3. Latin America Market size and forecast, 2016-2026 (Kilo Tons)
      4. 5.7.4. Latin America Ethylene Vinyl Acetate Market, by Country, 2018 - 2025 (Kilo Tons)
      5. 5.7.5. Latin America Ethylene Vinyl Acetate Market, by Type, 2016-2026
        1. 5.7.5.1. Latin America Ethylene Vinyl Acetate Market, by Type, 2016-2026 (USD Million)
        2. 5.7.5.2. Latin America Ethylene Vinyl Acetate Market, by Type, 2016-2026 (Kilo Tons)
      6. 5.7.6. Latin America Ethylene Vinyl Acetate Market, by Application, 2016-2026
        1. 5.7.6.1. Latin America Ethylene Vinyl Acetate Market, by Application, 2016-2026 (USD Million)
        2. 5.7.6.2. Latin America Ethylene Vinyl Acetate Market, by Application, 2016-2026 (Kilo Tons)
      7. 5.7.7. Latin America Ethylene Vinyl Acetate Market, by End Use, 2016-2026
        1. 5.7.7.1. Latin America Ethylene Vinyl Acetate Market, by End Use, 2016-2026 (USD Million)
        2. 5.7.7.2. Latin America Ethylene Vinyl Acetate Market, by End Use, 2016-2026 (Kilo Tons)
      8. 5.7.8. Brazil
        1. 5.7.8.1. Brazil Market size and forecast, 2016-2026 (USD Million)
        2. 5.7.8.2. Brazil Market size and forecast, 2016-2026 (Kilo Tons)
      9. 5.7.9. Mexico
        1. 5.7.9.1. Mexico Market size and forecast, 2016-2026 (USD Million)
        2. 5.7.9.2. Mexico Market size and forecast, 2016-2026 (Kilo Tons)
      10. 5.7.10. Rest of Latin America
        1. 5.7.10.1. Rest of Latin America Market size and forecast, 2016-2026 (USD Million)
        2. 5.7.10.2. Rest of Latin America Market size and forecast, 2016-2026 (Kilo Tons)
    8. 5.8. The Middle-East and Africa
      1. 5.8.1. The Middle-East and Africa Ethylene Vinyl Acetate Market size and forecast, 2016-2026
      2. 5.8.2. The Middle-East and Africa Ethylene Vinyl Acetate Market, by Country, 2018 - 2025 (USD Million)
      3. 5.8.3. The Middle-East and Africa Market size and forecast, 2016-2026 (Kilo Tons)
      4. 5.8.4. The Middle-East and Africa Ethylene Vinyl Acetate Market, by Country, 2018 - 2025 (Kilo Tons)
      5. 5.8.5. The Middle-East and Africa Ethylene Vinyl Acetate Market, by Type, 2016-2026
        1. 5.8.5.1. The Middle-East and Africa Ethylene Vinyl Acetate Market, by Type, 2016-2026 (USD Million)
        2. 5.8.5.2. The Middle-East and Africa Ethylene Vinyl Acetate Market, by Type, 2016-2026 (Kilo Tons)
      6. 5.8.6. The Middle-East and Africa Ethylene Vinyl Acetate Market, by Application, 2016-2026
        1. 5.8.6.1. The Middle-East and Africa Ethylene Vinyl Acetate Market, by Application, 2016-2026 (USD Million)
        2. 5.8.6.2. The Middle-East and Africa Ethylene Vinyl Acetate Market, by Application, 2016-2026 (Kilo Tons)
      7. 5.8.7. The Middle-East and Africa Ethylene Vinyl Acetate Market, by End Use, 2016-2026
        1. 5.8.7.1. The Middle-East and Africa Ethylene Vinyl Acetate Market, by End Use, 2016-2026 (USD Million)
        2. 5.8.7.2. The Middle-East and Africa Ethylene Vinyl Acetate Market, by End Use, 2016-2026 (Kilo Tons)
      8. 5.8.8. GCC Countries
        1. 5.8.8.1. GCC Countries Market size and forecast, 2016-2026 (USD Million)
        2. 5.8.8.2. GCC Countries Market size and forecast, 2016-2026 (Kilo Tons)
      9. 5.8.9. South Africa
        1. 5.8.9.1. South Africa Market size and forecast, 2016-2026 (USD Million)
        2. 5.8.9.2. South Africa Market size and forecast, 2016-2026 (Kilo Tons)
      10. 5.8.10. Rest of Middle-East Africa
        1. 5.8.10.1. Rest of Middle-East Africa Market size and forecast, 2016-2026 (USD Million)
        2. 5.8.10.2. Rest of Middle-East Africa Market size and forecast, 2016-2026 (Kilo Tons)
  6. CHAPTER 6. Ethylene Vinyl Acetate Production, Consumption, Export, Import by Regions
    1. 6.1. Global Ethylene Vinyl Acetate production and revenue, 2015-2025 (USD Million) (Kilo Tons)
    2. 6.2. Global Import and Export Analysis, by Region
  7. CHAPTER 7. Ethylene Vinyl Acetate market – Competitive Landscape
    1. 7.1. Competitor Market Share – Revenue
    2. 7.2. Market Concentration Rate Analysis, Top 3 and Top 5 Players
    3. 7.3. Competitor Market Share – Volume
    4. 7.4. Strategic Development
      1. 7.4.1. Acquisitions and Mergers
      2. 7.4.2. New Products
      3. 7.4.3. Research & Development Activities
  8. CHAPTER 8. Company Profiles
    1. 8.1. E. I. du Pont de Nemours and Company
      1. 8.1.1. Company Overview
      2. 8.1.2. E. I. du Pont de Nemours and Company Sales, Revenue, Price, and Gross Margin
      3. 8.1.3. Product portfolio
      4. 8.1.4. Recent initiatives
    2. 8.2. Versalis S.p.A.
      1. 8.2.1. Company Overview
      2. 8.2.2. Versalis S.p.A. Sales, Revenue, Price, and Gross Margin
      3. 8.2.3. Product portfolio
      4. 8.2.4. Recent initiatives
    3. 8.3. Hanwha Chemical
      1. 8.3.1. Company Overview
      2. 8.3.2. Hanwha Chemical Sales, Revenue, Price, and Gross Margin
      3. 8.3.3. Product portfolio
      4. 8.3.4. Recent initiatives
    4. 8.4. Lotte Chemical Corporation
      1. 8.4.1. Company Overview
      2. 8.4.2. Lotte Chemical Corporation Sales, Revenue, Price, and Gross Margin
      3. 8.4.3. Product portfolio
      4. 8.4.4. Recent initiatives
    5. 8.5. USI Corporation
      1. 8.5.1. Company Overview
      2. 8.5.2. USI Corporation Sales, Revenue, Price, and Gross Margin
      3. 8.5.3. Product portfolio
      4. 8.5.4. Recent initiatives
    6. 8.6. ExxonMobil Corporation
      1. 8.6.1. Company Overview
      2. 8.6.2. ExxonMobil Corporation Sales, Revenue, Price, and Gross Margin
      3. 8.6.3. Product portfolio
      4. 8.6.4. Recent initiatives
    7. 8.7. Celansese Corporation
      1. 8.7.1. Company Overview
      2. 8.7.2. Celansese Corporation Sales, Revenue, Price, and Gross Margin
      3. 8.7.3. Product portfolio
      4. 8.7.4. Recent initiatives
    8. 8.8. Arkema S.A.
      1. 8.8.1. Company Overview
      2. 8.8.2. Arkema S.A. Sales, Revenue, Price, and Gross Margin
      3. 8.8.3. Product portfolio
      4. 8.8.4. Recent initiatives
    9. 8.9. LyondellBasell Industries NV
      1. 8.9.1. Company Overview
      2. 8.9.2. LyondellBasell Industries NV Sales, Revenue, Price, and Gross Margin
      3. 8.9.3. Product portfolio
      4. 8.9.4. Recent initiatives
    10. 8.10. Formosa Plastics Corporation
      1. 8.10.1. Company Overview
      2. 8.10.2. Formosa Plastics Corporation Sales, Revenue, Price, and Gross Margin
      3. 8.10.3. Product portfolio
      4. 8.10.4. Recent initiatives
  9. CHAPTER 9. Ethylene Vinyl Acetate — Industry Analysis
    1. 9.1. Introduction and Taxonomy
    2. 9.2. Ethylene Vinyl Acetate Market – Key Trends
      1. 9.2.1. Market Drivers
      2. 9.2.2. Market Restraints
      3. 9.2.3. Market Opportunities
    3. 9.3. Value Chain Analysis
    4. 9.4. Key Mandates and Regulations
    5. 9.5. Technology Roadmap and Timeline
    6. 9.6. Ethylene Vinyl Acetate market – Attractiveness Analysis
      1. 9.6.1. By Type
      2. 9.6.2. By Application
      3. 9.6.3. By End Use
      4. 9.6.4. By Region
  10. CHAPTER 10. Raw Material analysis
    1. 10.1. Ethylene Vinyl Acetate Key Raw Material Analysis
      1. 10.1.1. Key Raw Materials
      2. 10.1.2. Price Trend of Key Raw Materials
    2. 10.2. Key Suppliers of Raw Materials
    3. 10.3. Proportion of Manufacturing Cost Structure
      1. 10.3.1. Raw Materials
      2. 10.3.2. Labor Cost
    4. 10.4. Manufacturing Expenses Analysis of Ethylene Vinyl Acetate
  11. CHAPTER 11. Industrial Chain, Sourcing Strategy and Downstream Buyers
    1. 11.1. Ethylene Vinyl Acetate Industrial Chain Analysis
    2. 11.2. Upstream Raw Materials Sourcing
      1. 11.2.1. Risk Mitigation:
      2. 11.2.2. Supplier Relationships:
      3. 11.2.3. Business Processes:
      4. 11.2.4. Securing the Product:
    3. 11.3. Raw Materials Sources of Ethylene Vinyl Acetate Major Manufacturers in 2016
    4. 11.4. Downstream Buyers
    5. 11.5. Distributors/Traders List
  12. CHAPTER 12. Marketing Strategy Analysis, Distributors
    1. 12.1. Marketing Channel
    2. 12.2. Direct Marketing
    3. 12.3. Indirect Marketing
    4. 12.4. Marketing Channel Development Trend
    5. 12.5. Economic/Political Environmental Change
  13. CHAPTER 13. Report Conclusion
  14. CHAPTER 14. Research Approach & Methodology
    1. 14.1. Report Description
    2. 14.2. Research Scope
    3. 14.3. Research Methodology
      1. 14.3.1. Secondary Research
      2. 14.3.2. Primary Research
      3. 14.3.3. Models
        1. 14.3.3.1. Company Share Analysis Model
        2. 14.3.3.2. Revenue Based Modeling
        3. 14.3.3.3. Research Limitations

        List of Figures

        FIG. 1 Global Ethylene Vinyl Acetate Market, 2016-2026 (USD Million)
        FIG. 2 Global Ethylene Vinyl Acetate Market Share, by  Type, 2018 & 2025 (USD Million)
        FIG. 3 Global Ethylene Vinyl Acetate Market share, by  Type, 2018 & 2025 (Kilo Tons)
        FIG. 4 Global VLEVA Ethylene Vinyl Acetate Market, 2016-2026 (USD Million)
        FIG. 5 Global VLEVA Ethylene Vinyl Acetate  Market, 2016-2026 (Kilo Tons)
        FIG. 6 Global LEVA Ethylene Vinyl Acetate Market, 2016-2026 (USD Million)
        FIG. 7 Global LEVA Ethylene Vinyl Acetate  Market, 2016-2026 (Kilo Tons)
        FIG. 8 Global MEVA Ethylene Vinyl Acetate Market, 2016-2026 (USD Million)
        FIG. 9 Global MEVA Ethylene Vinyl Acetate  Market, 2016-2026 (Kilo Tons)
        FIG. 10 Global HEVA Ethylene Vinyl Acetate Market, 2016-2026 (USD Million)
        FIG. 11 Global HEVA Ethylene Vinyl Acetate  Market, 2016-2026 (Kilo Tons)
        FIG. 12 Global Ethylene Vinyl Acetate Market Share, by Application, 2018 & 2025 (USD Million)
        FIG. 13 Global Ethylene Vinyl Acetate Market share, by Application, 2018 & 2025 (Kilo Tons)
        FIG. 14 Global Film Ethylene Vinyl Acetate Market, 2016-2026 (USD Million)
        FIG. 15 Global Film Ethylene Vinyl Acetate  Market, 2016-2026 (Kilo Tons)
        FIG. 16 Global Foam Ethylene Vinyl Acetate Market, 2016-2026 (USD Million)
        FIG. 17 Global Foam Ethylene Vinyl Acetate  Market, 2016-2026 (Kilo Tons)
        FIG. 18 Global Adhesives Ethylene Vinyl Acetate Market, 2016-2026 (USD Million)
        FIG. 19 Global Adhesives Ethylene Vinyl Acetate  Market, 2016-2026 (Kilo Tons)
        FIG. 20 Global Others Ethylene Vinyl Acetate Market, 2016-2026 (USD Million)
        FIG. 21 Global Others Ethylene Vinyl Acetate  Market, 2016-2026 (Kilo Tons)
        FIG. 22 Global Ethylene Vinyl Acetate Market Share, by End Use, 2018 & 2025 (USD Million)
        FIG. 23 Global Ethylene Vinyl Acetate Market share, by End Use, 2018 & 2025 (Kilo Tons)
        FIG. 24 Global Packaging Ethylene Vinyl Acetate Market, 2016-2026 (USD Million)
        FIG. 25 Global Packaging Ethylene Vinyl Acetate  Market, 2016-2026 (Kilo Tons)
        FIG. 26 Global  Solar Ethylene Vinyl Acetate Market, 2016-2026 (USD Million)
        FIG. 27 Global  Solar Ethylene Vinyl Acetate  Market, 2016-2026 (Kilo Tons)
        FIG. 28 Global Agriculture Ethylene Vinyl Acetate Market, 2016-2026 (USD Million)
        FIG. 29 Global Agriculture Ethylene Vinyl Acetate  Market, 2016-2026 (Kilo Tons)
        FIG. 30 Global  Wire & cable Ethylene Vinyl Acetate Market, 2016-2026 (USD Million)
        FIG. 31 Global  Wire & cable Ethylene Vinyl Acetate  Market, 2016-2026 (Kilo Tons)
        FIG. 32 Global Automotive Ethylene Vinyl Acetate Market, 2016-2026 (USD Million)
        FIG. 33 Global Automotive Ethylene Vinyl Acetate  Market, 2016-2026 (Kilo Tons)
        FIG. 34 Global Footwear Ethylene Vinyl Acetate Market, 2016-2026 (USD Million)
        FIG. 35 Global Footwear Ethylene Vinyl Acetate  Market, 2016-2026 (Kilo Tons)
        FIG. 36 Global Others Ethylene Vinyl Acetate Market, 2016-2026 (USD Million)
        FIG. 37 Global Others Ethylene Vinyl Acetate  Market, 2016-2026 (Kilo Tons)
        FIG. 38 Global Ethylene Vinyl Acetate Market Share, by Region, 2018 & 2025
        FIG. 39 Global Ethylene Vinyl Acetate Market Share, by Region, 2018 & 2025
        FIG. 40 North America Ethylene Vinyl Acetate Market, 2016-2026
        FIG. 41 North America Ethylene Vinyl Acetate  Market, 2016-2026 (Kilo Tons)
        FIG. 42 U.S. Ethylene Vinyl Acetate Market, 2016-2026
        FIG. 43 U.S. Ethylene Vinyl Acetate  Market, 2016-2026 (Kilo Tons)
        FIG. 44 Canada Ethylene Vinyl Acetate Market, 2016-2026
        FIG. 45 Canada Ethylene Vinyl Acetate  Market, 2016-2026 (Kilo Tons)
        FIG. 46 Europe Ethylene Vinyl Acetate Market, 2016-2026
        FIG. 47 Europe Ethylene Vinyl Acetate  Market, 2016-2026 (Kilo Tons)
        FIG. 48 Germany Ethylene Vinyl Acetate Market, 2016-2026
        FIG. 49 Germany Ethylene Vinyl Acetate  Market, 2016-2026 (Kilo Tons)
        FIG. 50 France Ethylene Vinyl Acetate Market, 2016-2026
        FIG. 51 France Ethylene Vinyl Acetate  Market, 2016-2026 (Kilo Tons)
        FIG. 52 U.K. Ethylene Vinyl Acetate Market, 2016-2026
        FIG. 53 U.K. Ethylene Vinyl Acetate  Market, 2016-2026 (Kilo Tons)
        FIG. 54 Italy Ethylene Vinyl Acetate Market, 2016-2026
        FIG. 55 Italy Ethylene Vinyl Acetate  Market, 2016-2026 (Kilo Tons)
        FIG. 56 Spain Ethylene Vinyl Acetate Market, 2016-2026
        FIG. 57 Spain Ethylene Vinyl Acetate  Market, 2016-2026 (Kilo Tons)
        FIG. 58 Rest of Europe Ethylene Vinyl Acetate Market, 2016-2026
        FIG. 59 Rest of Europe Ethylene Vinyl Acetate  Market, 2016-2026 (Kilo Tons)
        FIG. 60 Asia Pacific Ethylene Vinyl Acetate Market, 2016-2026
        FIG. 61 Asia Pacific Ethylene Vinyl Acetate  Market, 2016-2026 (Kilo Tons)
        FIG. 62 China Ethylene Vinyl Acetate Market, 2016-2026
        FIG. 63 China Ethylene Vinyl Acetate  Market, 2016-2026 (Kilo Tons)
        FIG. 64 Japan Ethylene Vinyl Acetate Market, 2016-2026
        FIG. 65 Japan Ethylene Vinyl Acetate  Market, 2016-2026 (Kilo Tons)
        FIG. 66 India Ethylene Vinyl Acetate Market, 2016-2026
        FIG. 67 India Ethylene Vinyl Acetate  Market, 2016-2026 (Kilo Tons)
        FIG. 68 South  Korea Ethylene Vinyl Acetate Market, 2016-2026
        FIG. 69 South  Korea Ethylene Vinyl Acetate  Market, 2016-2026 (Kilo Tons)
        FIG. 70 South-East Asia Ethylene Vinyl Acetate Market, 2016-2026
        FIG. 71 South-East Asia Ethylene Vinyl Acetate  Market, 2016-2026 (Kilo Tons)
        FIG. 72 Rest of Asia Pacific Ethylene Vinyl Acetate Market, 2016-2026
        FIG. 73 Rest of Asia Pacific Ethylene Vinyl Acetate  Market, 2016-2026 (Kilo Tons)
        FIG. 74 Latin America Ethylene Vinyl Acetate Market, 2016-2026
        FIG. 75 Latin America Ethylene Vinyl Acetate  Market, 2016-2026 (Kilo Tons)
        FIG. 76 Brazil Ethylene Vinyl Acetate Market, 2016-2026
        FIG. 77 Brazil Ethylene Vinyl Acetate  Market, 2016-2026 (Kilo Tons)
        FIG. 78 Mexico Ethylene Vinyl Acetate Market, 2016-2026
        FIG. 79 Mexico Ethylene Vinyl Acetate  Market, 2016-2026 (Kilo Tons)
        FIG. 80 Rest of Latin America Ethylene Vinyl Acetate Market, 2016-2026
        FIG. 81 Rest of Latin America Ethylene Vinyl Acetate  Market, 2016-2026 (Kilo Tons)
        FIG. 82 The Middle-East and Africa Ethylene Vinyl Acetate Market, 2016-2026
        FIG. 83 The Middle-East and Africa Ethylene Vinyl Acetate  Market, 2016-2026 (Kilo Tons)
        FIG. 84 GCC Countries Ethylene Vinyl Acetate Market, 2016-2026
        FIG. 85 GCC Countries Ethylene Vinyl Acetate  Market, 2016-2026 (Kilo Tons)
        FIG. 86 South Africa Ethylene Vinyl Acetate Market, 2016-2026
        FIG. 87 South Africa Ethylene Vinyl Acetate  Market, 2016-2026 (Kilo Tons)
        FIG. 88 Rest of Middle-East Africa Ethylene Vinyl Acetate Market, 2016-2026
        FIG. 89 Rest of Middle-East Africa Ethylene Vinyl Acetate  Market, 2016-2026 (Kilo Tons)
        FIG. 90 Global Ethylene Vinyl Acetate production and revenue, 2015-2025 (USD Million) (Kilo Tons)
        FIG. 91 North America Ethylene Vinyl Acetate production and revenue, 2015-2025 (USD Million) (Kilo Tons)
        FIG. 92 Europe Ethylene Vinyl Acetate production and revenue, 2015-2025 (USD Million) (Kilo Tons)
        FIG. 93 Asia Pacific Ethylene Vinyl Acetate production and revenue, 2015-2025 (USD Million) (Kilo Tons)
        FIG. 94 Latin America Ethylene Vinyl Acetate production and revenue, 2015-2025 (USD Million) (Kilo Tons)
        FIG. 95 Middle East and Africa Ethylene Vinyl Acetate production and revenue, 2015-2025 (USD Million) (Kilo Tons)
        FIG. 96 Competitor Market Share – Revenue
        FIG. 97 Competitor Market Share – Volume
        FIG. 98 E. I. du Pont de Nemours and Company Revenue and Growth Rate
        FIG. 99 E. I. du Pont de Nemours and Company Market Share
        FIG. 100 Versalis S.p.A. Revenue and Growth Rate
        FIG. 101 Versalis S.p.A. Market Share
        FIG. 102 Hanwha Chemical Revenue and Growth Rate
        FIG. 103 Hanwha Chemical Market Share
        FIG. 104 Lotte Chemical Corporation Revenue and Growth Rate
        FIG. 105 Lotte Chemical Corporation Market Share
        FIG. 106 USI Corporation Revenue and Growth Rate
        FIG. 107 USI Corporation Market Share
        FIG. 108 ExxonMobil Corporation Revenue and Growth Rate
        FIG. 109 ExxonMobil Corporation Market Share
        FIG. 110 Celansese Corporation Revenue and Growth Rate
        FIG. 111 Celansese Corporation Market Share
        FIG. 112 Arkema S.A. Revenue and Growth Rate
        FIG. 113 Arkema S.A. Market Share
        FIG. 114 LyondellBasell Industries NV Revenue and Growth Rate
        FIG. 115 LyondellBasell Industries NV Market Share
        FIG. 116 Formosa Plastics Corporation Revenue and Growth Rate
        FIG. 117 Formosa Plastics Corporation Market Share
        FIG. 118 Market Dynamics
        FIG. 119 Global Ethylene Vinyl Acetate – Value Chain Analysis
        FIG. 120 Key Mandates and Regulations
        FIG. 121 Technology Roadmap and Timeline
        FIG. 122 Market Attractiveness Analysis – By  Type
        FIG. 123 Market Attractiveness Analysis – By Application
        FIG. 124 Market Attractiveness Analysis – By End Use
        FIG. 125 Market Attractiveness Analysis – By Region
        FIG. 126 Manufacturing Cost Structure of Ethylene Vinyl Acetate
        FIG. 127 Ethylene Vinyl Acetate Industrial Chain Analysis
        FIG. 128 Market Channel
        FIG. 129 Marketing Channel Development Trend
        FIG. 130 Growth in World Gross Product, 2008-2018

        List of Tables

        TABLE 1 Global Ethylene Vinyl Acetate market, 2018 & 2025 (USD Million)
        TABLE 2 Global Ethylene Vinyl Acetate market, by  Type, 2016-2026 (USD Million)
        TABLE 3 Global Ethylene Vinyl Acetate market, by  Type, 2016-2026 (Kilo Tons)
        TABLE 4 Global Ethylene Vinyl Acetate market, by Application, 2016-2026 (USD Million)
        TABLE 5 Global Ethylene Vinyl Acetate market, by Application, 2016-2026 (Kilo Tons)
        TABLE 6 Global Ethylene Vinyl Acetate market, by End Use, 2016-2026 (USD Million)
        TABLE 7 Global Ethylene Vinyl Acetate market, by End Use, 2016-2026 (Kilo Tons)
        TABLE 8 Global Ethylene Vinyl Acetate market, by region, 2016-2026 (USD Million)
        TABLE 9 Global Ethylene Vinyl Acetate market, by region, 2016-2026 (Kilo Tons)
        TABLE 10 North America Ethylene Vinyl Acetate Market, by  Type, 2016-2026 (USD Million)
        TABLE 11 North America Ethylene Vinyl Acetate Market, by  Type, 2016-2026 (Kilo Tons)
        TABLE 12 North America Ethylene Vinyl Acetate Market, by Application, 2016-2026 (USD Million)
        TABLE 13 North America Ethylene Vinyl Acetate Market, by Application, 2016-2026 (Kilo Tons)
        TABLE 14 North America Ethylene Vinyl Acetate Market, by End Use, 2016-2026 (USD Million)
        TABLE 15 North America Ethylene Vinyl Acetate Market, by End Use, 2016-2026 (Kilo Tons)
        TABLE 16 Europe Ethylene Vinyl Acetate Market, by  Type, 2016-2026 (USD Million)
        TABLE 17 Europe Ethylene Vinyl Acetate Market, by  Type, 2016-2026 (Kilo Tons)
        TABLE 18 Europe Ethylene Vinyl Acetate Market, by Application, 2016-2026 (USD Million)
        TABLE 19 Europe Ethylene Vinyl Acetate Market, by Application, 2016-2026 (Kilo Tons)
        TABLE 20 Europe Ethylene Vinyl Acetate Market, by End Use, 2016-2026 (USD Million)
        TABLE 21 Europe Ethylene Vinyl Acetate Market, by End Use, 2016-2026 (Kilo Tons)
        TABLE 22 Asia Pacific Ethylene Vinyl Acetate Market, by  Type, 2016-2026 (USD Million)
        TABLE 23 Asia Pacific Ethylene Vinyl Acetate Market, by  Type, 2016-2026 (Kilo Tons)
        TABLE 24 Asia Pacific Ethylene Vinyl Acetate Market, by Application, 2016-2026 (USD Million)
        TABLE 25 Asia Pacific Ethylene Vinyl Acetate Market, by Application, 2016-2026 (Kilo Tons)
        TABLE 26 Asia Pacific Ethylene Vinyl Acetate Market, by End Use, 2016-2026 (USD Million)
        TABLE 27 Asia Pacific Ethylene Vinyl Acetate Market, by End Use, 2016-2026 (Kilo Tons)
        TABLE 28 Latin America Ethylene Vinyl Acetate Market, by  Type, 2016-2026 (USD Million)
        TABLE 29 Latin America Ethylene Vinyl Acetate Market, by  Type, 2016-2026 (Kilo Tons)
        TABLE 30 Latin America Ethylene Vinyl Acetate Market, by Application, 2016-2026 (USD Million)
        TABLE 31 Latin America Ethylene Vinyl Acetate Market, by Application, 2016-2026 (Kilo Tons)
        TABLE 32 Latin America Ethylene Vinyl Acetate Market, by End Use, 2016-2026 (USD Million)
        TABLE 33 Latin America Ethylene Vinyl Acetate Market, by End Use, 2016-2026 (Kilo Tons)
        TABLE 34 The Middle-East and Africa Ethylene Vinyl Acetate Market, by  Type, 2016-2026 (USD Million)
        TABLE 35 The Middle-East and Africa Ethylene Vinyl Acetate Market, by  Type, 2016-2026 (Kilo Tons)
        TABLE 36 The Middle-East and Africa Ethylene Vinyl Acetate Market, by Application, 2016-2026 (USD Million)
        TABLE 37 The Middle-East and Africa Ethylene Vinyl Acetate Market, by Application, 2016-2026 (Kilo Tons)
        TABLE 38 The Middle-East and Africa Ethylene Vinyl Acetate Market, by End Use, 2016-2026 (USD Million)
        TABLE 39 The Middle-East and Africa Ethylene Vinyl Acetate Market, by End Use, 2016-2026 (Kilo Tons)
        TABLE 40 North America Ethylene Vinyl Acetate Production, Consumption, Export, Import, 2016-2019
        TABLE 41 Europe Ethylene Vinyl Acetate Production, Consumption, Export, Import, 2016-2019
        TABLE 42 Asia Pacific Ethylene Vinyl Acetate Production, Consumption, Export, Import, 2016-2019
        TABLE 43 Latin America Ethylene Vinyl Acetate Production, Consumption, Export, Import, 2016-2019
        TABLE 44 Middle East & Africa Ethylene Vinyl Acetate Production, Consumption, Export, Import, 2016-2019
        TABLE 45 Global Ethylene Vinyl Acetate Market - Company Revenue Analysis 2016-2019 (USD Million)
        TABLE 46 Global Ethylene Vinyl Acetate Market - Company Revenue Share Analysis 2016-2019(%)
        TABLE 47 Global Ethylene Vinyl Acetate Market - Company Volume Analysis 2016-2019 (Kilo Tons)
        TABLE 48 Global Ethylene Vinyl Acetate Market - Company Volume Share Analysis 2016-2019(%)
        TABLE 49 Acquisitions and Mergers
        TABLE 50 New Product/Service Launch
        TABLE 51 Research & Development Activities
        TABLE 52 Market Drivers
        TABLE 53 Market Restraints
        TABLE 54 Market Opportunities
        TABLE 55 Production Base and Market Concentration Rate of Raw Material
        TABLE 56 Key Suppliers of Raw Materials
        TABLE 57 Raw Materials Sources of Ethylene Vinyl Acetate Major Manufacturers in 2016
        TABLE 58 Major Buyers of Ethylene Vinyl Acetate
        TABLE 59 Distributors/Traders of Ethylene Vinyl Acetate by Region

Industry Major Market Players

  •  E. I. du Pont de Nemours and Company
  •  Versalis S.p.A.
  •  Hanwha Chemical
  •  Lotte Chemical Corporation
  •  USI Corporation
  •  ExxonMobil Corporation
  •  Celansese Corporation
  •  Arkema S.A.
  •  LyondellBasell Industries NV
  •  Formosa Plastics Corporation.