Search Market Research Report

Discover Our Latest Reports
Discover Our Featured Reports
Discover Top Selling Reports

Ethylene Oxide Market Size, Share Global Analysis Report, 2020–2026

report img

Ethylene Oxide Market By Type (SD-Oxidation, Shell-Oxidation, Dow-Oxidation, and Others) and By Application (Ethylene Glycols, Polyethylene Glycols, Ethylene Glycol Ethers, Ethanol Amines): Global Industry Outlook, Market Size, Business Intelligence, Consumer Preferences, Statistical Surveys, Comprehensive Analysis, Historical Developments, Current Trends, and Forecast 2020–2026

Industry Insights

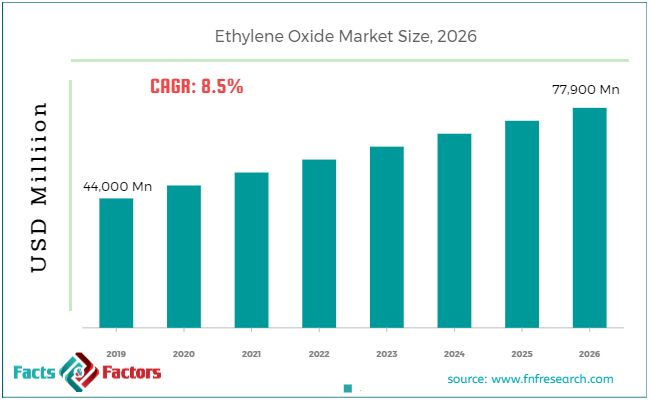
According to the report published by Facts & Factors, the global Ethylene Oxide market size was worth around USD 44,000 million in 2019 and is predicted to grow around USD 77,900 million by 2026 with a compound annual growth rate (CAGR) of roughly 8.5% between 2020 and 2026.

The Ethylene Oxide market report analyzes and notifies the industry statistics at the global as well as regional and country levels in order to acquire a thorough perspective of the entire ethylene Oxide market. The historical and past insights are provided for FY 2016 to FY 2019 whereas projected trends are delivered for FY 2020 to FY 2026. The quantitative and numerical data is represented in terms of both volume (Units) and value (USD Million) from FY 2016 – 2026.

This specialized and expertise-oriented industry research report scrutinizes the technical and commercial business outlook of the Ethylene Oxide industry. The report analyzes and declares the historical and current trends analysis of the Ethylene Oxide industry and subsequently recommends the projected trends anticipated to be observed in the XYZ market during the upcoming years.

Ethylene Oxide Market Size

To know more about this report | Request Free Sample Copy

logoKey Insights from Primary Research

  • As per our primary respondents, the Ethylene Oxide market is set to grow annually at a rate of around 8.5%.
  • It was established through primary research that the Ethylene Oxide market was valued at around USD 44,000 million in 2019.
  • After secondary research, we performed face to face interviews to validate our data. The insights interviewee’s declared that Dow-Oxidation is the most used type for the global Ethylene Oxide market.
  • On the basis of the type, Ethylene Glycolsdominated the global Ethylene Oxide market in 2019. It accounted for around 63% share of the total market in 2019.
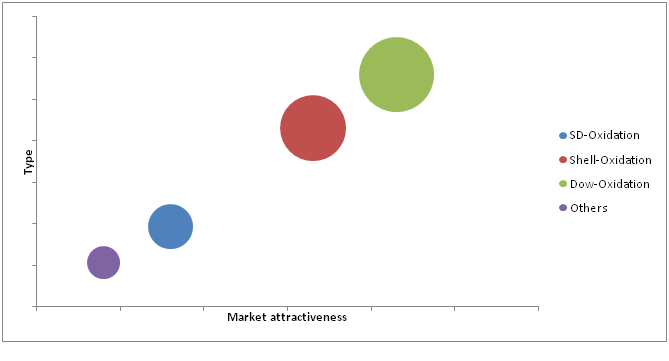
  • The Dow-Oxidation segment, on the basis of Type segmentation, was the leading revenue-generating category accounting for around 63% share, in 2019.

logoKey Recommendations from Analysts

  • Based on the exhaustive secondary research done by our team, the Dow-Oxidation type is anticipated to become the most demanding type in the upcoming years, owing to the growing demand for Ethylene Oxide from the healthcare industry for various end-use applications.
  • As per our analysts, Asia Pacific recorded the highest market share of more than 39% by 2026, and the market is expected to bolster in this region, resulting in creating lucrative opportunities for new players.
  • Growing at a CAGR around 8.5%, the Ethylene Oxide market provides numerous opportunities for all of the involved stakeholders across the entire value chain.
  • Our analysts have identified Dow-Oxidation and Ethylene Glycolscategories as the leading investment pockets for the Ethylene Oxide market in terms of type and application segmentation respectively.
  • Our analysts recommend the emerging players to focus on Ethylene Glycolsowing to the substantial growth of the healthcare industry, especially in APAC and Middle-eastern regions.

logoMarket Attractiveness – By Type

Ethylene Oxide Market

To know more about this report | Request Free Sample Copy

The quantitative data is further underlined and reinforced by comprehensive qualitative data which comprises various across-the-board market dynamics. The rationales which directly or indirectly impact the Ethylene Oxide industry are exemplified through parameters such as growth drivers, restraints, challenges, and opportunities among other impacting factors.

Throughout our research report, we have encompassed all the proven models and tools of industry analysis and extensively illustrated all the key business strategies and business models adopted in the Ethylene Oxide industry. The report provides an all-inclusive and detailed competitive landscape prevalent in the Ethylene Oxide market.

The report utilizes established industry analysis tools and models such as Porter’s Five Forces framework to analyze and recognize critical business strategies adopted by various stakeholders involved in the entire value chain of the Ethylene Oxide industry. The Ethylene Oxide market report additionally employs SWOT analysis and PESTLE analysis models for further in-depth analysis.

The report study further includes an in-depth analysis of industry players' market shares and provides an overview of leading players' market position in the Ethylene Oxide sector. Key strategic developments in the Ethylene Oxide market competitive landscape such as acquisitions & mergers, inaugurations of different products and services, partnerships & joint ventures, MoU agreements, VC & funding activities, R&D activities, and geographic expansion among other noteworthy activities by key players of the Ethylene Oxide market are appropriately highlighted in the report.

Ethylene glycols, polyethylene glycols, ethylene glycol ethers, ethanol amines, and others are the major downstream segment of ethylene oxide market. Among this ethylene glycol is the most attractive downstream segment. Moreover, it is estimated to practice lucrative growth of the market over the forthcoming years owing to the growing demand for ethylene oxide across the globe. Rapidly growing automotive and industrial markets will emphasize the expansion of ethylene oxide production capacity. Since ethylene glycol is essential in the manufacture of polyester fibers, this market is envisaged to have a positive outlook until the end of 2026.

The Ethylene Oxide market research report delivers an acute valuation and taxonomy of the Ethylene Oxide industry by practically splitting the market on the basis of different types, applications, and regions. Through the analysis of the historical and projected trends, all the segments and sub-segments were evaluated through the bottom-up approach, and different market sizes have been projected for FY 2020 to FY 2026. The regional segmentation of the Ethylene Oxide industry includes the complete classification of all the major continents including North America, Latin America, Europe, Asia Pacific, and Middle East & Africa. Further, country-wise data for the Ethylene Oxide industry is provided for the leading economies of the world.

The Ethylene Oxide market is segmented based on Type and Application.  On the basis of type segmentation, the market is classified into SD-Oxidation, Shell-Oxidation, Dow-Oxidation, and Others. In terms of Application segmentation, the market is bifurcated into Ethylene Glycols, Polyethylene Glycols, Ethylene Glycol Ethers, and Ethanol Amines.

logoReport Scope

Report Attribute

Details

Market Size in 2019

USD 44,000 Million

Projected Market Size in 2026

USD 77,900 Million

CAGR Growth Rate

8.5% CAGR

Base Year

2019

Forecast Years

2020-2026

Key Market Players

Shell Formosa, Kazanorgsintez, Indorama Ventures, Ineos, Nippon Shokubai, Reliance, Yansab, Basf, Dow Chemical, LyondellBasell, Indian Oil, PTT Global Chemical, CNPC, Al-Jubail Petrochemical Company, Sharq, India Glycol Limited, Sinopec, Sibur, Oriental Union Chemical, Eastman, Sasol, Huntsman, and others.

Key Segment

By Type, Application, and Region

Major Regions Covered

North America, Europe, Asia Pacific, Latin America, and the Middle East &, Africa

Purchase Options

Request customized purchase options to meet your research needs. Explore purchase options

logoSome of the essential players operating in the Ethylene Oxide market, but not restricted to include:

  •  Shell Formosa
  •  Kazanorgsintez
  •  Indorama Ventures
  •  Ineos
  •  Nippon Shokubai
  •  Reliance
  •  Yansab
  •  Basf
  •  Dow Chemical
  •  LyondellBasell
  •  Indian Oil
  •  PTT Global Chemical
  •  CNPC
  •  Al-Jubail Petrochemical Company
  •  Sharq
  •  India Glycol Limited
  •  Sinopec
  •  Sibur
  •  Oriental Union Chemical
  •  Eastman
  •  Sasol
  •  Huntsman

The taxonomy of the Ethylene Oxide Market by its scope and segmentation is as follows:

logo By Type Segmentation Analysis(Customizable)

  • SD-Oxidation
  • Shell-Oxidation
  • Dow-Oxidation
  • Others

logo By Application Segmentation Analysis(Customizable)

  • Ethylene Glycols
  • Polyethylene Glycols
  • Ethylene Glycol Ethers
  • Ethanol Amines

logo Regional Segmentation Analysis(Customizable)

  • North America
    • The U.S.
    • Canada
  • Europe
    • Germany
    • The UK
    • France
    • Spain
    • Italy
    • Rest of Europe
  • Asia Pacific
    • China
    • Japan
    • India
    • South Korea
    • Southeast Asia
    • Rest of Asia Pacific
  • Latin America
    • Brazil
    • Mexico
    • Rest of Latin America
  • Middle East & Africa
    • GCC
    • South Africa
    • Rest of Middle East & Africa

Table of Content

  1. CHAPTER 1. Executive Summary
  2. CHAPTER 2. Ethylene Oxide (EO) market – Types Analysis
    1. 2.1. Global Ethylene Oxide (EO) Market – Types Overview
    2. 2.2. Global Ethylene Oxide (EO) Market Share, by Types, 2019 & 2026 (USD Million)
    3. 2.3. SD-Oxidation
      1. 2.3.1. Global SD-Oxidation Ethylene Oxide (EO) Market, 2016-2026 (USD Million)
    4. 2.4. Shell-Oxidation
      1. 2.4.1. Global Shell-Oxidation Ethylene Oxide (EO) Market, 2016-2026 (USD Million)
    5. 2.5. Dow-Oxidation
      1. 2.5.1. Global Dow-Oxidation Ethylene Oxide (EO) Market, 2016-2026 (USD Million)
    6. 2.6. Others
      1. 2.6.1. Global Others Ethylene Oxide (EO) Market, 2016-2026 (USD Million)
  3. CHAPTER 3. Ethylene Oxide (EO) market – Application Analysis
    1. 3.1. Global Ethylene Oxide (EO) Market – Application Overview
    2. 3.2. Global Ethylene Oxide (EO) Market Share, by Application, 2019 & 2026 (USD Million)
    3. 3.3. Ethylene Glycols
      1. 3.3.1. Global Ethylene Glycols Ethylene Oxide (EO) Market, 2016-2026 (USD Million)
    4. 3.4. Polyethylene Glycols
      1. 3.4.1. Global Polyethylene Glycols Ethylene Oxide (EO) Market, 2016-2026 (USD Million)
    5. 3.5. Ethylene Glycol Ethers
      1. 3.5.1. Global Ethylene Glycol Ethers Ethylene Oxide (EO) Market, 2016-2026 (USD Million)
    6. 3.6. Ethanol Amines
      1. 3.6.1. Global Ethanol Amines Ethylene Oxide (EO) Market, 2016-2026 (USD Million)
  4. CHAPTER 4. Ethylene Oxide (EO) market – Regional Analysis
    1. 4.1. Global Ethylene Oxide (EO) Market Regional Overview
    2. 4.2. Global Ethylene Oxide (EO) Market Share, by Region, 2019 & 2026 (Value)
    3. 4.3. North America
      1. 4.3.1. North America Ethylene Oxide (EO) Market size and forecast, 2016-2026
      2. 4.3.2. North America Ethylene Oxide (EO) Market, by Country, 2019 & 2026 (USD Million)
      3. 4.3.3. North America Ethylene Oxide (EO) Market, by Types, 2016-2026
        1. 4.3.3.1. North America Ethylene Oxide (EO) Market, by Types, 2016-2026 (USD Million)
      4. 4.3.4. North America Ethylene Oxide (EO) Market, by Application, 2016-2026
        1. 4.3.4.1. North America Ethylene Oxide (EO) Market, by Application, 2016-2026 (USD Million)
      5. 4.3.5. U.S.
        1. 4.3.5.1. U.S. Market size and forecast, 2016-2026 (USD Million)
      6. 4.3.6. Canada
        1. 4.3.6.1. Canada Market size and forecast, 2016-2026 (USD Million)
    4. 4.4. Europe
      1. 4.4.1. Europe Ethylene Oxide (EO) Market size and forecast, 2016-2026
      2. 4.4.2. Europe Ethylene Oxide (EO) Market, by Country, 2019 & 2026 (USD Million)
      3. 4.4.3. Europe Ethylene Oxide (EO) Market, by Types, 2016-2026
        1. 4.4.3.1. Europe Ethylene Oxide (EO) Market, by Types, 2016-2026 (USD Million)
      4. 4.4.4. Europe Ethylene Oxide (EO) Market, by Application, 2016-2026
        1. 4.4.4.1. Europe Ethylene Oxide (EO) Market, by Application, 2016-2026 (USD Million)
      5. 4.4.5. Germany
        1. 4.4.5.1. Germany Market size and forecast, 2016-2026 (USD Million)
      6. 4.4.6. France
        1. 4.4.6.1. France Market size and forecast, 2016-2026 (USD Million)
      7. 4.4.7. U.K.
        1. 4.4.7.1. U.K. Market size and forecast, 2016-2026 (USD Million)
      8. 4.4.8. Italy
        1. 4.4.8.1. Italy Market size and forecast, 2016-2026 (USD Million)
      9. 4.4.9. Spain
        1. 4.4.9.1. Spain Market size and forecast, 2016-2026 (USD Million)
      10. 4.4.10. Rest of Europe
        1. 4.4.10.1. Rest of Europe Market size and forecast, 2016-2026 (USD Million)
    5. 4.5. Asia Pacific
      1. 4.5.1. Asia Pacific Ethylene Oxide (EO) Market size and forecast, 2016-2026
      2. 4.5.2. Asia Pacific Ethylene Oxide (EO) Market, by Country, 2019 & 2026 (USD Million)
      3. 4.5.3. Asia Pacific Ethylene Oxide (EO) Market, by Types, 2016-2026
        1. 4.5.3.1. Asia Pacific Ethylene Oxide (EO) Market, by Types, 2016-2026 (USD Million)
      4. 4.5.4. Asia Pacific Ethylene Oxide (EO) Market, by Application, 2016-2026
        1. 4.5.4.1. Asia Pacific Ethylene Oxide (EO) Market, by Application, 2016-2026 (USD Million)
      5. 4.5.5. China
        1. 4.5.5.1. China Market size and forecast, 2016-2026 (USD Million)
      6. 4.5.6. Japan
        1. 4.5.6.1. Japan Market size and forecast, 2016-2026 (USD Million)
      7. 4.5.7. India
        1. 4.5.7.1. India Market size and forecast, 2016-2026 (USD Million)
      8. 4.5.8. South Korea
        1. 4.5.8.1. South Korea Market size and forecast, 2016-2026 (USD Million)
      9. 4.5.9. South-East Asia
        1. 4.5.9.1. South-East Asia Market size and forecast, 2016-2026 (USD Million)
      10. 4.5.10. Rest of Asia Pacific
        1. 4.5.10.1. Rest of Asia Pacific Market size and forecast, 2016-2026 (USD Million)
    6. 4.6. Latin America
      1. 4.6.1. Latin America Ethylene Oxide (EO) Market size and forecast, 2016-2026
      2. 4.6.2. Latin America Ethylene Oxide (EO) Market, by Country, 2019 & 2026 (USD Million)
      3. 4.6.3. Latin America Ethylene Oxide (EO) Market, by Types, 2016-2026
        1. 4.6.3.1. Latin America Ethylene Oxide (EO) Market, by Types, 2016-2026 (USD Million)
      4. 4.6.4. Latin America Ethylene Oxide (EO) Market, by Application, 2016-2026
        1. 4.6.4.1. Latin America Ethylene Oxide (EO) Market, by Application, 2016-2026 (USD Million)
      5. 4.6.5. Brazil
        1. 4.6.5.1. Brazil Market size and forecast, 2016-2026 (USD Million)
      6. 4.6.6. Mexico
        1. 4.6.6.1. Mexico Market size and forecast, 2016-2026 (USD Million)
      7. 4.6.7. Rest of Latin America
        1. 4.6.7.1. Rest of Latin America Market size and forecast, 2016-2026 (USD Million)
    7. 4.7. The Middle-East and Africa
      1. 4.7.1. The Middle-East and Africa Ethylene Oxide (EO) Market size and forecast, 2016-2026
      2. 4.7.2. The Middle-East and Africa Ethylene Oxide (EO) Market, by Country, 2019 & 2026 (USD Million)
      3. 4.7.3. The Middle-East and Africa Ethylene Oxide (EO) Market, by Types, 2016-2026
        1. 4.7.3.1. The Middle-East and Africa Ethylene Oxide (EO) Market, by Types, 2016-2026 (USD Million)
      4. 4.7.4. The Middle-East and Africa Ethylene Oxide (EO) Market, by Application, 2016-2026
        1. 4.7.4.1. The Middle-East and Africa Ethylene Oxide (EO) Market, by Application, 2016-2026 (USD Million)
      5. 4.7.5. GCC Countries
        1. 4.7.5.1. GCC Countries Market size and forecast, 2016-2026 (USD Million)
      6. 4.7.6. South Africa
        1. 4.7.6.1. South Africa Market size and forecast, 2016-2026 (USD Million)
      7. 4.7.7. Rest of Middle-East Africa
        1. 4.7.7.1. Rest of Middle-East Africa Market size and forecast, 2016-2026 (USD Million)
  5. CHAPTER 5. Ethylene Oxide (EO) market – Competitive Landscape
    1. 5.1. Competitor Market Share – Revenue
    2. 5.2. Market Concentration Rate Analysis, Top 3 and Top 5 Players
    3. 5.3. Strategic Development
      1. 5.3.1. Acquisitions and Mergers
      2. 5.3.2. New Products
      3. 5.3.3. Research & Development Activities
  6. CHAPTER 6. Company Profiles
    1. 6.1. Shell
      1. 6.1.1. Company Overview
      2. 6.1.2. Shell Revenue and Gross Margin
      3. 6.1.3. Product portfolio
      4. 6.1.4. Recent initiatives
    2. 6.2. Formosa
      1. 6.2.1. Company Overview
      2. 6.2.2. Formosa Revenue and Gross Margin
      3. 6.2.3. Product portfolio
      4. 6.2.4. Recent initiatives
    3. 6.3. Kazanorgsintez
      1. 6.3.1. Company Overview
      2. 6.3.2. Kazanorgsintez Revenue and Gross Margin
      3. 6.3.3. Product portfolio
      4. 6.3.4. Recent initiatives
    4. 6.4. Indorama Ventures
      1. 6.4.1. Company Overview
      2. 6.4.2. Indorama Ventures Revenue and Gross Margin
      3. 6.4.3. Product portfolio
      4. 6.4.4. Recent initiatives
    5. 6.5. Ineos
      1. 6.5.1. Company Overview
      2. 6.5.2. Ineos Revenue and Gross Margin
      3. 6.5.3. Product portfolio
      4. 6.5.4. Recent initiatives
    6. 6.6. Nippon Shokubai
      1. 6.6.1. Company Overview
      2. 6.6.2. Nippon Shokubai Revenue and Gross Margin
      3. 6.6.3. Product portfolio
      4. 6.6.4. Recent initiatives
    7. 6.7. Reliance
      1. 6.7.1. Company Overview
      2. 6.7.2. Reliance Revenue and Gross Margin
      3. 6.7.3. Product portfolio
      4. 6.7.4. Recent initiatives
    8. 6.8. Yansab
      1. 6.8.1. Company Overview
      2. 6.8.2. Yansab Revenue and Gross Margin
      3. 6.8.3. Product portfolio
      4. 6.8.4. Recent initiatives
    9. 6.9. Basf
      1. 6.9.1. Company Overview
      2. 6.9.2. Basf Revenue and Gross Margin
      3. 6.9.3. Product portfolio
      4. 6.9.4. Recent initiatives
    10. 6.10. Dow Chemical
      1. 6.10.1. Company Overview
      2. 6.10.2. Dow Chemical Revenue and Gross Margin
      3. 6.10.3. Product portfolio
      4. 6.10.4. Recent initiatives
    11. 6.11. LyondellBasell
      1. 6.11.1. Company Overview
      2. 6.11.2. LyondellBasell Revenue and Gross Margin
      3. 6.11.3. Product portfolio
      4. 6.11.4. Recent initiatives
    12. 6.12. Indian Oil
      1. 6.12.1. Company Overview
      2. 6.12.2. Indian Oil Revenue and Gross Margin
      3. 6.12.3. Product portfolio
      4. 6.12.4. Recent initiatives
    13. 6.13. PTT Global Chemical
      1. 6.13.1. Company Overview
      2. 6.13.2. PTT Global Chemical Revenue and Gross Margin
      3. 6.13.3. Product portfolio
      4. 6.13.4. Recent initiatives
    14. 6.14. CNPC
      1. 6.14.1. Company Overview
      2. 6.14.2. CNPC Revenue and Gross Margin
      3. 6.14.3. Product portfolio
      4. 6.14.4. Recent initiatives
    15. 6.15. Al-Jubail Petrochemical Company
      1. 6.15.1. Company Overview
      2. 6.15.2. Al-Jubail Petrochemical Company Revenue and Gross Margin
      3. 6.15.3. Product portfolio
      4. 6.15.4. Recent initiatives
    16. 6.16. Sharq
      1. 6.16.1. Company Overview
      2. 6.16.2. Sharq Revenue and Gross Margin
      3. 6.16.3. Product portfolio
      4. 6.16.4. Recent initiatives
    17. 6.17. India Glycol Limited
      1. 6.17.1. Company Overview
      2. 6.17.2. India Glycol Limited Revenue and Gross Margin
      3. 6.17.3. Product portfolio
      4. 6.17.4. Recent initiatives
    18. 6.18. Sinopec
      1. 6.18.1. Company Overview
      2. 6.18.2. Sinopec Revenue and Gross Margin
      3. 6.18.3. Product portfolio
      4. 6.18.4. Recent initiatives
    19. 6.19. Sibur
      1. 6.19.1. Company Overview
      2. 6.19.2. Sibur Revenue and Gross Margin
      3. 6.19.3. Product portfolio
      4. 6.19.4. Recent initiatives
    20. 6.20. Oriental Union Chemical
      1. 6.20.1. Company Overview
      2. 6.20.2. Oriental Union Chemical Revenue and Gross Margin
      3. 6.20.3. Product portfolio
      4. 6.20.4. Recent initiatives
    21. 6.21. Eastman
      1. 6.21.1. Company Overview
      2. 6.21.2. Eastman Revenue and Gross Margin
      3. 6.21.3. Product portfolio
      4. 6.21.4. Recent initiatives
    22. 6.22. Sasol
      1. 6.22.1. Company Overview
      2. 6.22.2. Sasol Revenue and Gross Margin
      3. 6.22.3. Product portfolio
      4. 6.22.4. Recent initiatives
    23. 6.23. Huntsman
      1. 6.23.1. Company Overview
      2. 6.23.2. Huntsman Revenue and Gross Margin
      3. 6.23.3. Product portfolio
      4. 6.23.4. Recent initiatives
  7. CHAPTER 7. Ethylene Oxide (EO) — Industry Analysis
    1. 7.1. Ethylene Oxide (EO) Market – Key Trends
      1. 7.1.1. Market Drivers
      2. 7.1.2. Market Restraints
      3. 7.1.3. Market Opportunities
    2. 7.2. Value Chain Analysis
    3. 7.3. Technology Roadmap and Timeline
    4. 7.4. Ethylene Oxide (EO) Market – Attractiveness Analysis
      1. 7.4.1. By Types
      2. 7.4.2. By Application
      3. 7.4.3. By Region
  8. CHAPTER 8. Marketing Strategy Analysis, Distributors
    1. 8.1. Marketing Channel
    2. 8.2. Direct Marketing
    3. 8.3. Indirect Marketing
    4. 8.4. Marketing Channel Development Trend
    5. 8.5. Economic/Political Environmental Change
  9. CHAPTER 9. Report Conclusion
  10. CHAPTER 10. Research Approach & Methodology
    1. 10.1. Report Description
    2. 10.2. Research Scope
    3. 10.3. Research Methodology
      1. 10.3.1. Secondary Research
      2. 10.3.2. Primary Research
      3. 10.3.3. Models
        1. 10.3.3.1. Company Share Analysis Model
        2. 10.3.3.2. Revenue Based Modeling
        3. 10.3.3.3. Research Limitations

        List of Figures

        FIG. 1 Global Ethylene Oxide (EO) Market, 2016-2026 (USD Million)
        FIG. 2 Global Ethylene Oxide (EO) Market Share, by Types, 2019 & 2026 (USD Million)
        FIG. 3 Global SD-Oxidation Ethylene Oxide (EO) Market, 2016-2026 (USD Million)
        FIG. 4 Global Shell-Oxidation Ethylene Oxide (EO) Market, 2016-2026 (USD Million)
        FIG. 5 Global Dow-Oxidation Ethylene Oxide (EO) Market, 2016-2026 (USD Million)
        FIG. 6 Global Others Ethylene Oxide (EO) Market, 2016-2026 (USD Million)
        FIG. 7 Global Ethylene Oxide (EO) Market Share, by Application, 2019 & 2026 (USD Million)
        FIG. 8 Global Ethylene Glycols Ethylene Oxide (EO) Market, 2016-2026 (USD Million)
        FIG. 9 Global Polyethylene Glycols Ethylene Oxide (EO) Market, 2016-2026 (USD Million)
        FIG. 10 Global Ethylene Glycol Ethers Ethylene Oxide (EO) Market, 2016-2026 (USD Million)
        FIG. 11 Global Ethanol Amines Ethylene Oxide (EO) Market, 2016-2026 (USD Million)
        FIG. 12 Global Ethylene Oxide (EO) Market Share, by Region, 2019 & 2026
        FIG. 13 North America Ethylene Oxide (EO) Market, 2016-2026
        FIG. 14 U.S. Ethylene Oxide (EO) Market, 2016-2026
        FIG. 15 Canada Ethylene Oxide (EO) Market, 2016-2026
        FIG. 16 Europe Ethylene Oxide (EO) Market, 2016-2026
        FIG. 17 Germany Ethylene Oxide (EO) Market, 2016-2026
        FIG. 18 France Ethylene Oxide (EO) Market, 2016-2026
        FIG. 19 U.K. Ethylene Oxide (EO) Market, 2016-2026
        FIG. 20 Italy Ethylene Oxide (EO) Market, 2016-2026
        FIG. 21 Spain Ethylene Oxide (EO) Market, 2016-2026
        FIG. 22 Rest of Europe Ethylene Oxide (EO) Market, 2016-2026
        FIG. 23 Asia Pacific Ethylene Oxide (EO) Market, 2016-2026
        FIG. 24 China Ethylene Oxide (EO) Market, 2016-2026
        FIG. 25 Japan Ethylene Oxide (EO) Market, 2016-2026
        FIG. 26 India Ethylene Oxide (EO) Market, 2016-2026
        FIG. 27 South  Korea Ethylene Oxide (EO) Market, 2016-2026
        FIG. 28 South-East Asia Ethylene Oxide (EO) Market, 2016-2026
        FIG. 29 Rest of Asia Pacific Ethylene Oxide (EO) Market, 2016-2026
        FIG. 30 Latin America Ethylene Oxide (EO) Market, 2016-2026
        FIG. 31 Brazil Ethylene Oxide (EO) Market, 2016-2026
        FIG. 32 Mexico Ethylene Oxide (EO) Market, 2016-2026
        FIG. 33 Rest of Latin America Ethylene Oxide (EO) Market, 2016-2026
        FIG. 34 The Middle-East and Africa Ethylene Oxide (EO) Market, 2016-2026
        FIG. 35 GCC Countries Ethylene Oxide (EO) Market, 2016-2026
        FIG. 36 South Africa Ethylene Oxide (EO) Market, 2016-2026
        FIG. 37 Rest of Middle-East Africa Ethylene Oxide (EO) Market, 2016-2026
        FIG. 38 Competitor Market Share – Revenue
        FIG. 39 Shell Revenue and Growth Rate
        FIG. 40 Shell Market Share
        FIG. 41 Formosa Revenue and Growth Rate
        FIG. 42 Formosa Market Share
        FIG. 43 Kazanorgsintez Revenue and Growth Rate
        FIG. 44 Kazanorgsintez Market Share
        FIG. 45 Indorama Ventures Revenue and Growth Rate
        FIG. 46 Indorama Ventures Market Share
        FIG. 47 Ineos Revenue and Growth Rate
        FIG. 48 Ineos Market Share
        FIG. 49 Nippon Shokubai Revenue and Growth Rate
        FIG. 50 Nippon Shokubai Market Share
        FIG. 51 Reliance Revenue and Growth Rate
        FIG. 52 Reliance Market Share
        FIG. 53 Yansab Revenue and Growth Rate
        FIG. 54 Yansab Market Share
        FIG. 55 Basf Revenue and Growth Rate
        FIG. 56 Basf Market Share
        FIG. 57 Dow Chemical Revenue and Growth Rate
        FIG. 58 Dow Chemical Market Share
        FIG. 59 LyondellBasell Revenue and Growth Rate
        FIG. 60 LyondellBasell Market Share
        FIG. 61 Indian Oil Revenue and Growth Rate
        FIG. 62 Indian Oil Market Share
        FIG. 63 PTT Global Chemical Revenue and Growth Rate
        FIG. 64 PTT Global Chemical Market Share
        FIG. 65 CNPC Revenue and Growth Rate
        FIG. 66 CNPC Market Share
        FIG. 67 Al-Jubail Petrochemical Company Revenue and Growth Rate
        FIG. 68 Al-Jubail Petrochemical Company Market Share
        FIG. 69 Sharq Revenue and Growth Rate
        FIG. 70 Sharq Market Share
        FIG. 71 India Glycol Limited Revenue and Growth Rate
        FIG. 72 India Glycol Limited Market Share
        FIG. 73 Sinopec Revenue and Growth Rate
        FIG. 74 Sinopec Market Share
        FIG. 75 Sibur Revenue and Growth Rate
        FIG. 76 Sibur Market Share
        FIG. 77 Oriental Union Chemical Revenue and Growth Rate
        FIG. 78 Oriental Union Chemical Market Share
        FIG. 79 Eastman Revenue and Growth Rate
        FIG. 80 Eastman Market Share
        FIG. 81 Sasol Revenue and Growth Rate
        FIG. 82 Sasol Market Share
        FIG. 83 Huntsman Revenue and Growth Rate
        FIG. 84 Huntsman Market Share
        FIG. 85 Market Dynamics
        FIG. 86 Global Ethylene Oxide (EO) – Value Chain Analysis
        FIG. 87 Technology Roadmap and Timeline
        FIG. 88 Market Attractiveness Analysis – By Types
        FIG. 89 Market Attractiveness Analysis – By Application
        FIG. 90 Market Attractiveness Analysis – By Region
        FIG. 91 Market Channel
        FIG. 92 Marketing Channel Development Trend
        FIG. 93 Growth in World Gross Product, 2008-2019

        List of Tables

        TABLE 1 Global Ethylene Oxide (EO) Market, 2019 & 2026 (USD Million)
        TABLE 2 Global Ethylene Oxide (EO) market, by Types, 2016-2026 (USD Million)
        TABLE 3 Global Ethylene Oxide (EO) market, by Application, 2016-2026 (USD Million)
        TABLE 4 Global Ethylene Oxide (EO) market, by Region, 2016-2026 (USD Million)
        TABLE 5 North America Ethylene Oxide (EO) Market, by Types, 2016-2026 (USD Million)
        TABLE 6 North America Ethylene Oxide (EO) Market, by Application, 2016-2026 (USD Million)
        TABLE 7 Europe Ethylene Oxide (EO) Market, by Types, 2016-2026 (USD Million)
        TABLE 8 Europe Ethylene Oxide (EO) Market, by Application, 2016-2026 (USD Million)
        TABLE 9 Asia Pacific Ethylene Oxide (EO) Market, by Types, 2016-2026 (USD Million)
        TABLE 10 Asia Pacific Ethylene Oxide (EO) Market, by Application, 2016-2026 (USD Million)
        TABLE 11 Latin America Ethylene Oxide (EO) Market, by Types, 2016-2026 (USD Million)
        TABLE 12 Latin America Ethylene Oxide (EO) Market, by Application, 2016-2026 (USD Million)
        TABLE 13 The Middle-East and Africa Ethylene Oxide (EO) Market, by Types, 2016-2026 (USD Million)
        TABLE 14 The Middle-East and Africa Ethylene Oxide (EO) Market, by Application, 2016-2026 (USD Million)
        TABLE 15 Global Ethylene Oxide (EO) Market - Company Revenue Analysis 2016-2019 (USD Million)
        TABLE 16 Global Ethylene Oxide (EO) Market - Company Revenue Share Analysis 2016-2019(%)
        TABLE 17 Acquisitions and Mergers
        TABLE 18 New Product/Service Launch
        TABLE 19 Research & Development Activities
        TABLE 20 Market Drivers
        TABLE 21 Market Restraints
        TABLE 22 Market Opportunities

Industry Major Market Players

  •  Shell Formosa
  •  Kazanorgsintez
  •  Indorama Ventures
  •  Ineos
  •  Nippon Shokubai
  •  Reliance
  •  Yansab
  •  Basf
  •  Dow Chemical
  •  LyondellBasell
  •  Indian Oil
  •  PTT Global Chemical
  •  CNPC
  •  Al-Jubail Petrochemical Company
  •  Sharq
  •  India Glycol Limited
  •  Sinopec
  •  Sibur
  •  Oriental Union Chemical
  •  Eastman
  •  Sasol
  •  Huntsman