Search Market Research Report

Discover Our Latest Reports
Discover Our Featured Reports
Discover Top Selling Reports

Ethanolamines Market Size, Share Global Analysis Report, 2020–2026

report img

Ethanolamines Market By Application (Gas Treatment, Surfactant, Cement, Herbicides, and Others) and By Compound (MEA, TEA, and DEA): Global Industry Outlook, Market Size, Business Intelligence, Consumer Preferences, Statistical Surveys, Comprehensive Analysis, Historical Developments, Current Trends, and Forecast 2020–2026

Industry Insights

The ethanolamines market report analyzes and notifies the industry statistics at the global as well as regional and country levels in order to acquire a thorough perspective of the entire ethanolamines market. The historical and past insights are provided for FY 2016 to FY 2019 whereas projected trends are delivered for FY 2020 to FY 2026. The quantitative and numerical data is represented in terms of both volume (Units) and value (USD Million) from FY 2016 – 2026.

This specialized and expertise-oriented industry research report scrutinizes the technical and commercial business outlook of the ethanolamines industry. The report analyzes and declares the historical and current trends analysis of the ethanolamines industry and subsequently recommends the projected trends anticipated to be observed in the ethanolamines market during the upcoming years.

Ethanolamines Market Size,

To know more about this report | Request Free Sample Copy

logoKey Insights from Primary Research

  • As per our primary respondents, the ethanolamines market is set to grow at a rate of around 5%.
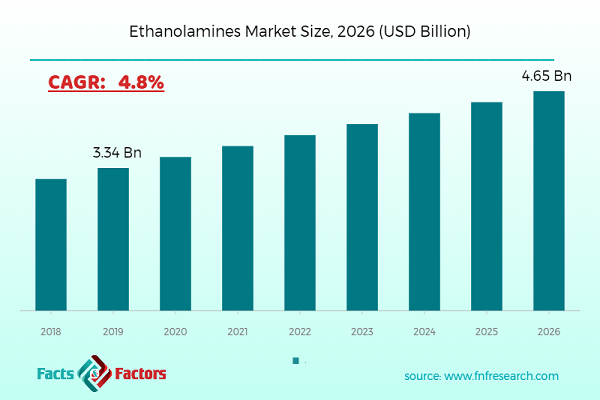
  • It was established through the primary interview that the ethanolamines market was valued at around USD 3.34 Billion in 2019.
  • APAC will grow the global ethanolamines market over the forecast period as countries like China and India have strong domestic consumption-based growth.
  • On the basis of the compound segment, the ‘TEA’ type dominates the ethanolamines market in 2019.
  • As per primary research, the growing construction industry will raise the demand for ethanolamines products.

logoKey Recommendations from Analysts

  • As per our analysts, the global ethanolamines market is expected to grow significantly over the forecast period.
  • The strategic and competitive advantage provided by ‘Triethanolamine’ is anticipated to be the key factor driving this market globally.
  • In recent years, our team of analysts has identified that growing construction activities worldwide have fueled the demand for ethanolamines.
  • Our analyst has identified that a rising population has raised the personal care industry and thereby, it is increasing the production of surfactants.
  • Overall, the global market has the potential to grow owing to its increasing industrialization in developing economies across the globe.

The quantitative data is further underlined and reinforced by comprehensive qualitative data which comprises various across-the-board market dynamics. The rationales which directly or indirectly impact the ethanolamines industry are exemplified through parameters such as growth drivers, restraints, challenges, and opportunities among other impacting factors.

Throughout our research report, we have encompassed all the proven models and tools of industry analysis and extensively illustrated all the key business strategies and business models adopted in the ethanolamines industry. The report provides an all-inclusive and detailed competitive landscape prevalent in the ethanolamines market.

The report utilizes established industry analysis tools and models such as Porter’s Five Forces framework to analyze and recognize critical business strategies adopted by various stakeholders involved in the entire value chain of the ethanolamines industry. The ethanolamines market report additionally employs SWOT analysis and PESTLE analysis models for further in-depth analysis.

The report study further includes an in-depth analysis of industry players' market shares and provides an overview of leading players' market position in the Ethanolamines sector. Key strategic developments in the ethanolamines market competitive landscape such as acquisitions & mergers, inaugurations of different products and services, partnerships & joint ventures, MoU agreements, VC & funding activities, R&D activities, and geographic expansion among other noteworthy activities by key players of the ethanolamines market are appropriately highlighted in the report.

Growing development across the globe has been anticipated to grow the ethanolamines market over the forecast period. The growing construction industry in developing economies including China, Saudi Arabia, India, UAE, and Brazil will register high growth over the next few years. Moreover, advancements in new applications such as agrochemical production and wood preservation will provide lucrative opportunities for the ethanolamines market. Furthermore, increased usage of personal products such as liquid soaps, shampoos, and conditioners among consumers has raised the production of surfactants and thereby increased the sales of ethanolamines in recent years. However, frequent changes in the prices of raw materials may limit the market growth.

The ethanolamines market research report delivers an acute valuation and taxonomy of the ethanolamines industry by practically splitting the market on the basis of different applications, compounds, and regions. Through the analysis of the historical and projected trends, all the segments and sub-segments were evaluated through the bottom-up approach, and different market sizes have been projected for FY 2020 to FY 2026. The regional segmentation of the ethanolamines industry includes the complete classification of all the major continents including North America, Latin America, Europe, Asia Pacific, and the Middle East & Africa. Further, country-wise data for the Ethanolamines industry is provided for the leading economies of the world.

The ethanolamines market is segmented based on application and compound. On the basis of application segmentation, the market is classified into gas treatment, surfactant, cement, and herbicides, among others. In terms of compound segmentation, the market is bifurcated into MEA, TEA, and DEA.

logoReport Scope

Report Attribute

Details

Market Size in 2019

USD 3.34 Billion

Projected Market Size in 2026

USD 4.65 Billion

CAGR Growth Rate

4.8% CAGR

Base Year

2019

Forecast Years

2020-2026

Key Market Players

Dow Chemical Corporation, Huntsman Corporation, BASF, CNPC, Thai Ethanolamines Co., Alkyl Amines Chemicals Ltd., INEOS Oxide Ltd., Daicel Chemical Industries, Celanese Corporation, Fushun Beifang Chemical Co. Ltd. and Akzo Nobel among others.

Key Segment

By Compound, By Application, By Region

Major Regions Covered

North America, Europe, Asia Pacific, Latin America, and the Middle East & Africa

Purchase Options

Request customized purchase options to meet your research needs. Explore purchase options

logoSome of the essential players operating in the ethanolamines market, but not restricted to include: 

  •  Dow Chemical Corporation
  •  Huntsman Corporation
  •  BASF
  •  CNPC
  •  Thai Ethanolamines Co.
  •  Alkyl Amines Chemicals Ltd.
  •  INEOS Oxide Ltd.
  •  Daicel Chemical Industries
  •  Celanese Corporation
  •  Fushun Beifang Chemical Co. Ltd.
  •  Akzo Nobel

The taxonomy of the ethanolamines industry by its scope and segmentation is as follows:

logo By Application Segmentation Analysis

  • Gas Treatment
  • Surfactant
  • Cement
  • Herbicides
  • Others

logo By Compound Segmentation Analysis

  • MEA
  • TEA
  • DEA

logo Regional Segmentation Analysis

  • North America
    • The U.S.
    • Canada
  • Europe
    • Germany
    • The UK
    • France
    • Spain
    • Italy
    • Rest of Europe
  • Asia Pacific
    • China
    • Japan
    • India
    • South Korea
    • Southeast Asia
    • Rest of Asia Pacific
  • Latin America
    • Brazil
    • Mexico
    • Rest of Latin America
  • Middle East & Africa
    • GCC
    • South Africa
    • Rest of the Middle East & Africa

Table of Content

  1. CHAPTER 1. Executive Summary
  2. CHAPTER 2. Ethanolamines market – Application Analysis
    1. 2.1. Global Ethanolamines Market – Application Overview
    2. 2.2. Global Ethanolamines Market Share, by Application, 2018 & 2025 (USD Million)
    3. 2.3. Global Ethanolamines Market share, by Application, 2018 & 2025 (Kilo Tons)
    4. 2.4. Gas Treatment
      1. 2.4.1. Global Gas Treatment Ethanolamines Market, 2016-2026 (USD Million)
      2. 2.4.2. Global Gas Treatment Ethanolamines Market, 2016-2026 (Kilo Tons)
    5. 2.5. Surfactant
      1. 2.5.1. Global Surfactant Ethanolamines Market, 2016-2026 (USD Million)
      2. 2.5.2. Global Surfactant Ethanolamines Market, 2016-2026 (Kilo Tons)
    6. 2.6. Cement
      1. 2.6.1. Global Cement Ethanolamines Market, 2016-2026 (USD Million)
      2. 2.6.2. Global Cement Ethanolamines Market, 2016-2026 (Kilo Tons)
    7. 2.7. Herbicides
      1. 2.7.1. Global Herbicides Ethanolamines Market, 2016-2026 (USD Million)
      2. 2.7.2. Global Herbicides Ethanolamines Market, 2016-2026 (Kilo Tons)
    8. 2.8. Others
      1. 2.8.1. Global Others Ethanolamines Market, 2016-2026 (USD Million)
      2. 2.8.2. Global Others Ethanolamines Market, 2016-2026 (Kilo Tons)
  3. CHAPTER 3. Ethanolamines market – Compound Analysis
    1. 3.1. Global Ethanolamines Market – Compound Overview
    2. 3.2. Global Ethanolamines Market Share, by Compound, 2018 & 2025 (USD Million)
    3. 3.3. Global Ethanolamines Market share, by Compound, 2018 & 2025 (Kilo Tons)
    4. 3.4. MEA
      1. 3.4.1. Global MEA Ethanolamines Market, 2016-2026 (USD Million)
      2. 3.4.2. Global MEA Ethanolamines Market, 2016-2026 (Kilo Tons)
    5. 3.5. TEA
      1. 3.5.1. Global TEA Ethanolamines Market, 2016-2026 (USD Million)
      2. 3.5.2. Global TEA Ethanolamines Market, 2016-2026 (Kilo Tons)
    6. 3.6. DEA
      1. 3.6.1. Global DEA Ethanolamines Market, 2016-2026 (USD Million)
      2. 3.6.2. Global DEA Ethanolamines Market, 2016-2026 (Kilo Tons)
  4. CHAPTER 4. Ethanolamines market – Regional Analysis
    1. 4.1. Global Ethanolamines Market Regional Overview
    2. 4.2. Global Ethanolamines Market Share, by Region, 2018 & 2025 (Value)
    3. 4.3. Global Ethanolamines Market Share, by Region, 2018 & 2025 (Volume)
    4. 4.4. North America
      1. 4.4.1. North America Ethanolamines Market size and forecast, 2016-2026
      2. 4.4.2. North America Ethanolamines Market, by Country, 2018 - 2025 (USD Million)
      3. 4.4.3. North America Market size and forecast, 2016-2026 (Kilo Tons)
      4. 4.4.4. North America Ethanolamines Market, by Country, 2018 - 2025 (Kilo Tons)
      5. 4.4.5. North America Ethanolamines Market, by Application, 2016-2026
        1. 4.4.5.1. North America Ethanolamines Market, by Application, 2016-2026 (USD Million)
        2. 4.4.5.2. North America Ethanolamines Market, by Application, 2016-2026 (Kilo Tons)
      6. 4.4.6. North America Ethanolamines Market, by Compound, 2016-2026
        1. 4.4.6.1. North America Ethanolamines Market, by Compound, 2016-2026 (USD Million)
        2. 4.4.6.2. North America Ethanolamines Market, by Compound, 2016-2026 (Kilo Tons)
      7. 4.4.7. U.S.
        1. 4.4.7.1. U.S. Market size and forecast, 2016-2026 (USD Million)
        2. 4.4.7.2. U.S. Market size and forecast, 2016-2026 (Kilo Tons)
      8. 4.4.8. Canada
        1. 4.4.8.1. Canada Market size and forecast, 2016-2026 (USD Million)
        2. 4.4.8.2. Canada Market size and forecast, 2016-2026 (Kilo Tons)
    5. 4.5. Europe
      1. 4.5.1. Europe Ethanolamines Market size and forecast, 2016-2026
      2. 4.5.2. Europe Ethanolamines Market, by Country, 2018 - 2025 (USD Million)
      3. 4.5.3. Europe Market size and forecast, 2016-2026 (Kilo Tons)
      4. 4.5.4. Europe Ethanolamines Market, by Country, 2018 - 2025 (Kilo Tons)
      5. 4.5.5. Europe Ethanolamines Market, by Application, 2016-2026
        1. 4.5.5.1. Europe Ethanolamines Market, by Application, 2016-2026 (USD Million)
        2. 4.5.5.2. Europe Ethanolamines Market, by Application, 2016-2026 (Kilo Tons)
      6. 4.5.6. Europe Ethanolamines Market, by Compound, 2016-2026
        1. 4.5.6.1. Europe Ethanolamines Market, by Compound, 2016-2026 (USD Million)
        2. 4.5.6.2. Europe Ethanolamines Market, by Compound, 2016-2026 (Kilo Tons)
      7. 4.5.7. Germany
        1. 4.5.7.1. Germany Market size and forecast, 2016-2026 (USD Million)
        2. 4.5.7.2. Germany Market size and forecast, 2016-2026 (Kilo Tons)
      8. 4.5.8. France
        1. 4.5.8.1. France Market size and forecast, 2016-2026 (USD Million)
        2. 4.5.8.2. France Market size and forecast, 2016-2026 (Kilo Tons)
      9. 4.5.9. U.K.
        1. 4.5.9.1. U.K. Market size and forecast, 2016-2026 (USD Million)
        2. 4.5.9.2. U.K. Market size and forecast, 2016-2026 (Kilo Tons)
      10. 4.5.10. Italy
        1. 4.5.10.1. Italy Market size and forecast, 2016-2026 (USD Million)
        2. 4.5.10.2. Italy Market size and forecast, 2016-2026 (Kilo Tons)
      11. 4.5.11. Spain
        1. 4.5.11.1. Spain Market size and forecast, 2016-2026 (USD Million)
        2. 4.5.11.2. Spain Market size and forecast, 2016-2026 (Kilo Tons)
      12. 4.5.12. Rest of Europe
        1. 4.5.12.1. Rest of Europe Market size and forecast, 2016-2026 (USD Million)
        2. 4.5.12.2. Rest of Europe Market size and forecast, 2016-2026 (Kilo Tons)
    6. 4.6. Asia Pacific
      1. 4.6.1. Asia Pacific Ethanolamines Market size and forecast, 2016-2026
      2. 4.6.2. Asia Pacific Ethanolamines Market, by Country, 2018 - 2025 (USD Million)
      3. 4.6.3. Asia Pacific Market size and forecast, 2016-2026 (Kilo Tons)
      4. 4.6.4. Asia Pacific Ethanolamines Market, by Country, 2018 - 2025 (Kilo Tons)
      5. 4.6.5. Asia Pacific Ethanolamines Market, by Application, 2016-2026
        1. 4.6.5.1. Asia Pacific Ethanolamines Market, by Application, 2016-2026 (USD Million)
        2. 4.6.5.2. Asia Pacific Ethanolamines Market, by Application, 2016-2026 (Kilo Tons)
      6. 4.6.6. Asia Pacific Ethanolamines Market, by Compound, 2016-2026
        1. 4.6.6.1. Asia Pacific Ethanolamines Market, by Compound, 2016-2026 (USD Million)
        2. 4.6.6.2. Asia Pacific Ethanolamines Market, by Compound, 2016-2026 (Kilo Tons)
      7. 4.6.7. China
        1. 4.6.7.1. China Market size and forecast, 2016-2026 (USD Million)
        2. 4.6.7.2. China Market size and forecast, 2016-2026 (Kilo Tons)
      8. 4.6.8. Japan
        1. 4.6.8.1. Japan Market size and forecast, 2016-2026 (USD Million)
        2. 4.6.8.2. Japan Market size and forecast, 2016-2026 (Kilo Tons)
      9. 4.6.9. India
        1. 4.6.9.1. India Market size and forecast, 2016-2026 (USD Million)
        2. 4.6.9.2. India Market size and forecast, 2016-2026 (Kilo Tons)
      10. 4.6.10. South Korea
        1. 4.6.10.1. South Korea Market size and forecast, 2016-2026 (USD Million)
        2. 4.6.10.2. South Korea Market size and forecast, 2016-2026 (Kilo Tons)
      11. 4.6.11. South-East Asia
        1. 4.6.11.1. South-East Asia Market size and forecast, 2016-2026 (USD Million)
        2. 4.6.11.2. South-East Asia Market size and forecast, 2016-2026 (Kilo Tons)
      12. 4.6.12. Rest of Asia Pacific
        1. 4.6.12.1. Rest of Asia Pacific Market size and forecast, 2016-2026 (USD Million)
        2. 4.6.12.2. Rest of Asia Pacific Market size and forecast, 2016-2026 (Kilo Tons)
    7. 4.7. Latin America
      1. 4.7.1. Latin America Ethanolamines Market size and forecast, 2016-2026
      2. 4.7.2. Latin America Ethanolamines Market, by Country, 2018 - 2025 (USD Million)
      3. 4.7.3. Latin America Market size and forecast, 2016-2026 (Kilo Tons)
      4. 4.7.4. Latin America Ethanolamines Market, by Country, 2018 - 2025 (Kilo Tons)
      5. 4.7.5. Latin America Ethanolamines Market, by Application, 2016-2026
        1. 4.7.5.1. Latin America Ethanolamines Market, by Application, 2016-2026 (USD Million)
        2. 4.7.5.2. Latin America Ethanolamines Market, by Application, 2016-2026 (Kilo Tons)
      6. 4.7.6. Latin America Ethanolamines Market, by Compound, 2016-2026
        1. 4.7.6.1. Latin America Ethanolamines Market, by Compound, 2016-2026 (USD Million)
        2. 4.7.6.2. Latin America Ethanolamines Market, by Compound, 2016-2026 (Kilo Tons)
      7. 4.7.7. Brazil
        1. 4.7.7.1. Brazil Market size and forecast, 2016-2026 (USD Million)
        2. 4.7.7.2. Brazil Market size and forecast, 2016-2026 (Kilo Tons)
      8. 4.7.8. Mexico
        1. 4.7.8.1. Mexico Market size and forecast, 2016-2026 (USD Million)
        2. 4.7.8.2. Mexico Market size and forecast, 2016-2026 (Kilo Tons)
      9. 4.7.9. Rest of Latin America
        1. 4.7.9.1. Rest of Latin America Market size and forecast, 2016-2026 (USD Million)
        2. 4.7.9.2. Rest of Latin America Market size and forecast, 2016-2026 (Kilo Tons)
    8. 4.8. The Middle-East and Africa
      1. 4.8.1. The Middle-East and Africa Ethanolamines Market size and forecast, 2016-2026
      2. 4.8.2. The Middle-East and Africa Ethanolamines Market, by Country, 2018 - 2025 (USD Million)
      3. 4.8.3. The Middle-East and Africa Market size and forecast, 2016-2026 (Kilo Tons)
      4. 4.8.4. The Middle-East and Africa Ethanolamines Market, by Country, 2018 - 2025 (Kilo Tons)
      5. 4.8.5. The Middle-East and Africa Ethanolamines Market, by Application, 2016-2026
        1. 4.8.5.1. The Middle-East and Africa Ethanolamines Market, by Application, 2016-2026 (USD Million)
        2. 4.8.5.2. The Middle-East and Africa Ethanolamines Market, by Application, 2016-2026 (Kilo Tons)
      6. 4.8.6. The Middle-East and Africa Ethanolamines Market, by Compound, 2016-2026
        1. 4.8.6.1. The Middle-East and Africa Ethanolamines Market, by Compound, 2016-2026 (USD Million)
        2. 4.8.6.2. The Middle-East and Africa Ethanolamines Market, by Compound, 2016-2026 (Kilo Tons)
      7. 4.8.7. GCC Countries
        1. 4.8.7.1. GCC Countries Market size and forecast, 2016-2026 (USD Million)
        2. 4.8.7.2. GCC Countries Market size and forecast, 2016-2026 (Kilo Tons)
      8. 4.8.8. South Africa
        1. 4.8.8.1. South Africa Market size and forecast, 2016-2026 (USD Million)
        2. 4.8.8.2. South Africa Market size and forecast, 2016-2026 (Kilo Tons)
      9. 4.8.9. Rest of Middle-East Africa
        1. 4.8.9.1. Rest of Middle-East Africa Market size and forecast, 2016-2026 (USD Million)
        2. 4.8.9.2. Rest of Middle-East Africa Market size and forecast, 2016-2026 (Kilo Tons)
  5. CHAPTER 5. Ethanolamines Production, Consumption, Export, Import by Regions
    1. 5.1. Global Ethanolamines production and revenue, 2015-2025 (USD Million) (Kilo Tons)
    2. 5.2. Global Import and Export Analysis, by Region
  6. CHAPTER 6. Ethanolamines market – Competitive Landscape
    1. 6.1. Competitor Market Share – Revenue
    2. 6.2. Market Concentration Rate Analysis, Top 3 and Top 5 Players
    3. 6.3. Competitor Market Share – Volume
    4. 6.4. Strategic Development
      1. 6.4.1. Acquisitions and Mergers
      2. 6.4.2. New Products
      3. 6.4.3. Research & Development Activities
  7. CHAPTER 7. Company Profiles
    1. 7.1. BASF
      1. 7.1.1. Company Overview
      2. 7.1.2. BASF Sales, Revenue, Price, and Gross Margin
      3. 7.1.3. Product portfolio
      4. 7.1.4. Recent initiatives
    2. 7.2. CNPC
      1. 7.2.1. Company Overview
      2. 7.2.2. CNPC Sales, Revenue, Price, and Gross Margin
      3. 7.2.3. Product portfolio
      4. 7.2.4. Recent initiatives
    3. 7.3. Huntsman Corporation
      1. 7.3.1. Company Overview
      2. 7.3.2. Huntsman Corporation Sales, Revenue, Price, and Gross Margin
      3. 7.3.3. Product portfolio
      4. 7.3.4. Recent initiatives
    4. 7.4. Dow Chemical Corporation
      1. 7.4.1. Company Overview
      2. 7.4.2. Dow Chemical Corporation Sales, Revenue, Price, and Gross Margin
      3. 7.4.3. Product portfolio
      4. 7.4.4. Recent initiatives
    5. 7.5. Huntsman Corporation
      1. 7.5.1. Company Overview
      2. 7.5.2. Huntsman Corporation Sales, Revenue, Price, and Gross Margin
      3. 7.5.3. Product portfolio
      4. 7.5.4. Recent initiatives
    6. 7.6. Thai Ethanolamines Co.
      1. 7.6.1. Company Overview
      2. 7.6.2. Thai Ethanolamines Co. Sales, Revenue, Price, and Gross Margin
      3. 7.6.3. Product portfolio
      4. 7.6.4. Recent initiatives
    7. 7.7. Alkyl Amines Chemicals Ltd.
      1. 7.7.1. Company Overview
      2. 7.7.2. Alkyl Amines Chemicals Ltd. Sales, Revenue, Price, and Gross Margin
      3. 7.7.3. Product portfolio
      4. 7.7.4. Recent initiatives
    8. 7.8. INEOS Oxide Ltd.
      1. 7.8.1. Company Overview
      2. 7.8.2. INEOS Oxide Ltd. Sales, Revenue, Price, and Gross Margin
      3. 7.8.3. Product portfolio
      4. 7.8.4. Recent initiatives
    9. 7.9. Daicel Chemical Industries
      1. 7.9.1. Company Overview
      2. 7.9.2. Daicel Chemical Industries Sales, Revenue, Price, and Gross Margin
      3. 7.9.3. Product portfolio
      4. 7.9.4. Recent initiatives
    10. 7.10. Celanese Corporation,
      1. 7.10.1. Company Overview
      2. 7.10.2. Celanese Corporation, Sales, Revenue, Price, and Gross Margin
      3. 7.10.3. Product portfolio
      4. 7.10.4. Recent initiatives
    11. 7.11. Fushun Beifang Chemical Co. Ltd.
      1. 7.11.1. Company Overview
      2. 7.11.2. Fushun Beifang Chemical Co. Ltd. Sales, Revenue, Price, and Gross Margin
      3. 7.11.3. Product portfolio
      4. 7.11.4. Recent initiatives
  8. CHAPTER 8. Ethanolamines — Industry Analysis
    1. 8.1. Introduction and Taxonomy
    2. 8.2. Ethanolamines Market – Key Trends
      1. 8.2.1. Market Drivers
      2. 8.2.2. Market Restraints
      3. 8.2.3. Market Opportunities
    3. 8.3. Value Chain Analysis
    4. 8.4. Key Mandates and Regulations
    5. 8.5. Technology Roadmap and Timeline
    6. 8.6. Ethanolamines market – Attractiveness Analysis
      1. 8.6.1. By Application
      2. 8.6.2. By Compound
      3. 8.6.3. By Region
  9. CHAPTER 9. Raw Material analysis
    1. 9.1. Ethanolamines Key Raw Material Analysis
      1. 9.1.1. Key Raw Materials
      2. 9.1.2. Price Trend of Key Raw Materials
    2. 9.2. Key Suppliers of Raw Materials
    3. 9.3. Proportion of Manufacturing Cost Structure
      1. 9.3.1. Raw Materials
      2. 9.3.2. Labor Cost
    4. 9.4. Manufacturing Expenses Analysis of Ethanolamines
  10. CHAPTER 10. Industrial Chain, Sourcing Strategy and Downstream Buyers
    1. 10.1. Ethanolamines Industrial Chain Analysis
    2. 10.2. Upstream Raw Materials Sourcing
      1. 10.2.1. Risk Mitigation:
      2. 10.2.2. Supplier Relationships:
      3. 10.2.3. Business Processes:
      4. 10.2.4. Securing the Product:
    3. 10.3. Raw Materials Sources of Ethanolamines Major Manufacturers in 2016
    4. 10.4. Downstream Buyers
    5. 10.5. Distributors/Traders List
  11. CHAPTER 11. Marketing Strategy Analysis, Distributors
    1. 11.1. Marketing Channel
    2. 11.2. Direct Marketing
    3. 11.3. Indirect Marketing
    4. 11.4. Marketing Channel Development Trend
    5. 11.5. Economic/Political Environmental Change
  12. CHAPTER 12. Report Conclusion
  13. CHAPTER 13. Research Approach & Methodology
    1. 13.1. Report Description
    2. 13.2. Research Scope
    3. 13.3. Research Methodology
      1. 13.3.1. Secondary Research
      2. 13.3.2. Primary Research
      3. 13.3.3. Models
        1. 13.3.3.1. Company Share Analysis Model
        2. 13.3.3.2. Revenue Based Modeling
        3. 13.3.3.3. Research Limitations

        List of Figures

        FIG. 1 Global Ethanolamines Market, 2016-2026 (USD Million)
        FIG. 2 Global Ethanolamines Market Share, by Application, 2018 & 2025 (USD Million)
        FIG. 3 Global Ethanolamines Market share, by Application, 2018 & 2025 (Kilo Tons)
        FIG. 4 Global Gas Treatment Ethanolamines Market, 2016-2026 (USD Million)
        FIG. 5 Global Gas Treatment Ethanolamines  Market, 2016-2026 (Kilo Tons)
        FIG. 6 Global Surfactant Ethanolamines Market, 2016-2026 (USD Million)
        FIG. 7 Global Surfactant Ethanolamines  Market, 2016-2026 (Kilo Tons)
        FIG. 8 Global Cement Ethanolamines Market, 2016-2026 (USD Million)
        FIG. 9 Global Cement Ethanolamines  Market, 2016-2026 (Kilo Tons)
        FIG. 10 Global Herbicides Ethanolamines Market, 2016-2026 (USD Million)
        FIG. 11 Global Herbicides Ethanolamines  Market, 2016-2026 (Kilo Tons)
        FIG. 12 Global Others Ethanolamines Market, 2016-2026 (USD Million)
        FIG. 13 Global Others Ethanolamines  Market, 2016-2026 (Kilo Tons)
        FIG. 14 Global Ethanolamines Market Share, by Compound, 2018 & 2025 (USD Million)
        FIG. 15 Global Ethanolamines Market share, by Compound, 2018 & 2025 (Kilo Tons)
        FIG. 16 Global MEA Ethanolamines Market, 2016-2026 (USD Million)
        FIG. 17 Global MEA Ethanolamines  Market, 2016-2026 (Kilo Tons)
        FIG. 18 Global TEA Ethanolamines Market, 2016-2026 (USD Million)
        FIG. 19 Global TEA Ethanolamines  Market, 2016-2026 (Kilo Tons)
        FIG. 20 Global DEA Ethanolamines Market, 2016-2026 (USD Million)
        FIG. 21 Global DEA Ethanolamines  Market, 2016-2026 (Kilo Tons)
        FIG. 22 Global Ethanolamines Market Share, by Region, 2018 & 2025
        FIG. 23 Global Ethanolamines Market Share, by Region, 2018 & 2025
        FIG. 24 North America Ethanolamines Market, 2016-2026
        FIG. 25 North America Ethanolamines  Market, 2016-2026 (Kilo Tons)
        FIG. 26 U.S. Ethanolamines Market, 2016-2026
        FIG. 27 U.S. Ethanolamines  Market, 2016-2026 (Kilo Tons)
        FIG. 28 Canada Ethanolamines Market, 2016-2026
        FIG. 29 Canada Ethanolamines  Market, 2016-2026 (Kilo Tons)
        FIG. 30 Europe Ethanolamines Market, 2016-2026
        FIG. 31 Europe Ethanolamines  Market, 2016-2026 (Kilo Tons)
        FIG. 32 Germany Ethanolamines Market, 2016-2026
        FIG. 33 Germany Ethanolamines  Market, 2016-2026 (Kilo Tons)
        FIG. 34 France Ethanolamines Market, 2016-2026
        FIG. 35 France Ethanolamines  Market, 2016-2026 (Kilo Tons)
        FIG. 36 U.K. Ethanolamines Market, 2016-2026
        FIG. 37 U.K. Ethanolamines  Market, 2016-2026 (Kilo Tons)
        FIG. 38 Italy Ethanolamines Market, 2016-2026
        FIG. 39 Italy Ethanolamines  Market, 2016-2026 (Kilo Tons)
        FIG. 40 Spain Ethanolamines Market, 2016-2026
        FIG. 41 Spain Ethanolamines  Market, 2016-2026 (Kilo Tons)
        FIG. 42 Rest of Europe Ethanolamines Market, 2016-2026
        FIG. 43 Rest of Europe Ethanolamines  Market, 2016-2026 (Kilo Tons)
        FIG. 44 Asia Pacific Ethanolamines Market, 2016-2026
        FIG. 45 Asia Pacific Ethanolamines  Market, 2016-2026 (Kilo Tons)
        FIG. 46 China Ethanolamines Market, 2016-2026
        FIG. 47 China Ethanolamines  Market, 2016-2026 (Kilo Tons)
        FIG. 48 Japan Ethanolamines Market, 2016-2026
        FIG. 49 Japan Ethanolamines  Market, 2016-2026 (Kilo Tons)
        FIG. 50 India Ethanolamines Market, 2016-2026
        FIG. 51 India Ethanolamines  Market, 2016-2026 (Kilo Tons)
        FIG. 52 South  Korea Ethanolamines Market, 2016-2026
        FIG. 53 South  Korea Ethanolamines  Market, 2016-2026 (Kilo Tons)
        FIG. 54 South-East Asia Ethanolamines Market, 2016-2026
        FIG. 55 South-East Asia Ethanolamines  Market, 2016-2026 (Kilo Tons)
        FIG. 56 Rest of Asia Pacific Ethanolamines Market, 2016-2026
        FIG. 57 Rest of Asia Pacific Ethanolamines  Market, 2016-2026 (Kilo Tons)
        FIG. 58 Latin America Ethanolamines Market, 2016-2026
        FIG. 59 Latin America Ethanolamines  Market, 2016-2026 (Kilo Tons)
        FIG. 60 Brazil Ethanolamines Market, 2016-2026
        FIG. 61 Brazil Ethanolamines  Market, 2016-2026 (Kilo Tons)
        FIG. 62 Mexico Ethanolamines Market, 2016-2026
        FIG. 63 Mexico Ethanolamines  Market, 2016-2026 (Kilo Tons)
        FIG. 64 Rest of Latin America Ethanolamines Market, 2016-2026
        FIG. 65 Rest of Latin America Ethanolamines  Market, 2016-2026 (Kilo Tons)
        FIG. 66 The Middle-East and Africa Ethanolamines Market, 2016-2026
        FIG. 67 The Middle-East and Africa Ethanolamines  Market, 2016-2026 (Kilo Tons)
        FIG. 68 GCC Countries Ethanolamines Market, 2016-2026
        FIG. 69 GCC Countries Ethanolamines  Market, 2016-2026 (Kilo Tons)
        FIG. 70 South Africa Ethanolamines Market, 2016-2026
        FIG. 71 South Africa Ethanolamines  Market, 2016-2026 (Kilo Tons)
        FIG. 72 Rest of Middle-East Africa Ethanolamines Market, 2016-2026
        FIG. 73 Rest of Middle-East Africa Ethanolamines  Market, 2016-2026 (Kilo Tons)
        FIG. 74 Global Ethanolamines production and revenue, 2015-2025 (USD Million) (Kilo Tons)
        FIG. 75 North America Ethanolamines production and revenue, 2015-2025 (USD Million) (Kilo Tons)
        FIG. 76 Europe Ethanolamines production and revenue, 2015-2025 (USD Million) (Kilo Tons)
        FIG. 77 Asia Pacific Ethanolamines production and revenue, 2015-2025 (USD Million) (Kilo Tons)
        FIG. 78 Latin America Ethanolamines production and revenue, 2015-2025 (USD Million) (Kilo Tons)
        FIG. 79 Middle East and Africa Ethanolamines production and revenue, 2015-2025 (USD Million) (Kilo Tons)
        FIG. 80 Competitor Market Share – Revenue
        FIG. 81 Competitor Market Share – Volume
        FIG. 82 BASF Revenue and Growth Rate
        FIG. 83 BASF Market Share
        FIG. 84 CNPC Revenue and Growth Rate
        FIG. 85 CNPC Market Share
        FIG. 86 Huntsman Corporation Revenue and Growth Rate
        FIG. 87 Huntsman Corporation Market Share
        FIG. 88 Dow Chemical Corporation Revenue and Growth Rate
        FIG. 89 Dow Chemical Corporation Market Share
        FIG. 90 Huntsman Corporation Revenue and Growth Rate
        FIG. 91 Huntsman Corporation Market Share
        FIG. 92 Thai Ethanolamines Co. Revenue and Growth Rate
        FIG. 93 Thai Ethanolamines Co. Market Share
        FIG. 94 Alkyl Amines Chemicals Ltd. Revenue and Growth Rate
        FIG. 95 Alkyl Amines Chemicals Ltd. Market Share
        FIG. 96 INEOS Oxide Ltd. Revenue and Growth Rate
        FIG. 97 INEOS Oxide Ltd. Market Share
        FIG. 98 Daicel Chemical Industries Revenue and Growth Rate
        FIG. 99 Daicel Chemical Industries Market Share
        FIG. 100 Celanese Corporation, Revenue and Growth Rate
        FIG. 101 Celanese Corporation, Market Share
        FIG. 102 Fushun Beifang Chemical Co. Ltd. Revenue and Growth Rate
        FIG. 103 Fushun Beifang Chemical Co. Ltd. Market Share
        FIG. 104 Market Dynamics
        FIG. 105 Global Ethanolamines – Value Chain Analysis
        FIG. 106 Key Mandates and Regulations
        FIG. 107 Technology Roadmap and Timeline
        FIG. 108 Market Attractiveness Analysis – By Application
        FIG. 109 Market Attractiveness Analysis – By Compound
        FIG. 110 Market Attractiveness Analysis – By Region
        FIG. 111 Manufacturing Cost Structure of Ethanolamines
        FIG. 112 Ethanolamines Industrial Chain Analysis
        FIG. 113 Market Channel
        FIG. 114 Marketing Channel Development Trend
        FIG. 115 Growth in World Gross Product, 2008-2018

        List of Tables

        TABLE 1 Global Ethanolamines market, 2018 & 2025 (USD Million)
        TABLE 2 Global Ethanolamines market, by Application, 2016-2026 (USD Million)
        TABLE 3 Global Ethanolamines market, by Application, 2016-2026 (Kilo Tons)
        TABLE 4 Global Ethanolamines market, by Compound, 2016-2026 (USD Million)
        TABLE 5 Global Ethanolamines market, by Compound, 2016-2026 (Kilo Tons)
        TABLE 6 Global Ethanolamines market, by region, 2016-2026 (USD Million)
        TABLE 7 Global Ethanolamines market, by region, 2016-2026 (Kilo Tons)
        TABLE 8 North America Ethanolamines Market, by Application, 2016-2026 (USD Million)
        TABLE 9 North America Ethanolamines Market, by Application, 2016-2026 (Kilo Tons)
        TABLE 10 North America Ethanolamines Market, by Compound, 2016-2026 (USD Million)
        TABLE 11 North America Ethanolamines Market, by Compound, 2016-2026 (Kilo Tons)
        TABLE 12 Europe Ethanolamines Market, by Application, 2016-2026 (USD Million)
        TABLE 13 Europe Ethanolamines Market, by Application, 2016-2026 (Kilo Tons)
        TABLE 14 Europe Ethanolamines Market, by Compound, 2016-2026 (USD Million)
        TABLE 15 Europe Ethanolamines Market, by Compound, 2016-2026 (Kilo Tons)
        TABLE 16 Asia Pacific Ethanolamines Market, by Application, 2016-2026 (USD Million)
        TABLE 17 Asia Pacific Ethanolamines Market, by Application, 2016-2026 (Kilo Tons)
        TABLE 18 Asia Pacific Ethanolamines Market, by Compound, 2016-2026 (USD Million)
        TABLE 19 Asia Pacific Ethanolamines Market, by Compound, 2016-2026 (Kilo Tons)
        TABLE 20 Latin America Ethanolamines Market, by Application, 2016-2026 (USD Million)
        TABLE 21 Latin America Ethanolamines Market, by Application, 2016-2026 (Kilo Tons)
        TABLE 22 Latin America Ethanolamines Market, by Compound, 2016-2026 (USD Million)
        TABLE 23 Latin America Ethanolamines Market, by Compound, 2016-2026 (Kilo Tons)
        TABLE 24 The Middle-East and Africa Ethanolamines Market, by Application, 2016-2026 (USD Million)
        TABLE 25 The Middle-East and Africa Ethanolamines Market, by Application, 2016-2026 (Kilo Tons)
        TABLE 26 The Middle-East and Africa Ethanolamines Market, by Compound, 2016-2026 (USD Million)
        TABLE 27 The Middle-East and Africa Ethanolamines Market, by Compound, 2016-2026 (Kilo Tons)
        TABLE 28 North America Ethanolamines Production, Consumption, Export, Import, 2016-2019
        TABLE 29 Europe Ethanolamines Production, Consumption, Export, Import, 2016-2019
        TABLE 30 Asia Pacific Ethanolamines Production, Consumption, Export, Import, 2016-2019
        TABLE 31 Latin America Ethanolamines Production, Consumption, Export, Import, 2016-2019
        TABLE 32 Middle East & Africa Ethanolamines Production, Consumption, Export, Import, 2016-2019
        TABLE 33 Global Ethanolamines Market - Company Revenue Analysis 2016-2019 (USD Million)
        TABLE 34 Global Ethanolamines Market - Company Revenue Share Analysis 2016-2019(%)
        TABLE 35 Global Ethanolamines Market - Company Volume Analysis 2016-2019 (Kilo Tons)
        TABLE 36 Global Ethanolamines Market - Company Volume Share Analysis 2016-2019(%)
        TABLE 37 Acquisitions and Mergers
        TABLE 38 New Product/Service Launch
        TABLE 39 Research & Development Activities
        TABLE 40 Market Drivers
        TABLE 41 Market Restraints
        TABLE 42 Market Opportunities
        TABLE 43 Production Base and Market Concentration Rate of Raw Material
        TABLE 44 Key Suppliers of Raw Materials
        TABLE 45 Raw Materials Sources of Ethanolamines Major Manufacturers in 2016
        TABLE 46 Major Buyers of Ethanolamines
        TABLE 47 Distributors/Traders of Ethanolamines by Region
        

Industry Major Market Players

  •  Dow Chemical Corporation
  •  Huntsman Corporation
  •  BASF
  •  CNPC
  •  Thai Ethanolamines Co.
  •  Alkyl Amines Chemicals Ltd.
  •  INEOS Oxide Ltd.
  •  Daicel Chemical Industries
  •  Celanese Corporation
  •  Fushun Beifang Chemical Co. Ltd.
  •  Akzo Nobel