Search Market Research Report

Discover Our Latest Reports
Discover Our Featured Reports
Discover Top Selling Reports

Ester Gum Market Size, Share Global Analysis Report, 2020–2026

report img

Ester Gum Market By Type (PRGE, GEWR, P & FHGEGR, Penta Ester Gum, Maleic adduct of Gum Rosin, Glycerol Ester of Gum Rosin Modified with Maleic Anhydride, Others) and By Application (Chewing Gum, Inks, Pharmaceuticals, Cosmetics, Beverages, Paints & Coatings, Adhesives, Others): Global Industry Outlook, Market Size, Business Intelligence, Consumer Preferences, Statistical Surveys, Comprehensive Analysis, Historical Developments, Current Trends, and Forecast 2020–2026

Industry Insights

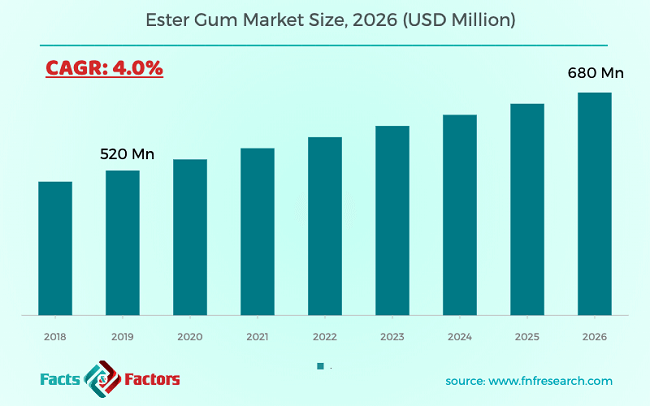
[180+ Pages Report] According to the report published by Facts Factors, the global ester gum market size was worth around 520 million in 2019 and is predicted to grow to around USD 680 million by 2026 with a compound annual growth rate (CAGR) of roughly 4% between 2020 and 2026. The report analyzes the global ester gum market drivers, restraints/challenges, and the effect they have on the demands during the projection period. In addition, the report explores emerging opportunities in the ester gum market.

Ester Gum Market

To know more about this report | Request Free Sample Copy

This specialized and expertise-oriented industry research report scrutinizes the technical and commercial business outlook of the Ester Gum industry. The report analyzes and declares the historical and current trends analysis of the Ester Gum industry and subsequently recommends the projected trends anticipated to be observed in the Ester Gum market during the upcoming years.

The ester gum market report analyzes and notifies the industry statistics at the global as well as regional and country levels in order to acquire a thorough perspective of the entire Ester Gum market. The historical and past insights are provided for FY 2016 to FY 2019 whereas projected trends are delivered for FY 2020 to FY 2026. The quantitative and numerical data is represented in terms of both volume (Kilo Tons) and value (USD Million) from FY 2016 – 2026.


logoKey Insights from Primary Research

  • As per our main respondents, the market for ester gum is set to grow annually at a rate of around 4%.
  • It was concluded from primary research that the global ester gum market was valued at around USD 520.00 Million in 2019.
  • Now terms of volume, the global ester gum market stood at around 240.00 Kilo Tons, in 2019.
  • Based on type segmentation, the “Penta Ester Gum” category accounted for around 23% share, in 2019.
  • Based on application segmentation, the “Chewing Gum” category held the leading share at more than 32%, in 2019.

logoKey Recommendations from Analysts

  • As per our analysis, the Asia Pacific market is estimated to grow at a CAGR of 4% during with share 37% 2019-2026.
  • China Growing at a CAGR around 3%, the ester gum market increasing the number of local players is estimated to enhance the future demand.
  • China is viewing a vast demand for cosmetics & personal, chewing gum, care products, and beverages in the country.
  • Increasing the beverage industry in the region amid increasing tourism and population coupled with increasing disposable income is projected to propel the ester gum market in the region.
  • The Raw Material costs contain that is attached to materials that are purchased by its raw materials, business, manufacturing supplies parts, and components.

The quantitative data is further underlined and reinforced by comprehensive qualitative data which comprises various across-the-board market dynamics. The rationales which directly or indirectly impact the Ester Gum industry are exemplified through parameters such as growth drivers, restraints, challenges, and opportunities among other impacting factors.

Throughout our research report, we have encompassed all the proven models and tools of industry analysis and extensively illustrated all the key business strategies and business models adopted in the Ester Gum industry. The report provides an all-inclusive and detailed competitive landscape prevalent in the Ester Gum market.

The report utilizes established industry analysis tools and models such as Porter’s Five Forces framework to analyze and recognize critical business strategies adopted by various stakeholders involved in the entire value chain of the Ester Gum industry. The Ester Gum market report additionally employs SWOT analysis and PESTLE analysis models for further in-depth analysis.

The report study further includes an in-depth analysis of industry players' market shares and provides an overview of leading players' market position in the Ester Gum sector. Key strategic developments in the Ester Gum market competitive landscape such as acquisitions & mergers, inaugurations of different products and services, partnerships & joint ventures, MoU agreements, VC & funding activities, R&D activities, and geographic expansion among other noteworthy activities by key players of the Ester Gum market are appropriately highlighted in the report.

Ester gum is announced into furthermost papers to develop the intrinsic hydrophilic personality of cellulose fibers and too to contract this tendency to a different extent to fit particular use. It is also considered as a basic matrix material in the field of coatings and reinforced plastics.

Increasing consumption of ester gum in different application industries is demanding for the increased production and distribution of the ester gum products across the world. Moreover, the key companies operating in the global ester gum industry are focusing on sustainable business development through strategic partnerships and a wide distribution network.

The Ester Gum market research report delivers an acute valuation and taxonomy of the Ester Gum industry by practically splitting the market on the basis of different types, applications, and regions. Through the analysis of the historical and projected trends, all the segments and sub-segments were evaluated through the bottom-up approach, and different market sizes have been projected for FY 2020 to FY 2026.

logoReport Scope

Report Attribute

Details

Market Size in 2019

USD 520 Million

Projected Market Size in 2026

USD 680 Million

CAGR Growth Rate

4% CAGR

Base Year

2019

Forecast Years

2020-2026

Key Market Players

Pinova Inc., Eastman Chemical Company, Sood Paper & Allied Chemicals, Dev Resins, Cardinal Chemicals Pvt. Ltd., Shree Resin, Arakawa Chemical Industries Ltd., Zhejiang Xinsong Resin Co.Ltd., and Others

Key Segment

By Type, Application, and Region

Major Regions Covered

North America, Europe, Asia Pacific, Latin America, and the Middle East & Africa

Purchase Options

Request customized purchase options to meet your research needs.Explore purchase options

The regional segmentation of the Ester Gum industry includes the complete classification of all the major continents including North America, Latin America, Europe, Asia Pacific, and Middle East & Africa. Further, country-wise data for the Ester Gum industry is provided for the leading economies of the world.

The Ester Gum market is segmented based on type and application. On the basis of type segmentation, the market is classified into PRGE, GEWR, P & FHGEGR, Penta Ester Gum, Maleic adduct of Gum Rosin, Glycerol Ester of Gum Rosin Modified with Maleic Anhydride, Others. In terms of application segmentation, the market is bifurcated into Chewing Gum, Inks, Pharmaceuticals, Cosmetics, Beverages, Paints & Coatings, Adhesives, Other.

logoSome of the essential players operating in the ester gum market, but not restricted

  •  Pinova Inc.
  •  Eastman Chemical Company
  •  Sood Paper & Allied Chemicals
  •  Dev Resins
  •  Cardinal Chemicals Pvt. Ltd.
  •  Shree Resin
  •  Arakawa Chemical Industries Ltd.
  •  Zhejiang Xinsong Resin Co.Ltd.

The taxonomy of the ester gum industry by its scope and segmentation is as follows:

logoBy Type Segmentation Analysis

  • PRGE
  • GEWR
  • P & FHGEGR
  • Penta Ester Gum
  • Maleic adduct of Gum Rosin
  • Glycerol Ester of Gum Rosin Modified with Maleic Anhydride
  • Others

logoBy Application Segmentation Analysis

  • Chewing Gum
  • Inks
  • Pharmaceuticals
  • Cosmetics
  • Beverages
  • Paints & Coatings
  • Adhesives
  • Other

logoBy Regional Segmentation Analysis

  • North America
    • The U.S.
    • Canada
  • Europe
    • Germany
    • The UK
    • France
    • Spain
    • Italy
    • Rest of Europe
  • Asia Pacific
    • China
    • Japan
    • India
    • South Korea
    • Southeast Asia
    • Rest of Asia Pacific
  • Latin America
    • Brazil
    • Mexico
    • Rest of Latin America
  • Middle East & Africa
    • GCC
    • South Africa
    • Rest of Middle East & Africa

Table of Content

  1. CHAPTER 1. Executive Summary
  2. CHAPTER 2. Ester Gum market – Type Analysis
    1. 2.1. Global Ester Gum Market – Type Overview
    2. 2.2. Global Ester Gum Market Share, by Type, 2019 & 2026 (USD Million)
    3. 2.3. Global Ester Gum Market share, by Type, 2019 & 2026 (Kilo tons)
    4. 2.4. PRGE
      1. 2.4.1. Global PRGE Ester Gum Market, 2016-2026 (USD Million)
      2. 2.4.2. Global PRGE Ester Gum Market, 2016-2026 (Kilo tons)
    5. 2.5. GEWR
      1. 2.5.1. Global GEWR Ester Gum Market, 2016-2026 (USD Million)
      2. 2.5.2. Global GEWR Ester Gum Market, 2016-2026 (Kilo tons)
    6. 2.6. P & FHGEGR
      1. 2.6.1. Global P & FHGEGR Ester Gum Market, 2016-2026 (USD Million)
      2. 2.6.2. Global P & FHGEGR Ester Gum Market, 2016-2026 (Kilo tons)
    7. 2.7. Penta Ester Gum
      1. 2.7.1. Global Penta Ester Gum Ester Gum Market, 2016-2026 (USD Million)
      2. 2.7.2. Global Penta Ester Gum Ester Gum Market, 2016-2026 (Kilo tons)
    8. 2.8. Maleic adduct of Gum Rosin
      1. 2.8.1. Global Maleic adduct of Gum Rosin Ester Gum Market, 2016-2026 (USD Million)
      2. 2.8.2. Global Maleic adduct of Gum Rosin Ester Gum Market, 2016-2026 (Kilo tons)
    9. 2.9. Glycerol Ester of Gum Rosin Modified with Maleic Anhydride
      1. 2.9.1. Global Glycerol Ester of Gum Rosin Modified with Maleic Anhydride Ester Gum Market, 2016-2026 (USD Million)
      2. 2.9.2. Global Glycerol Ester of Gum Rosin Modified with Maleic Anhydride Ester Gum Market, 2016-2026 (Kilo tons)
    10. 2.10. Others
      1. 2.10.1. Global Others Ester Gum Market, 2016-2026 (USD Million)
      2. 2.10.2. Global Others Ester Gum Market, 2016-2026 (Kilo tons)
  3. CHAPTER 3. Ester Gum market – Application Analysis
    1. 3.1. Global Ester Gum Market – Application Overview
    2. 3.2. Global Ester Gum Market Share, by Application, 2019 & 2026 (USD Million)
    3. 3.3. Global Ester Gum Market share, by Application, 2019 & 2026 (Kilo tons)
    4. 3.4. Chewing Gum
      1. 3.4.1. Global Chewing Gum Ester Gum Market, 2016-2026 (USD Million)
      2. 3.4.2. Global Chewing Gum Ester Gum Market, 2016-2026 (Kilo tons)
    5. 3.5. Inks
      1. 3.5.1. Global Inks Ester Gum Market, 2016-2026 (USD Million)
      2. 3.5.2. Global Inks Ester Gum Market, 2016-2026 (Kilo tons)
    6. 3.6. Pharmaceuticals
      1. 3.6.1. Global Pharmaceuticals Ester Gum Market, 2016-2026 (USD Million)
      2. 3.6.2. Global Pharmaceuticals Ester Gum Market, 2016-2026 (Kilo tons)
    7. 3.7. Cosmetics
      1. 3.7.1. Global Cosmetics Ester Gum Market, 2016-2026 (USD Million)
      2. 3.7.2. Global Cosmetics Ester Gum Market, 2016-2026 (Kilo tons)
    8. 3.8. Beverages
      1. 3.8.1. Global Beverages Ester Gum Market, 2016-2026 (USD Million)
      2. 3.8.2. Global Beverages Ester Gum Market, 2016-2026 (Kilo tons)
    9. 3.9. Paints & Coatings
      1. 3.9.1. Global Paints & Coatings Ester Gum Market, 2016-2026 (USD Million)
      2. 3.9.2. Global Paints & Coatings Ester Gum Market, 2016-2026 (Kilo tons)
    10. 3.10. Adhesives
      1. 3.10.1. Global Adhesives Ester Gum Market, 2016-2026 (USD Million)
      2. 3.10.2. Global Adhesives Ester Gum Market, 2016-2026 (Kilo tons)
    11. 3.11. Other
      1. 3.11.1. Global Other Ester Gum Market, 2016-2026 (USD Million)
      2. 3.11.2. Global Other Ester Gum Market, 2016-2026 (Kilo tons)
  4. CHAPTER 4. Ester Gum market – Regional Analysis
    1. 4.1. Global Ester Gum Market Regional Overview
    2. 4.2. Global Ester Gum Market Share, by Region, 2019 & 2026 (Value)
    3. 4.3. Global Ester Gum Market Share, by Region, 2019 & 2026 (Volume)
    4. 4.4. North America
      1. 4.4.1. North America Ester Gum Market size and forecast, 2016-2026
      2. 4.4.2. North America Ester Gum Market, by Country, 2018 - 2025 (USD Million)
      3. 4.4.3. North America Market size and forecast, 2016-2026 (Kilo tons)
      4. 4.4.4. North America Ester Gum Market, by Country, 2018 - 2025 (Kilo tons)
      5. 4.4.5. North America Ester Gum Market, by Type, 2016-2026
      6. 4.4.6. North America Ester Gum Market, by Application, 2016-2026
      7. 4.4.7. U.S.
      8. 4.4.8. Canada
    5. 4.5. Europe
      1. 4.5.1. Europe Ester Gum Market size and forecast, 2016-2026
      2. 4.5.2. Europe Ester Gum Market, by Country, 2018 - 2025 (USD Million)
      3. 4.5.3. Europe Market size and forecast, 2016-2026 (Kilo tons)
      4. 4.5.4. Europe Ester Gum Market, by Country, 2018 - 2025 (Kilo tons)
      5. 4.5.5. Europe Ester Gum Market, by Type, 2016-2026
      6. 4.5.6. Europe Ester Gum Market, by Application, 2016-2026
      7. 4.5.7. Germany
      8. 4.5.8. France
      9. 4.5.9. U.K.
      10. 4.5.10. Italy
      11. 4.5.11. Spain
      12. 4.5.12. Rest of Europe
    6. 4.6. Asia Pacific
      1. 4.6.1. Asia Pacific Ester Gum Market size and forecast, 2016-2026
      2. 4.6.2. Asia Pacific Ester Gum Market, by Country, 2018 - 2025 (USD Million)
      3. 4.6.3. Asia Pacific Market size and forecast, 2016-2026 (Kilo tons)
      4. 4.6.4. Asia Pacific Ester Gum Market, by Country, 2018 - 2025 (Kilo tons)
      5. 4.6.5. Asia Pacific Ester Gum Market, by Type, 2016-2026
      6. 4.6.6. Asia Pacific Ester Gum Market, by Application, 2016-2026
      7. 4.6.7. China
      8. 4.6.8. Japan
      9. 4.6.9. India
      10. 4.6.10. South Korea
      11. 4.6.11. South-East Asia
      12. 4.6.12. Rest of Asia Pacific
    7. 4.7. Latin America
      1. 4.7.1. Latin America Ester Gum Market size and forecast, 2016-2026
      2. 4.7.2. Latin America Ester Gum Market, by Country, 2018 - 2025 (USD Million)
      3. 4.7.3. Latin America Market size and forecast, 2016-2026 (Kilo tons)
      4. 4.7.4. Latin America Ester Gum Market, by Country, 2018 - 2025 (Kilo tons)
      5. 4.7.5. Latin America Ester Gum Market, by Type, 2016-2026
      6. 4.7.6. Latin America Ester Gum Market, by Application, 2016-2026
      7. 4.7.7. Brazil
      8. 4.7.8. Mexico
      9. 4.7.9. Rest of Latin America
    8. 4.8. The Middle-East and Africa
      1. 4.8.1. The Middle-East and Africa Ester Gum Market size and forecast, 2016-2026
      2. 4.8.2. The Middle-East and Africa Ester Gum Market, by Country, 2018 - 2025 (USD Million)
      3. 4.8.3. The Middle-East and Africa Market size and forecast, 2016-2026 (Kilo tons)
      4. 4.8.4. The Middle-East and Africa Ester Gum Market, by Country, 2018 - 2025 (Kilo tons)
      5. 4.8.5. The Middle-East and Africa Ester Gum Market, by Type, 2016-2026
      6. 4.8.6. The Middle-East and Africa Ester Gum Market, by Application, 2016-2026
      7. 4.8.7. GCC Countries
      8. 4.8.8. South Africa
      9. 4.8.9. Rest of Middle-East Africa
  5. CHAPTER 5. Ester Gum Production, Consumption, Export, Import by Regions
    1. 5.1. Global Ester Gum production and revenue, 2015-2025 (USD Million) (Kilo tons)
    2. 5.2. Global Import and Export Analysis, by Region
  6. CHAPTER 6. Ester Gum market – Competitive Landscape
    1. 6.1. Competitor Market Share – Revenue
    2. 6.2. Market Concentration Rate Analysis, Top 3 and Top 5 Players
    3. 6.3. Competitor Market Share – Volume
    4. 6.4. Strategic Development
      1. 6.4.1. Acquisitions and Mergers
      2. 6.4.2. New Products
      3. 6.4.3. Research & Development Activities
  7. CHAPTER 7. Company Profiles
    1. 7.1. Pinova Inc.
      1. 7.1.1. Company Overview
      2. 7.1.2. Pinova Inc. Sales, Revenue, Price, and Gross Margin
      3. 7.1.3. Product portfolio
      4. 7.1.4. Recent initiatives
    2. 7.2. Eastman Chemical Company
      1. 7.2.1. Company Overview
      2. 7.2.2. Eastman Chemical Company Sales, Revenue, Price, and Gross Margin
      3. 7.2.3. Product portfolio
      4. 7.2.4. Recent initiatives
    3. 7.3. Sood Paper & Allied Chemicals
      1. 7.3.1. Company Overview
      2. 7.3.2. Sood Paper & Allied Chemicals Sales, Revenue, Price, and Gross Margin
      3. 7.3.3. Product portfolio
      4. 7.3.4. Recent initiatives
    4. 7.4. Dev Resins
      1. 7.4.1. Company Overview
      2. 7.4.2. Dev Resins Sales, Revenue, Price, and Gross Margin
      3. 7.4.3. Product portfolio
      4. 7.4.4. Recent initiatives
    5. 7.5. Cardinal Chemicals Pvt. Ltd.
      1. 7.5.1. Company Overview
      2. 7.5.2. Cardinal Chemicals Pvt. Ltd. Sales, Revenue, Price, and Gross Margin
      3. 7.5.3. Product portfolio
      4. 7.5.4. Recent initiatives
    6. 7.6. Shree Resin
      1. 7.6.1. Company Overview
      2. 7.6.2. Shree Resin Sales, Revenue, Price, and Gross Margin
      3. 7.6.3. Product portfolio
      4. 7.6.4. Recent initiatives
    7. 7.7. Arakawa Chemical Industries Ltd.
      1. 7.7.1. Company Overview
      2. 7.7.2. Arakawa Chemical Industries Ltd. Sales, Revenue, Price, and Gross Margin
      3. 7.7.3. Product portfolio
      4. 7.7.4. Recent initiatives
    8. 7.8. Zhejiang Xinsong Resin Co.Ltd.
      1. 7.8.1. Company Overview
      2. 7.8.2. Zhejiang Xinsong Resin Co.Ltd. Sales, Revenue, Price, and Gross Margin
      3. 7.8.3. Product portfolio
      4. 7.8.4. Recent initiatives
    9. 7.9. Others
      1. 7.9.1. Company Overview
      2. 7.9.2. Others Sales, Revenue, Price, and Gross Margin
      3. 7.9.3. Product portfolio
      4. 7.9.4. Recent initiatives
  8. CHAPTER 8. Ester Gum — Industry Analysis
    1. 8.1. Introduction and Taxonomy
    2. 8.2. Ester Gum Market – Key Trends
      1. 8.2.1. Market Drivers
      2. 8.2.2. Market Restraints
      3. 8.2.3. Market Opportunities
    3. 8.3. Value Chain Analysis
    4. 8.4. Key Mandates and Regulations
    5. 8.5. Technology Roadmap and Timeline
    6. 8.6. Ester Gum market – Attractiveness Analysis
      1. 8.6.1. By Type
      2. 8.6.2. By Application
      3. 8.6.3. By Region
  9. CHAPTER 9. Raw Material analysis
    1. 9.1. Ester Gum Key Raw Material Analysis
      1. 9.1.1. Key Raw Materials
      2. 9.1.2. Price Trend of Key Raw Materials
    2. 9.2. Key Suppliers of Raw Materials
    3. 9.3. Proportion of Manufacturing Cost Structure
      1. 9.3.1. Raw Materials
      2. 9.3.2. Labor Cost
    4. 9.4. Manufacturing Expenses Analysis of Ester Gum
  10. CHAPTER 10. Industrial Chain, Sourcing Strategy and Downstream Buyers
    1. 10.1. Ester Gum Industrial Chain Analysis
    2. 10.2. Upstream Raw Materials Sourcing
      1. 10.2.1. Risk Mitigation:
      2. 10.2.2. Supplier Relationships:
      3. 10.2.3. Business Processes:
      4. 10.2.4. Securing the Product:
    3. 10.3. Raw Materials Sources of Ester Gum Major Manufacturers in 2016
    4. 10.4. Downstream Buyers
    5. 10.5. Distributors/Traders List
  11. CHAPTER 11. Marketing Strategy Analysis, Distributors
    1. 11.1. Marketing Channel
    2. 11.2. Direct Marketing
    3. 11.3. Indirect Marketing
    4. 11.4. Marketing Channel Development Trend
    5. 11.5. Economic/Political Environmental Change
  12. CHAPTER 12. Report Conclusion
  13. CHAPTER 13. Research Approach & Methodology
    1. 13.1. Report Description
    2. 13.2. Research Scope
    3. 13.3. Research Methodology
      1. 13.3.1. Secondary Research
      2. 13.3.2. Primary Research
      3. 13.3.3. Models

      List of Figures

      FIG. 1 Global Ester Gum Market, 2016-2026 (USD Million)
      FIG. 2 Global Ester Gum Market Share, by Type, 2019 & 2026 (USD Million)
      FIG. 3 Global Ester Gum Market share, by Type, 2019 & 2026 (Kilo tons)
      FIG. 4 Global PRGE Ester Gum Market, 2016-2026 (USD Million)
      FIG. 5 Global PRGE Ester Gum  Market, 2016-2026 (Kilo tons)
      FIG. 6 Global GEWR Ester Gum Market, 2016-2026 (USD Million)
      FIG. 7 Global GEWR Ester Gum  Market, 2016-2026 (Kilo tons)
      FIG. 8 Global P & FHGEGR Ester Gum Market, 2016-2026 (USD Million)
      FIG. 9 Global P & FHGEGR Ester Gum  Market, 2016-2026 (Kilo tons)
      FIG. 10 Global Penta Ester Gum Ester Gum Market, 2016-2026 (USD Million)
      FIG. 11 Global Penta Ester Gum Ester Gum  Market, 2016-2026 (Kilo tons)
      FIG. 12 Global Maleic adduct of Gum Rosin Ester Gum Market, 2016-2026 (USD Million)
      FIG. 13 Global Maleic adduct of Gum Rosin Ester Gum  Market, 2016-2026 (Kilo tons)
      FIG. 14 Global Glycerol Ester of Gum Rosin Modified with Maleic Anhydride Ester Gum Market, 2016-2026 (USD Million)
      FIG. 15 Global Glycerol Ester of Gum Rosin Modified with Maleic Anhydride Ester Gum  Market, 2016-2026 (Kilo tons)
      FIG. 16 Global Others Ester Gum Market, 2016-2026 (USD Million)
      FIG. 17 Global Others Ester Gum  Market, 2016-2026 (Kilo tons)
      FIG. 18 Global Ester Gum Market Share, by Application, 2019 & 2026 (USD Million)
      FIG. 19 Global Ester Gum Market share, by Application, 2019 & 2026 (Kilo tons)
      FIG. 20 Global Chewing Gum Ester Gum Market, 2016-2026 (USD Million)
      FIG. 21 Global Chewing Gum Ester Gum  Market, 2016-2026 (Kilo tons)
      FIG. 22 Global Inks Ester Gum Market, 2016-2026 (USD Million)
      FIG. 23 Global Inks Ester Gum  Market, 2016-2026 (Kilo tons)
      FIG. 24 Global Pharmaceuticals Ester Gum Market, 2016-2026 (USD Million)
      FIG. 25 Global Pharmaceuticals Ester Gum  Market, 2016-2026 (Kilo tons)
      FIG. 26 Global Cosmetics Ester Gum Market, 2016-2026 (USD Million)
      FIG. 27 Global Cosmetics Ester Gum  Market, 2016-2026 (Kilo tons)
      FIG. 28 Global Beverages Ester Gum Market, 2016-2026 (USD Million)
      FIG. 29 Global Beverages Ester Gum  Market, 2016-2026 (Kilo tons)
      FIG. 30 Global Paints & Coatings Ester Gum Market, 2016-2026 (USD Million)
      FIG. 31 Global Paints & Coatings Ester Gum  Market, 2016-2026 (Kilo tons)
      FIG. 32 Global Adhesives Ester Gum Market, 2016-2026 (USD Million)
      FIG. 33 Global Adhesives Ester Gum  Market, 2016-2026 (Kilo tons)
      FIG. 34 Global Other Ester Gum Market, 2016-2026 (USD Million)
      FIG. 35 Global Other Ester Gum  Market, 2016-2026 (Kilo tons)
      FIG. 36 Global Ester Gum Market Share, by Region, 2019 & 2026
      FIG. 37 Global Ester Gum Market Share, by Region, 2019 & 2026
      FIG. 38 North America Ester Gum Market, 2016-2026
      FIG. 39 North America Ester Gum  Market, 2016-2026 (Kilo tons)
      FIG. 40 U.S. Ester Gum Market, 2016-2026
      FIG. 41 U.S. Ester Gum  Market, 2016-2026 (Kilo tons)
      FIG. 42 Canada Ester Gum Market, 2016-2026
      FIG. 43 Canada Ester Gum  Market, 2016-2026 (Kilo tons)
      FIG. 44 Europe Ester Gum Market, 2016-2026
      FIG. 45 Europe Ester Gum  Market, 2016-2026 (Kilo tons)
      FIG. 46 Germany Ester Gum Market, 2016-2026
      FIG. 47 Germany Ester Gum  Market, 2016-2026 (Kilo tons)
      FIG. 48 France Ester Gum Market, 2016-2026
      FIG. 49 France Ester Gum  Market, 2016-2026 (Kilo tons)
      FIG. 50 U.K. Ester Gum Market, 2016-2026
      FIG. 51 U.K. Ester Gum  Market, 2016-2026 (Kilo tons)
      FIG. 52 Italy Ester Gum Market, 2016-2026
      FIG. 53 Italy Ester Gum  Market, 2016-2026 (Kilo tons)
      FIG. 54 Spain Ester Gum Market, 2016-2026
      FIG. 55 Spain Ester Gum  Market, 2016-2026 (Kilo tons)
      FIG. 56 Rest of Europe Ester Gum Market, 2016-2026
      FIG. 57 Rest of Europe Ester Gum  Market, 2016-2026 (Kilo tons)
      FIG. 58 Asia Pacific Ester Gum Market, 2016-2026
      FIG. 59 Asia Pacific Ester Gum  Market, 2016-2026 (Kilo tons)
      FIG. 60 China Ester Gum Market, 2016-2026
      FIG. 61 China Ester Gum  Market, 2016-2026 (Kilo tons)
      FIG. 62 Japan Ester Gum Market, 2016-2026
      FIG. 63 Japan Ester Gum  Market, 2016-2026 (Kilo tons)
      FIG. 64 India Ester Gum Market, 2016-2026
      FIG. 65 India Ester Gum  Market, 2016-2026 (Kilo tons)
      FIG. 66 South  Korea Ester Gum Market, 2016-2026
      FIG. 67 South  Korea Ester Gum  Market, 2016-2026 (Kilo tons)
      FIG. 68 South-East Asia Ester Gum Market, 2016-2026
      FIG. 69 South-East Asia Ester Gum  Market, 2016-2026 (Kilo tons)
      FIG. 70 Rest of Asia Pacific Ester Gum Market, 2016-2026
      FIG. 71 Rest of Asia Pacific Ester Gum  Market, 2016-2026 (Kilo tons)
      FIG. 72 Latin America Ester Gum Market, 2016-2026
      FIG. 73 Latin America Ester Gum  Market, 2016-2026 (Kilo tons)
      FIG. 74 Brazil Ester Gum Market, 2016-2026
      FIG. 75 Brazil Ester Gum  Market, 2016-2026 (Kilo tons)
      FIG. 76 Mexico Ester Gum Market, 2016-2026
      FIG. 77 Mexico Ester Gum  Market, 2016-2026 (Kilo tons)
      FIG. 78 Rest of Latin America Ester Gum Market, 2016-2026
      FIG. 79 Rest of Latin America Ester Gum  Market, 2016-2026 (Kilo tons)
      FIG. 80 The Middle-East and Africa Ester Gum Market, 2016-2026
      FIG. 81 The Middle-East and Africa Ester Gum  Market, 2016-2026 (Kilo tons)
      FIG. 82 GCC Countries Ester Gum Market, 2016-2026
      FIG. 83 GCC Countries Ester Gum  Market, 2016-2026 (Kilo tons)
      FIG. 84 South Africa Ester Gum Market, 2016-2026
      FIG. 85 South Africa Ester Gum  Market, 2016-2026 (Kilo tons)
      FIG. 86 Rest of Middle-East Africa Ester Gum Market, 2016-2026
      FIG. 87 Rest of Middle-East Africa Ester Gum  Market, 2016-2026 (Kilo tons)
      FIG. 88 Global Ester Gum production and revenue, 2015-2025 (USD Million) (Kilo tons)
      FIG. 89 North America Ester Gum production and revenue, 2015-2025 (USD Million) (Kilo tons)
      FIG. 90 Europe Ester Gum production and revenue, 2015-2025 (USD Million) (Kilo tons)
      FIG. 91 Asia Pacific Ester Gum production and revenue, 2015-2025 (USD Million) (Kilo tons)
      FIG. 92 Latin America Ester Gum production and revenue, 2015-2025 (USD Million) (Kilo tons)
      FIG. 93 Middle East and Africa Ester Gum production and revenue, 2015-2025 (USD Million) (Kilo tons)
      FIG. 94 Competitor Market Share – Revenue
      FIG. 95 Competitor Market Share – Volume
      FIG. 96 Pinova Inc. Revenue and Growth Rate
      FIG. 97 Pinova Inc. Market Share
      FIG. 98 Eastman Chemical Company Revenue and Growth Rate
      FIG. 99 Eastman Chemical Company Market Share
      FIG. 100 Sood Paper & Allied Chemicals Revenue and Growth Rate
      FIG. 101 Sood Paper & Allied Chemicals Market Share
      FIG. 102 Dev Resins Revenue and Growth Rate
      FIG. 103 Dev Resins Market Share
      FIG. 104 Cardinal Chemicals Pvt. Ltd. Revenue and Growth Rate
      FIG. 105 Cardinal Chemicals Pvt. Ltd. Market Share
      FIG. 106 Shree Resin Revenue and Growth Rate
      FIG. 107 Shree Resin Market Share
      FIG. 108 Arakawa Chemical Industries Ltd. Revenue and Growth Rate
      FIG. 109 Arakawa Chemical Industries Ltd. Market Share
      FIG. 110 Zhejiang Xinsong Resin Co.Ltd. Revenue and Growth Rate
      FIG. 111 Zhejiang Xinsong Resin Co.Ltd. Market Share
      FIG. 112 Others Revenue and Growth Rate
      FIG. 113 Others Market Share
      FIG. 114 Market Dynamics
      FIG. 115 Global Ester Gum – Value Chain Analysis
      FIG. 116 Key Mandates and Regulations
      FIG. 117 Technology Roadmap and Timeline
      FIG. 118 Market Attractiveness Analysis – By Type
      FIG. 119 Market Attractiveness Analysis – By Application
      FIG. 120 Market Attractiveness Analysis – By Region
      FIG. 121 Manufacturing Cost Structure of Ester Gum
      FIG. 122 Ester Gum Industrial Chain Analysis
      FIG. 123 Market Channel
      FIG. 124 Marketing Channel Development Trend
      FIG. 125 Growth in World Gross Product, 2008-2018
      

      List of Tables

      TABLE 1 Global Ester Gum market, 2019 & 2026 (USD Million)
      TABLE 2 Global Ester Gum market, by Type, 2016-2026 (USD Million)
      TABLE 3 Global Ester Gum market, by Type, 2016-2026 (Kilo tons)
      TABLE 4 Global Ester Gum market, by Application, 2016-2026 (USD Million)
      TABLE 5 Global Ester Gum market, by Application, 2016-2026 (Kilo tons)
      TABLE 6 Global Ester Gum market, by region, 2016-2026 (USD Million)
      TABLE 7 Global Ester Gum market, by region, 2016-2026 (Kilo tons)
      TABLE 8 North America Ester Gum Market, by Type, 2016-2026 (USD Million)
      TABLE 9 North America Ester Gum Market, by Type, 2016-2026 (Kilo tons)
      TABLE 10 North America Ester Gum Market, by Application, 2016-2026 (USD Million)
      TABLE 11 North America Ester Gum Market, by Application, 2016-2026 (Kilo tons)
      TABLE 12 Europe Ester Gum Market, by Type, 2016-2026 (USD Million)
      TABLE 13 Europe Ester Gum Market, by Type, 2016-2026 (Kilo tons)
      TABLE 14 Europe Ester Gum Market, by Application, 2016-2026 (USD Million)
      TABLE 15 Europe Ester Gum Market, by Application, 2016-2026 (Kilo tons)
      TABLE 16 Asia Pacific Ester Gum Market, by Type, 2016-2026 (USD Million)
      TABLE 17 Asia Pacific Ester Gum Market, by Type, 2016-2026 (Kilo tons)
      TABLE 18 Asia Pacific Ester Gum Market, by Application, 2016-2026 (USD Million)
      TABLE 19 Asia Pacific Ester Gum Market, by Application, 2016-2026 (Kilo tons)
      TABLE 20 Latin America Ester Gum Market, by Type, 2016-2026 (USD Million)
      TABLE 21 Latin America Ester Gum Market, by Type, 2016-2026 (Kilo tons)
      TABLE 22 Latin America Ester Gum Market, by Application, 2016-2026 (USD Million)
      TABLE 23 Latin America Ester Gum Market, by Application, 2016-2026 (Kilo tons)
      TABLE 24 The Middle-East and Africa Ester Gum Market, by Type, 2016-2026 (USD Million)
      TABLE 25 The Middle-East and Africa Ester Gum Market, by Type, 2016-2026 (Kilo tons)
      TABLE 26 The Middle-East and Africa Ester Gum Market, by Application, 2016-2026 (USD Million)
      TABLE 27 The Middle-East and Africa Ester Gum Market, by Application, 2016-2026 (Kilo tons)
      TABLE 28 North America Ester Gum Production, Consumption, Export, Import, 2016-2019
      TABLE 29 Europe Ester Gum Production, Consumption, Export, Import, 2016-2019
      TABLE 30 Asia Pacific Ester Gum Production, Consumption, Export, Import, 2016-2019
      TABLE 31 Latin America Ester Gum Production, Consumption, Export, Import, 2016-2019
      TABLE 32 Middle East & Africa Ester Gum Production, Consumption, Export, Import, 2016-2019
      TABLE 33 Global Ester Gum Market - Company Revenue Analysis 2016-2019 (USD Million)
      TABLE 34 Global Ester Gum Market - Company Revenue Share Analysis 2016-2019(%)
      TABLE 35 Global Ester Gum Market - Company Volume Analysis 2016-2019 (Kilo tons)
      TABLE 36 Global Ester Gum Market - Company Volume Share Analysis 2016-2019(%)
      TABLE 37 Acquisitions and Mergers
      TABLE 38 New Product/Service Launch
      TABLE 39 Research & Development Activities
      TABLE 40 Market Drivers
      TABLE 41 Market Restraints
      TABLE 42 Market Opportunities
      TABLE 43 Production Base and Market Concentration Rate of Raw Material
      TABLE 44 Key Suppliers of Raw Materials
      TABLE 45 Raw Materials Sources of Ester Gum Major Manufacturers in 2016
      TABLE 46 Major Buyers of Ester Gum
      TABLE 47 Distributors/Traders of Ester Gum by Region
      

Industry Major Market Players

  •  Pinova Inc.
  •  Eastman Chemical Company
  •  Sood Paper & Allied Chemicals
  •  Dev Resins
  •  Cardinal Chemicals Pvt. Ltd.
  •  Shree Resin
  •  Arakawa Chemical Industries Ltd.
  •  Zhejiang Xinsong Resin Co.Ltd.