Search Market Research Report
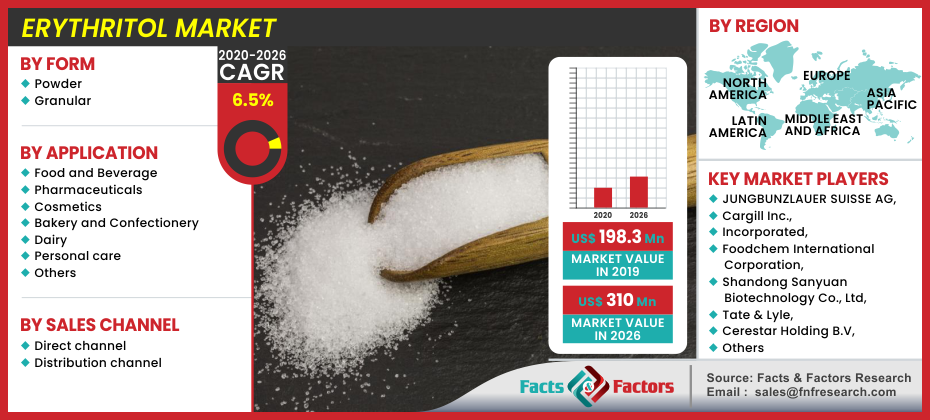
Discover Our Latest Reports
Discover Our Featured Reports
Discover Top Selling Reports

Global Erythritol Market Size, Share, Growth Report 2030

report img

Erythritol Market By Form (Powder and Granular), By Application (Food and Beverage, Pharmaceuticals, Cosmetics, Bakery and Confectionery, Dairy, Personal care, and Others), By Sales Channel (Direct channel and Distribution channel): Global Industry Perspective, Comprehensive Analysis, and Forecast, 2020 – 2026

Industry Insights

[195+ Pages Report] The global erythritol market is set for rapid growth over the forecast period. As per Facts and Factors market research analysis, in terms of revenue, the global erythritol market accounted for USD 198.3 Million in 2019 and is expected to reach USD 310 Million by 2026, growing at a CAGR of 6.5%.

logoErythritol Market: Overview

Erythritol is a type of carbohydrate known as a sugar alcohol, and it is a unique form of other sugar alcohols because it contains zero calories. It is quite similar to sugar in terms of look and taste but has almost negligible calories. It is widely used in the food and beverage industry as a sweetener. Besides, erythritol is promoted as a perfect natural zero-calorie sweetener, which is tooth-friendly offering no effect on blood sugar levels, and also well-tolerated in the digestive system. Erythritol is obtained through the reduction of sugar with the aid of hydrogen and also it can be obtained from the fermentation of carbohydrates. It is naturally occurring in some fruits and fermented foods such as wine, beer, soy sauce, and many more, while the manufacturer adds an industrially fermented version to sugar-free and low sugar food & drink options.

Glucose erythritol is manufactured through enzymatic hydrolysis of starch. It is available mostly in granular and powder form that make it congenial with various end industries like confectionery, pharmaceuticals, and food & beverage. In addition, the powder form is most preferable for use because the granulated form tends to stay grainy unless and until dissolved in water. Due to its non-hygroscopic character, it flows easily and it is around 70% as sweet as sucrose. In 2016 Cargill accounted for the largest producer of Erythritol, accounting for almost 76.74% of output. Due to its high digestive tolerance erythritol makes differs from other polyols. The safety of erythritol has been confirmed by various health authorities all over the world which includes World Health Organization(WHO), and the U.S. Food and Drug Administration. Moreover, erythritol contained zero-kcal/g  is generally recognized as safe. Erythritol is also used in the pharmaceutical industry as a flavoring agent to enhancing the taste of medicine. Also, erythritol contributes to oral health & other personal products as it does not affect blood glucose or insulin secretion.

Erythritol Market

To know more about this report | Request Free Sample Copy

logoImpact of COVID-19 Pandemic

On the global economy the  COVID-19 can affect in three main ways: By creating supply chain and market disruption, by its financial impact on financial markets and on firms, and by straightly affecting demand and production.

logoIndustry Growth Factors

The population of health-conscious consumers is growing day by day as consumers are now vigilant to the food product they consume. Nowadays most of the food which we consume has a direct relationship with life-threatening diseases such as diabetes, obesity, cardiovascular disease, and many more. Overconsumption of high-calorie food or sugar may cause diseases like diabetes which is dangerous to health.

Erythritol market is expanding at a rapid pace due to its benefits such as finer digestive tolerance than sucrose at the same value, and its consumption does not cause tooth decay. In the last five years, the demand for sweeteners has substantially increased globally and this trend is projected to continue at least for the next five years. In emerging countries changing lifestyles and increasing health consciousness of consumers will drive the significant market. Shifts from traditional sugar products and changing consumer perception of nutrition are expected to trigger the erythritol industry prospect.

Furthermore, in the cosmetic industry, the increasing demand for natural and high-quality ingredient propel the market growth. In skincare products, erythritol plays an important role because of its enhancing moisture retention property. In addition, due to its effective performance against wrinkle formation erythritol is used to produce night creams and anti-aging serums. These properties are among the strong forces anticipated to ease the industry's growth over the projected period. By offering a diverse portfolio of erythritol products market players are speedily investing in R&D to capitalize on emerging health trends in the market. For manufacturing low glycemic index and low calorie based sweeteners erythritol is widely used that aid in weight reduction and boosting metabolic rate without triggering vital like cholesterol & insulin. To gain a unique selling point in the market the industry players are developing novel techniques to extract pure erythritol powder is probable to augment the market share.

Erythritol is 60-70% sweet as table sugar and almost non-caloric due to this market is gaining strength. The erythritol glycemic index is zero and it does not cause any tooth decay. However, the erythritol absorbed in the small intestine and then for the most part egest unchanged in the urine and therefore does not cause gastric side effects like other sugar alcohol which is likely to drive the market demand. Due to health awareness and the growth of global consumption level is expected to continue increasing the demand for erythritol over the forecast period.

The major challenge for the erythritol market is the presence of substitutes like stevia. Erythritol may have adverse effects on the gastrointestinal system due to over intake. Because of no major restrains, and the manufacturer operating in the industry necessary to check the permissible limit of using erythritol in products may hinder the market growth. Due to the ease of availability of substitutes the market growth is expected to the hampered. The price of erythritol has decreased in the past few years but it increased in 2017 and it is expected that the price will slightly increase in near future. 

logoErythritol Market: Segmentation

Erythritol is popular in the food and beverage industry due to its various benefits. By application, the erythritol market is classified into the personal care industry, food and beverage industry, pharmaceutical industry, and among others (which includes animal/agriculture feed). Erythritol is mainly used as a protective agent in confectioneries and sweeteners and as an additive in low-calorie diet food in the food industry. On the other hand, to augment the taste of medicine erythritol is used as a flavoring agent in the pharmaceutical industry. In personal care, erythritol can be used in oral care and many other products and also it is used as preservatives to inhibit bacteria. By form, the erythritol market is classified into powder foam and granular form.

Due to the increasing demand for healthy sweeteners made from natural ingredients the powder-based erythritol industry held the largest share in 2019 and projected to register over 6.5% gain during the forecast period 2026. To serve a quality product to the consumers the food and beverage industry puts various efforts as a result the erythritol market has been expanding. The consumer prefers low-calorie food and erythritol helps in maintaining these standards in food and beverages. Due to cheaper rates in the sugar market and the rising demand for cheap artificial sugar, granular erythritol is set to be a rapidly growing segment. During the forecast period, 2020-2026 granular erythritol is projected to register the highest CAGR.

logoReport Scope

Report Attribute

Details

Market Size in 2019

USD 198.3 Million

Projected Market Size in 2026

USD 310 Million

CAGR Growth Rate

6.5% CAGR

Base Year

2019

Forecast Years

2020-2026

Key Market Players

JUNGBUNZLAUER SUISSE AG, Cargill Inc., Incorporated, Foodchem International Corporation, & Shandong Sanyuan Biotechnology Co., Ltd, Tate & Lyle, Cerestar Holding B.V, Unterhofer & Partner KG/ZeroCal, Zhucheng Dongxiao Biotechnology, Baolingbao Biology, Nikken-Chemical, Futaste and Ingredientstech, Jungbunzlauer, Zibo ZhongShi GeRui Biotech, and Others

Key Segment

By Form, Application, Sales, and Region

Major Regions Covered

North America, Europe, Asia Pacific, Latin America, and the Middle East & Africa

Purchase Options

Request customized purchase options to meet your research needs.Explore purchase options

logoErythritol Market: Regional Analysis

By geography, the erythritol market is segmented into North America, Europe, Latin America, Asia Pacific, and the Middle East and Africa. In America, Japan, and Western Europe erythritol is widely used. The market for erythritol in the Asia Pacific is projected to exhibit growth at the highest pace during the forecast period. The use of erythritol in soft drinks at a maximum concentration of 1.6%, the European Food and Safety Authority has approved this. In North America, raising awareness of naturally derived disjunctive sweeteners can boost the market share. In 2016, the United States of America accounted for more than 76.74% of global erythritol output. Moreover, China ranked in the second position with 16.37% of the share. By region, due to increasing demand for low-calorie products and natural products North America is projected to the largest global erythritol market. In terms of market revenue and volume in North America, the United States is the main contributor. Besides, increasing demand for natural ingredients in the cosmetic industry owing to this Europe is the second-largest erythritol market. Moreover, Asia Pacific is the fastest growing erythritol market because of the increasing population of health-conscious consumers. In the US highest number of people are suffering from diabetes, this is also been a driver of demand within the market.

logoErythritol Market: Competitive Players

  • JUNGBUNZLAUER SUISSE AG
  • Cargill Inc.
  • Incorporated
  • Foodchem International Corporation & Shandong Sanyuan Biotechnology Co. Ltd
  • Tate & Lyle
  • Cerestar Holding B.V
  • Unterhofer & Partner KG/ZeroCal
  • Zhucheng Dongxiao Biotechnology
  • Baolingbao Biology
  • Nikken-Chemical
  • Futaste and Ingredientstech
  • Jungbunzlauer
  • Zibo ZhongShi GeRui Biotech

logoErythritol Market:  Form Segment Analysis

  • Powder
  • Granular

logoErythritol Market: Application Segment Analysis

  • Food and Beverage
  • Pharmaceuticals
  • Cosmetics
  • Bakery and Confectionery
  • Dairy
  • Personal care
  • Others

logoErythritol Market: Sales Channel Segment Analysis

  • Direct channel
  • Distribution channel

logoErythritol Market: Regional Segment Analysis

  • North America
  •  The U.S
  • Canada
  • Europe
  • France
  • The UK
  • Spain
  • Germany
  • Italy
  • Rest of Europe
  • Asia Pacific
  • China
  • Japan
  • India
  • South Korea
  • Southeast Asia
  • Rest of Asia Pacific
  • Latin America
  • Brazil
  • Mexico
  • Rest of Latin America
  • Middle East & Africa
  • GCC
  • South Africa
  • Rest of Middle East & Africa

Table of Content

  1. Chapter 1 Executive Summary
    1. 1.1. Introduction of Erythritol
    2. 1.2. Global Erythritol Market, 2019 & 2026 (USD Million)
    3. 1.3. COVID-19 Impacts on Erythritol Market
      1. 1.3.1. Short Term COVID-19 Impact on the Market
      2. 1.3.2. Mid-Term COVID-19 Impact on the Market
      3. 1.3.3. Long-Term COVID-19 Impact on the Market
    4. 1.4. Business Strategies and Recommendations
    5. 1.5. Global Erythritol Market, 2016 – 2026 (USD Million)
    6. 1.6. Global Erythritol Market Absolute Revenue Opportunity, 2016 – 2026 (USD Million)
    7. 1.7. Global Erythritol Market Incremental Revenue Opportunity, 2020 – 2026 (USD Million)
  2. Chapter 2 Erythritol Market – Form Analysis
    1. 2.1. Global Erythritol Market – Form Overview
    2. 2.2. Global Erythritol Market Share, by Form, 2019 & 2026 (USD Million)
    3. 2.3. Powder
      1. 2.3.1. Global Powder Erythritol Market, 2016 – 2026 (USD Million)
    4. 2.4. Granular
      1. 2.4.1. Global Granular Erythritol Market, 2016 – 2026 (USD Million)
  3. Chapter 3 Erythritol Market – Application Analysis
    1. 3.1. Global Erythritol Market – Application Overview
    2. 3.2. Global Erythritol Market Share, by Application, 2019 & 2026 (USD Million)
    3. 3.3. Food and Beverage
      1. 3.3.1. Global Food and Beverage Erythritol Market, 2016 – 2026 (USD Million)
    4. 3.4. Pharmaceuticals
      1. 3.4.1. Global Pharmaceuticals Erythritol Market, 2016 – 2026 (USD Million)
    5. 3.5. Cosmetics
      1. 3.5.1. Global Cosmetics Erythritol Market, 2016 – 2026 (USD Million)
    6. 3.6. Bakery and Confectionery
      1. 3.6.1. Global Bakery and Confectionery Erythritol Market, 2016 – 2026 (USD Million)
    7. 3.7. Dairy
      1. 3.7.1. Global Dairy Erythritol Market, 2016 – 2026 (USD Million)
    8. 3.8. Personal care
      1. 3.8.1. Global Personal care Erythritol Market, 2016 – 2026 (USD Million)
    9. 3.9. Others
      1. 3.9.1. Global Others Erythritol Market, 2016 – 2026 (USD Million)
  4. Chapter 4 Erythritol Market – Sales Channel Analysis
    1. 4.1. Global Erythritol Market – Sales Channel Overview
    2. 4.2. Global Erythritol Market Share, by Sales Channel, 2019 & 2026 (USD Million)
    3. 4.3. Direct channel
      1. 4.3.1. Global Direct channel Erythritol Market, 2016 – 2026 (USD Million)
    4. 4.4. Distribution channel
      1. 4.4.1. Global Distribution channel Erythritol Market, 2016 – 2026 (USD Million)
  5. Chapter 5 Erythritol Market – Regional Analysis
    1. 5.1. Global Erythritol Market Regional Overview
    2. 5.2. Global Erythritol Market Share, by Region, 2019 & 2026 (USD Million)
    3. 5.3. North America
      1. 5.3.1. North America Erythritol Market, 2016 – 2026 (USD Million)
      2. 5.3.2. North America Erythritol Market, by Form, 2016 – 2026
      3. 5.3.3. North America Erythritol Market, by Application, 2016 – 2026
      4. 5.3.4. North America Erythritol Market, by Sales Channel, 2016 – 2026
      5. 5.3.5. U.S.
      6. 5.3.6. Canada
    4. 5.4. Europe
      1. 5.4.1. Europe Erythritol Market, 2016 – 2026 (USD Million)
      2. 5.4.2. Europe Erythritol Market, by Form, 2016 – 2026
      3. 5.4.3. Europe Erythritol Market, by Application, 2016 – 2026
      4. 5.4.4. Europe Erythritol Market, by Sales Channel, 2016 – 2026
      5. 5.4.5. Germany
      6. 5.4.6. France
      7. 5.4.7. U.K.
      8. 5.4.8. Italy
      9. 5.4.9. Spain
      10. 5.4.10. Rest of Europe
    5. 5.5. Asia Pacific
      1. 5.5.1. Asia Pacific Erythritol Market, 2016 – 2026 (USD Million)
      2. 5.5.2. Asia Pacific Erythritol Market, by Form, 2016 – 2026
      3. 5.5.3. Asia Pacific Erythritol Market, by Application, 2016 – 2026
      4. 5.5.4. Asia Pacific Erythritol Market, by Sales Channel, 2016 – 2026
      5. 5.5.5. China
      6. 5.5.6. Japan
      7. 5.5.7. India
      8. 5.5.8. South Korea
      9. 5.5.9. South-East Asia
      10. 5.5.10. Rest of Asia Pacific
    6. 5.6. Latin America
      1. 5.6.1. Latin America Erythritol Market, 2016 – 2026 (USD Million)
      2. 5.6.2. Latin America Erythritol Market, by Form, 2016 – 2026
      3. 5.6.3. Latin America Erythritol Market, by Application, 2016 – 2026
      4. 5.6.4. Latin America Erythritol Market, by Sales Channel, 2016 – 2026
      5. 5.6.5. Brazil
      6. 5.6.6. Mexico
      7. 5.6.7. Rest of Latin America
    7. 5.7. The Middle-East and Africa
      1. 5.7.1. The Middle-East and Africa Erythritol Market, 2016 – 2026 (USD Million)
      2. 5.7.2. The Middle-East and Africa Erythritol Market, by Form, 2016 – 2026
      3. 5.7.3. The Middle-East and Africa Erythritol Market, by Application, 2016 – 2026
      4. 5.7.4. The Middle-East and Africa Erythritol Market, by Sales Channel, 2016 – 2026
      5. 5.7.5. GCC Countries
      6. 5.7.6. South Africa
      7. 5.7.7. Rest of Middle-East Africa
  6. Chapter 6 Erythritol Market – Competitive Landscape
    1. 6.1. Competitor Market Share – Revenue
    2. 6.2. Market Concentration Rate Analysis, Top 3 and Top 5 Players
    3. 6.3. Strategic Developments
      1. 6.3.1. Acquisitions and Mergers
      2. 6.3.2. New Products
      3. 6.3.3. Research & Development Activities
  7. Chapter 7 Company Profiles
    1. 7.1. JUNGBUNZLAUER SUISSE AG
      1. 7.1.1. Company Overview
      2. 7.1.2. Product/Service Portfolio
      3. 7.1.3. JUNGBUNZLAUER SUISSE AG Sales, Revenue, and Gross Margin
      4. 7.1.4. JUNGBUNZLAUER SUISSE AG Revenue and Growth Rate
      5. 7.1.5. JUNGBUNZLAUER SUISSE AG Market Share
      6. 7.1.6. Recent Initiatives, Funding/VC Activities, and Technological Innovations
    2. 7.2. Cargill Inc
      1. 7.2.1. Company Overview
      2. 7.2.2. Product/Service Portfolio
      3. 7.2.3. Cargill Inc Sales, Revenue, and Gross Margin
      4. 7.2.4. Cargill Inc Revenue and Growth Rate
      5. 7.2.5. Cargill Inc Market Share
      6. 7.2.6. Recent Initiatives, Funding/VC Activities, and Technological Innovations
    3. 7.3. Incorporated
      1. 7.3.1. Company Overview
      2. 7.3.2. Product/Service Portfolio
      3. 7.3.3. Incorporated Sales, Revenue, and Gross Margin
      4. 7.3.4. Incorporated Revenue and Growth Rate
      5. 7.3.5. Incorporated Market Share
      6. 7.3.6. Recent Initiatives, Funding/VC Activities, and Technological Innovations
    4. 7.4. Foodchem International Corporation
      1. 7.4.1. Company Overview
      2. 7.4.2. Product/Service Portfolio
      3. 7.4.3. Foodchem International Corporation Sales, Revenue, and Gross Margin
      4. 7.4.4. Foodchem International Corporation Revenue and Growth Rate
      5. 7.4.5. Foodchem International Corporation Market Share
      6. 7.4.6. Recent Initiatives, Funding/VC Activities, and Technological Innovations
    5. 7.5. Shandong Sanyuan Biotechnology Co., Ltd
      1. 7.5.1. Company Overview
      2. 7.5.2. Product/Service Portfolio
      3. 7.5.3. Shandong Sanyuan Biotechnology Co., Ltd Sales, Revenue, and Gross Margin
      4. 7.5.4. Shandong Sanyuan Biotechnology Co., Ltd Revenue and Growth Rate
      5. 7.5.5. Shandong Sanyuan Biotechnology Co., Ltd Market Share
      6. 7.5.6. Recent Initiatives, Funding/VC Activities, and Technological Innovations
    6. 7.6. Tate & Lyle
      1. 7.6.1. Company Overview
      2. 7.6.2. Product/Service Portfolio
      3. 7.6.3. Tate & Lyle Sales, Revenue, and Gross Margin
      4. 7.6.4. Tate & Lyle Revenue and Growth Rate
      5. 7.6.5. Tate & Lyle Market Share
      6. 7.6.6. Recent Initiatives, Funding/VC Activities, and Technological Innovations
    7. 7.7. Cerestar Holding B.V
      1. 7.7.1. Company Overview
      2. 7.7.2. Product/Service Portfolio
      3. 7.7.3. Cerestar Holding B.V Sales, Revenue, and Gross Margin
      4. 7.7.4. Cerestar Holding B.V Revenue and Growth Rate
      5. 7.7.5. Cerestar Holding B.V Market Share
      6. 7.7.6. Recent Initiatives, Funding/VC Activities, and Technological Innovations
    8. 7.8. Unterhofer & Partner KG/ZeroCal
      1. 7.8.1. Company Overview
      2. 7.8.2. Product/Service Portfolio
      3. 7.8.3. Unterhofer & Partner KG/ZeroCal Sales, Revenue, and Gross Margin
      4. 7.8.4. Unterhofer & Partner KG/ZeroCal Revenue and Growth Rate
      5. 7.8.5. Unterhofer & Partner KG/ZeroCal Market Share
      6. 7.8.6. Recent Initiatives, Funding/VC Activities, and Technological Innovations
    9. 7.9. Zhucheng Dongxiao Biotechnology
      1. 7.9.1. Company Overview
      2. 7.9.2. Product/Service Portfolio
      3. 7.9.3. Zhucheng Dongxiao Biotechnology Sales, Revenue, and Gross Margin
      4. 7.9.4. Zhucheng Dongxiao Biotechnology Revenue and Growth Rate
      5. 7.9.5. Zhucheng Dongxiao Biotechnology Market Share
      6. 7.9.6. Recent Initiatives, Funding/VC Activities, and Technological Innovations
    10. 7.10. Baolingbao Biology
      1. 7.10.1. Company Overview
      2. 7.10.2. Product/Service Portfolio
      3. 7.10.3. Baolingbao Biology Sales, Revenue, and Gross Margin
      4. 7.10.4. Baolingbao Biology Revenue and Growth Rate
      5. 7.10.5. Baolingbao Biology Market Share
      6. 7.10.6. Recent Initiatives, Funding/VC Activities, and Technological Innovations
    11. 7.11. Nikken-Chemical
      1. 7.11.1. Company Overview
      2. 7.11.2. Product/Service Portfolio
      3. 7.11.3. Nikken-Chemical Sales, Revenue, and Gross Margin
      4. 7.11.4. Nikken-Chemical Revenue and Growth Rate
      5. 7.11.5. Nikken-Chemical Market Share
      6. 7.11.6. Recent Initiatives, Funding/VC Activities, and Technological Innovations
    12. 7.12. Futaste and Ingredientstech
      1. 7.12.1. Company Overview
      2. 7.12.2. Product/Service Portfolio
      3. 7.12.3. Futaste and Ingredientstech Sales, Revenue, and Gross Margin
      4. 7.12.4. Futaste and Ingredientstech Revenue and Growth Rate
      5. 7.12.5. Futaste and Ingredientstech Market Share
      6. 7.12.6. Recent Initiatives, Funding/VC Activities, and Technological Innovations
    13. 7.13. Jungbunzlauer
      1. 7.13.1. Company Overview
      2. 7.13.2. Product/Service Portfolio
      3. 7.13.3. Jungbunzlauer Sales, Revenue, and Gross Margin
      4. 7.13.4. Jungbunzlauer Revenue and Growth Rate
      5. 7.13.5. Jungbunzlauer Market Share
      6. 7.13.6. Recent Initiatives, Funding/VC Activities, and Technological Innovations
    14. 7.14. Zibo ZhongShi GeRui Biotech
      1. 7.14.1. Company Overview
      2. 7.14.2. Product/Service Portfolio
      3. 7.14.3. Zibo ZhongShi GeRui Biotech Sales, Revenue, and Gross Margin
      4. 7.14.4. Zibo ZhongShi GeRui Biotech Revenue and Growth Rate
      5. 7.14.5. Zibo ZhongShi GeRui Biotech Market Share
      6. 7.14.6. Recent Initiatives, Funding/VC Activities, and Technological Innovations
  8. Chapter 8 Erythritol — Industry Analysis
    1. 8.1. Introduction and Taxonomy
    2. 8.2. Erythritol Market – Key Trends
      1. 8.2.1. Market Drivers
      2. 8.2.2. Market Restraints
      3. 8.2.3. Market Opportunities
    3. 8.3. Value Chain Analysis
    4. 8.4. Key Mandates and Regulations
    5. 8.5. Technology Roadmap and Timeline
    6. 8.6. Erythritol Market – Attractiveness Analysis
      1. 8.6.1. By Form
      2. 8.6.2. By Application
      3. 8.6.3. By Sales Channel
      4. 8.6.4. By Region
  9. Chapter 9 Industrial Chain, Sourcing Strategy, and Downstream Buyers
    1. 9.1. Erythritol Industrial Chain Analysis
    2. 9.2. Downstream Buyers
    3. 9.3. Distributors/Traders List
  10. Chapter 10 Marketing Strategy Analysis
    1. 10.1. Marketing Channel
    2. 10.2. Direct Marketing
    3. 10.3. Indirect Marketing
    4. 10.4. Marketing Channel Development Trends
    5. 10.5. Economic/Political Environmental Change
  11. Chapter 11 Report Conclusion & Key Insights
    1. 11.1. Key Insights from Primary Interviews & Surveys Respondents
    2. 11.2. Key Takeaways from Analysts, Consultants, and Industry Leaders
  12. Chapter 12 Research Approach & Methodology
    1. 12.1. Report Description
    2. 12.2. Research Scope
    3. 12.3. Research Methodology
      1. 12.3.1. Secondary Research
      2. 12.3.2. Primary Research
      3. 12.3.3. Statistical Models
      4. 12.3.4. Research Limitations

      List of Figures

      Fig.1	Product Picture of Erythritol
      Fig.2	COVID-19 Impacts on Erythritol Market
      Fig.3	Business Strategies and Recommendations
      Fig.4	Global Erythritol Market, 2016 – 2026 (USD Million)
      Fig.5	Global Erythritol Market Absolute Revenue Opportunity, 2016 – 2026 (USD Million)
      Fig.6	Global Erythritol Market Incremental Revenue Opportunity, 2020 – 2026 (USD Million)
      Fig.7	Global Erythritol Market Share, by Form, 2019 & 2026 (USD Million)
      Fig.8	Global Powder Erythritol Market, 2016 – 2026 (USD Million)
      Fig.9	Global Granular Erythritol Market, 2016 – 2026 (USD Million)
      Fig.10	Global Erythritol Market Share, by Application, 2019 & 2026 (USD Million)
      Fig.11	Global Food and Beverage Erythritol Market, 2016 – 2026 (USD Million)
      Fig.12	Global Pharmaceuticals Erythritol Market, 2016 – 2026 (USD Million)
      Fig.13	Global Cosmetics Erythritol Market, 2016 – 2026 (USD Million)
      Fig.14	Global Bakery and Confectionery Erythritol Market, 2016 – 2026 (USD Million)
      Fig.15	Global Dairy Erythritol Market, 2016 – 2026 (USD Million)
      Fig.16	Global Personal care Erythritol Market, 2016 – 2026 (USD Million)
      Fig.17	Global Others Erythritol Market, 2016 – 2026 (USD Million)
      Fig.18	Global Erythritol Market Share, by Sales Channel, 2019 & 2026 (USD Million)
      Fig.19	Global Direct channel Erythritol Market, 2016 – 2026 (USD Million)
      Fig.20	Global Distribution channel Erythritol Market, 2016 – 2026 (USD Million)
      Fig.21	Global Erythritol Market Share, by Region, 2019 & 2026 (USD Million)
      Fig.22	North America Erythritol Market, 2016 – 2026 (USD Million)
      Fig.23	U.S. Erythritol Market, 2016 – 2026 (USD Million)
      Fig.24	Canada Erythritol Market, 2016 – 2026 (USD Million)
      Fig.25	Europe Erythritol Market, 2016 – 2026 (USD Million)
      Fig.26	Germany Erythritol Market, 2016 – 2026 (USD Million)
      Fig.27	France Erythritol Market, 2016 – 2026 (USD Million)
      Fig.28	U.K. Erythritol Market, 2016 – 2026 (USD Million)
      Fig.29	Italy Erythritol Market, 2016 – 2026 (USD Million)
      Fig.30	Spain Erythritol Market, 2016 – 2026 (USD Million)
      Fig.31	Rest of Europe Erythritol Market, 2016 – 2026 (USD Million)
      Fig.32	Asia Pacific Erythritol Market, 2016 – 2026 (USD Million)
      Fig.33	China Erythritol Market, 2016 – 2026 (USD Million)
      Fig.34	Japan Erythritol Market, 2016 – 2026 (USD Million)
      Fig.35	India Erythritol Market, 2016 – 2026 (USD Million)
      Fig.36	South  Korea Erythritol Market, 2016 – 2026 (USD Million)
      Fig.37	South-East Asia Erythritol Market, 2016 – 2026 (USD Million)
      Fig.38	Rest of Asia Pacific Erythritol Market, 2016 – 2026 (USD Million)
      Fig.39	Latin America Erythritol Market, 2016 – 2026 (USD Million)
      Fig.40	Brazil Erythritol Market, 2016 – 2026 (USD Million)
      Fig.41	Mexico Erythritol Market, 2016 – 2026 (USD Million)
      Fig.42	Rest of Latin America Erythritol Market, 2016 – 2026 (USD Million)
      Fig.43	The Middle-East and Africa Erythritol Market, 2016 – 2026 (USD Million)
      Fig.44	GCC Countries Erythritol Market, 2016 – 2026 (USD Million)
      Fig.45	South Africa Erythritol Market, 2016 – 2026 (USD Million)
      Fig.46	Rest of Middle-East Africa Erythritol Market, 2016 – 2026 (USD Million)
      Fig.47	Competitor Market Share – Revenue
      Fig.48	JUNGBUNZLAUER SUISSE AG Revenue and Growth Rate
      Fig.49	JUNGBUNZLAUER SUISSE AG Market Share
      Fig.50	Cargill Inc Revenue and Growth Rate
      Fig.51	Cargill Inc Market Share
      Fig.52	Incorporated Revenue and Growth Rate
      Fig.53	Incorporated Market Share
      Fig.54	Foodchem International Corporation Revenue and Growth Rate
      Fig.55	Foodchem International Corporation Market Share
      Fig.56	Shandong Sanyuan Biotechnology Co., Ltd Revenue and Growth Rate
      Fig.57	Shandong Sanyuan Biotechnology Co., Ltd Market Share
      Fig.58	Tate & Lyle Revenue and Growth Rate
      Fig.59	Tate & Lyle Market Share
      Fig.60	Cerestar Holding B.V Revenue and Growth Rate
      Fig.61	Cerestar Holding B.V Market Share
      Fig.62	Unterhofer & Partner KG/ZeroCal Revenue and Growth Rate
      Fig.63	Unterhofer & Partner KG/ZeroCal Market Share
      Fig.64	Zhucheng Dongxiao Biotechnology Revenue and Growth Rate
      Fig.65	Zhucheng Dongxiao Biotechnology Market Share
      Fig.66	Baolingbao Biology Revenue and Growth Rate
      Fig.67	Baolingbao Biology Market Share
      Fig.68	Nikken-Chemical Revenue and Growth Rate
      Fig.69	Nikken-Chemical Market Share
      Fig.70	Futaste and Ingredientstech Revenue and Growth Rate
      Fig.71	Futaste and Ingredientstech Market Share
      Fig.72	Jungbunzlauer Revenue and Growth Rate
      Fig.73	Jungbunzlauer Market Share
      Fig.74	Zibo ZhongShi GeRui Biotech Revenue and Growth Rate
      Fig.75	Zibo ZhongShi GeRui Biotech Market Share
      Fig.76	Market Dynamics
      Fig.77	Global Erythritol – Value Chain Analysis
      Fig.78	Key Mandates and Regulations
      Fig.79	Technology Roadmap and Timeline
      Fig.80	Market Attractiveness Analysis – By Form
      Fig.81	Market Attractiveness Analysis – By Application
      Fig.82	Market Attractiveness Analysis – By Sales Channel
      Fig.83	Market Attractiveness Analysis – By Region
      Fig.84	Erythritol Industrial Chain Analysis
      Fig.85	Market Channels
      Fig.86	Marketing Channel Development Trend
      Fig.87	Growth in World Gross Product, 2008-2018
      

      List of Tables

      Table 1	Global Erythritol Market, 2019 & 2026 (USD Million)
      Table 2	Global Erythritol Market, by Form, 2016 – 2026 (USD Million)
      Table 3	Global Erythritol Market, by Application, 2016 – 2026 (USD Million)
      Table 4	Global Erythritol Market, by Sales Channel, 2016 – 2026 (USD Million)
      Table 5	Global Erythritol Market, by Region, 2016 – 2026 (USD Million)
      Table 6	North America Erythritol Market, by Country, 2016 – 2026 (USD Million)
      Table 7	North America Erythritol Market, by Form, 2016 – 2026 (USD Million)
      Table 8	North America Erythritol Market, by Application, 2016 – 2026 (USD Million)
      Table 9 North America Erythritol Market, by Sales Channel, 2016 – 2026 (USD Million)
      Table 10 Europe Erythritol Market, by Country, 2016 – 2026 (USD Million)
      Table 11 Europe Erythritol Market, by Form, 2016 – 2026 (USD Million)
      Table 12 Europe Erythritol Market, by Application, 2016 – 2026 (USD Million)
      Table 13 Europe Erythritol Market, by Sales Channel, 2016 – 2026 (USD Million)
      Table 14 Asia Pacific Erythritol Market, by Country, 2016 – 2026 (USD Million)
      Table 15 Asia Pacific Erythritol Market, by Form, 2016 – 2026 (USD Million)
      Table 16 Asia Pacific Erythritol Market, by Application, 2016 – 2026 (USD Million)
      Table 17 Asia Pacific Erythritol Market, by Sales Channel, 2016 – 2026 (USD Million)
      Table 18 Latin America Erythritol Market, by Country, 2016 – 2026 (USD Million)
      Table 19 Latin America Erythritol Market, by Form, 2016 – 2026 (USD Million)
      Table 20 Latin America Erythritol Market, by Application, 2016 – 2026 (USD Million)
      Table 21 Latin America Erythritol Market, by Sales Channel, 2016 – 2026 (USD Million)
      Table 22 The Middle-East and Africa Erythritol Market, by Country, 2016 – 2026 (USD Million)
      Table 23 The Middle-East and Africa Erythritol Market, by Form, 2016 – 2026 (USD Million)
      Table 24 The Middle-East and Africa Erythritol Market, by Application, 2016 – 2026 (USD Million)
      Table 25 The Middle-East and Africa Erythritol Market, by Sales Channel, 2016 – 2026 (USD Million)
      Table 26 Global Erythritol Market - Company Revenue Analysis, 2016 – 2019 (USD Million)
      Table 27 Global Erythritol Market - Company Revenue Share Analysis, 2016 – 2019 (%)
      Table 28 Acquisitions and Mergers
      Table 29 Market Drivers – Impact Analysis
      Table 30 Market Restraints
      Table 31 Market Opportunities
      Table 32 Major Buyers of Erythritol
      Table 33 Distributors/Traders of Erythritol by Region
      

Industry Major Market Players

  • JUNGBUNZLAUER SUISSE AG
  • Cargill Inc.
  • Incorporated
  • Foodchem International Corporation & Shandong Sanyuan Biotechnology Co. Ltd
  • Tate & Lyle
  • Cerestar Holding B.V
  • Unterhofer & Partner KG/ZeroCal
  • Zhucheng Dongxiao Biotechnology
  • Baolingbao Biology
  • Nikken-Chemical
  • Futaste and Ingredientstech
  • Jungbunzlauer
  • Zibo ZhongShi GeRui Biotech