Search Market Research Report

Discover Our Latest Reports
Discover Our Featured Reports
Discover Top Selling Reports

Equine Supplement Products Market Size, Share Global Analysis Report, 2019 – 2026

report img

Equine Supplement Products Market By Supplement (Proteins/ Amino Acids, Vitamins, Enzymes, Electrolytes/ Minerals, and Others), by Application (Performance Enhancement, Joint Disorder Prevention, and Others), and by Distribution Channel (Veterinary Hospital Pharmacies, Retail Pharmacies, and Others): Global Industry Perspective, Comprehensive Analysis, and Forecast 2019 – 2026

Industry Insights

The equine supplement products market report analyzes and notifies the industry statistics at the global as well as regional and country levels to acquire a thorough perspective of the entire equine supplement products market. The historical and past insights are provided for FY 2016 to FY 2019 whereas projected trends are delivered for FY 2020 to FY 2026. The quantitative and numerical data is represented in terms of value (USD 100 Million) from FY 2016 – 2026.

This specialized and expertise-oriented industry research report scrutinizes the technical and commercial business outlook of the equine supplement products industry. The report analyzes and declares the historical and current trends analysis of the equine supplement products industry and subsequently recommends the projected trends anticipated to be observed in the equine supplement products market during the upcoming years.

Equine Supplement Products Market Size

To know more about this report | Request Free Sample Copy


logoKey Insights from Primary Research

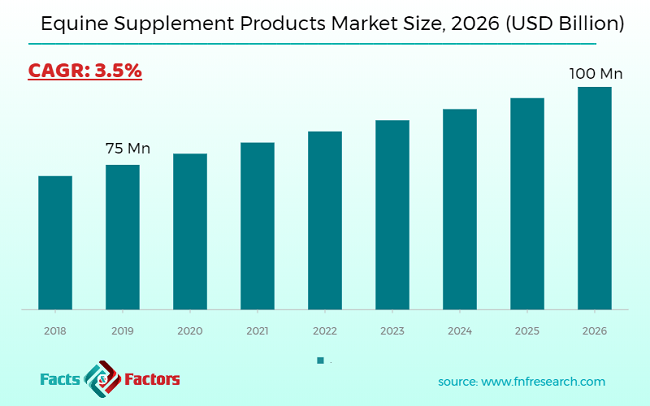
  • As per our primary respondents, the global equine supplement products market is set to grow annually at a rate of around 3.5%.
  • It was established through primary research that the global equine supplement products market was valued at around USD 75 Million in 2019.
  • The “electrolytes/minerals” category, on the basis of supplement segmentation, was the leading revenue-generating category in 2019.
  • On the basis of distribution channel segmentation, the “Veterinary hospital pharmacies” category was the leading revenue-generating category in 2019.
  • Based on the region, North America was the leading revenue-generating category in 2019.

logoKey Recommendations from Analysts

  • As per our analysis, the global equine supplement products market is growing at a high CAGR and various end-use industries are aware of this potential market and applications of the equine supplement products.
  • Growing at a CAGR of around 3.5%, the global equine supplement products market provides numerous opportunities for all of the involved stakeholders across the entire value chain.
  • Our analysts have identified electrolytes/minerals and Veterinary hospital pharmacies segments will be dominating for global equine supplement products market in terms of supplement and distribution channel segmentation respectively.
  • As per our analysis, North America is expected to account for the maximum revenue share, in the target market.

Equine Supplement Products Market

To know more about this report | Request Free Sample Copy


The quantitative data is further underlined and reinforced by comprehensive qualitative data which comprises various across-the-board market dynamics. The rationales which directly or indirectly impact the equine supplement products industry are exemplified through parameters such as growth drivers, restraints, challenges, and opportunities among other impacting factors.

Throughout our research report, we have encompassed all the proven models and tools of industry analysis and extensively illustrated all the key business strategies and business models adopted in the equine supplement products industry. The report provides an all-inclusive and detailed competitive landscape prevalent in the equine supplement products market.

The report utilizes established industry analysis tools and models such as Porter’s Five Forces framework to analyze and recognize critical business strategies adopted by various stakeholders involved in the entire value chain of the equine supplement products industry. The equine supplement products market report additionally employs SWOT analysis and PESTLE analysis models for further in-depth analysis.

The report study further includes an in-depth analysis of industry players' market shares and provides an overview of leading players' market position in the equine supplement products sector. Key strategic developments in the equine supplement products market competitive landscape such as acquisitions & mergers, inaugurations of different products and services, partnerships & joint ventures, MoU agreements, VC & funding activities, R&D activities, and geographic expansion among other noteworthy activities by key players of the equine supplement products market are appropriately highlighted in the report.

The equine supplement products market is estimated to develop with healthy CAGR in upcoming years. Equine activity is likely to be a high overhead due to increasing diseases such as herpes infection, western Nile infection, flu infection, and encephalomyelitis, where the cost of inoculation is estimated to be about USD 35 million according to information reported in the 2016 Euro Surveillance Report. Ubiquity and rising interests in elective types of betting like internet gaming, wagering, the exceptional yield on speculation, serious riding, and recreation is probably going to drive the worldwide equine enhancements item to advertise. In addition, developing interest for pet protection has opened new roads and the members in the market are pulled in by exceptional return on investment which is prompting market extension.

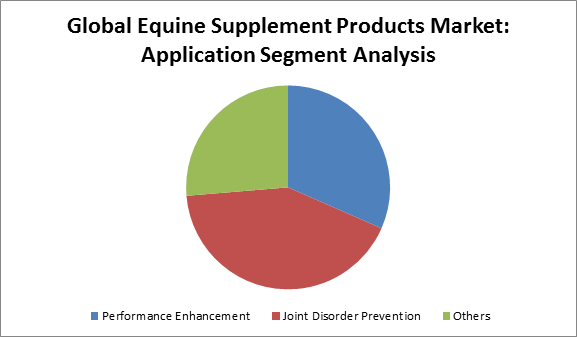
The worldwide equine supplement products industries have been bifurcated on the basis of supplement, distribution, application, and region supplement segment bifurcated into proteins/amino acids, vitamins, electrolytes/ mineral, enzyme, and others. The application segment is bifurcated into joint disorder prevention, performance enhancement, and others. Additionally, the distribution channel segment the global market is segmented into veterinary hospital pharmacies, retail pharmacies, and others.

logoReport Scope

Report Attribute

Details

Market Size in 2019

USD 75 Million

Projected Market Size in 2026

USD 100 Million

CAGR Growth Rate

3.5% CAGR

Base Year

2019

Forecast Years

2020-2026

Key Market Players

Zoetis, Vetoquinol S.A., Virbac, Plusvital Ltd., Lallemand, Inc., Kentucky Equine Research, Equine Products UK LTD, Purina Animal Nutrition LLC., and Bayer AG.

Key Segment

By Supplement, By Application, By Distribution Channel, By Region

Major Regions Covered

North America, Europe, Asia Pacific, Latin America, and the Middle East & Africa

Purchase Options

Request customized purchase options to meet your research needs. Explore purchase options

logoCompetitive Players

Some of the essential players operating in the market are :

  •  Zoetis
  •  Vetoquinol S.A.
  •  Virbac
  •  Plusvital Ltd.
  •  Lallemand Inc.
  •  Kentucky Equine Research
  •  Equine Products UK LTD
  •  Purina Animal Nutrition LLC.
  •  Bayer AG

The taxonomy of the equine supplement products Market by its scope and segmentation is as follows:

logo Supplement Segment Analysis

  • Proteins/ Amino Acids
  • Vitamins
  • Enzymes
  • Electrolytes/ Minerals
  • Others

logo Application Segment Analysis

  • Performance Enhancement
  • Joint Disorder Prevention
  • Others

logo Distribution Channel Segment Analysis

  • Veterinary Hospital Pharmacies
  • Retail Pharmacies
  • Others

logoGlobal Equine supplement products Market: Regional Segment Analysis

  • North America
    • The U.S.
    • Canada
  • Europe
    • Germany
    • France
    • UK
    • Italy
    • Spain
    • Rest Of Europe
  • Asia Pacific
    • China
    • Japan
    • India
    • South Korea
    • Southeast Asia
    • Rest of Asia Pacific
  • Latin America
    • Brazil
    • Mexico
    • Rest of Latin America
  • The Middle East & Africa
    • GCC Countries
    • South Africa
    • Rest of the Middle East & Africa

Table of Content

  1. CHAPTER 1. Executive Summary
  2. CHAPTER 2. Equine Supplement Products market – Supplement Analysis
    1. 2.1. Global Equine Supplement Products Market – Supplement Overview
    2. 2.2. Global Equine Supplement Products Market Share, by Supplement , 2018 & 2025 (USD Million )
    3. 2.3. Proteins/ Amino Acids
      1. 2.3.1. Global Proteins/ Amino Acids Equine Supplement Products Market, 2016-2026 (USD Million )
    4. 2.4. Vitamins
      1. 2.4.1. Global Vitamins Equine Supplement Products Market, 2016-2026 (USD Million )
    5. 2.5. Enzymes
      1. 2.5.1. Global Enzymes Equine Supplement Products Market, 2016-2026 (USD Million )
    6. 2.6. Electrolytes/ Minerals
      1. 2.6.1. Global Electrolytes/ Minerals Equine Supplement Products Market, 2016-2026 (USD Million )
    7. 2.7. Others
      1. 2.7.1. Global Others Equine Supplement Products Market, 2016-2026 (USD Million )
  3. CHAPTER 3. Equine Supplement Products market – Application Analysis
    1. 3.1. Global Equine Supplement Products Market – Application Overview
    2. 3.2. Global Equine Supplement Products Market Share, by Application, 2018 & 2025 (USD Million )
    3. 3.3. Performance Enhancement
      1. 3.3.1. Global Performance Enhancement Equine Supplement Products Market, 2016-2026 (USD Million )
    4. 3.4. Joint Disorder Prevention
      1. 3.4.1. Global Joint Disorder Prevention Equine Supplement Products Market, 2016-2026 (USD Million )
    5. 3.5. Others
      1. 3.5.1. Global Others Equine Supplement Products Market, 2016-2026 (USD Million )
  4. CHAPTER 4. Equine Supplement Products market – Distribution Channel Analysis
    1. 4.1. Global Equine Supplement Products Market – Distribution Channel Overview
    2. 4.2. Global Equine Supplement Products Market Share, by Distribution Channel, 2018 & 2025 (USD Million )
    3. 4.3. Veterinary Hospital Pharmacies
      1. 4.3.1. Global Veterinary Hospital Pharmacies Equine Supplement Products Market, 2016-2026 (USD Million )
    4. 4.4. Retail Pharmacies
      1. 4.4.1. Global Retail Pharmacies Equine Supplement Products Market, 2016-2026 (USD Million )
    5. 4.5. Others
      1. 4.5.1. Global Others Equine Supplement Products Market, 2016-2026 (USD Million )
  5. CHAPTER 5. Equine Supplement Products market – Regional Analysis
    1. 5.1. Global Equine Supplement Products Market Regional Overview
    2. 5.2. Global Equine Supplement Products Market Share, by Region, 2018 & 2025 (Value)
    3. 5.3. North America
      1. 5.3.1. North America Equine Supplement Products Market size and forecast, 2016-2026
      2. 5.3.2. North America Equine Supplement Products Market, by Country, 2018 & 2025 (USD Million )
      3. 5.3.3. North America Equine Supplement Products Market, by Supplement , 2016-2026
        1. 5.3.3.1. North America Equine Supplement Products Market, by Supplement , 2016-2026 (USD Million )
      4. 5.3.4. North America Equine Supplement Products Market, by Application, 2016-2026
        1. 5.3.4.1. North America Equine Supplement Products Market, by Application, 2016-2026 (USD Million )
      5. 5.3.5. North America Equine Supplement Products Market, by Distribution Channel, 2016-2026
        1. 5.3.5.1. North America Equine Supplement Products Market, by Distribution Channel, 2016-2026 (USD Million )
      6. 5.3.6. U.S.
        1. 5.3.6.1. U.S. Market size and forecast, 2016-2026 (USD Million )
      7. 5.3.7. Canada
        1. 5.3.7.1. Canada Market size and forecast, 2016-2026 (USD Million )
    4. 5.4. Europe
      1. 5.4.1. Europe Equine Supplement Products Market size and forecast, 2016-2026
      2. 5.4.2. Europe Equine Supplement Products Market, by Country, 2018 & 2025 (USD Million )
      3. 5.4.3. Europe Equine Supplement Products Market, by Supplement , 2016-2026
        1. 5.4.3.1. Europe Equine Supplement Products Market, by Supplement , 2016-2026 (USD Million )
      4. 5.4.4. Europe Equine Supplement Products Market, by Application, 2016-2026
        1. 5.4.4.1. Europe Equine Supplement Products Market, by Application, 2016-2026 (USD Million )
      5. 5.4.5. Europe Equine Supplement Products Market, by Distribution Channel, 2016-2026
        1. 5.4.5.1. Europe Equine Supplement Products Market, by Distribution Channel, 2016-2026 (USD Million )
      6. 5.4.6. Germany
        1. 5.4.6.1. Germany Market size and forecast, 2016-2026 (USD Million )
      7. 5.4.7. France
        1. 5.4.7.1. France Market size and forecast, 2016-2026 (USD Million )
      8. 5.4.8. U.K.
        1. 5.4.8.1. U.K. Market size and forecast, 2016-2026 (USD Million )
      9. 5.4.9. Italy
        1. 5.4.9.1. Italy Market size and forecast, 2016-2026 (USD Million )
      10. 5.4.10. Spain
        1. 5.4.10.1. Spain Market size and forecast, 2016-2026 (USD Million )
      11. 5.4.11. Rest of Europe
        1. 5.4.11.1. Rest of Europe Market size and forecast, 2016-2026 (USD Million )
    5. 5.5. Asia Pacific
      1. 5.5.1. Asia Pacific Equine Supplement Products Market size and forecast, 2016-2026
      2. 5.5.2. Asia Pacific Equine Supplement Products Market, by Country, 2018 & 2025 (USD Million )
      3. 5.5.3. Asia Pacific Equine Supplement Products Market, by Supplement , 2016-2026
        1. 5.5.3.1. Asia Pacific Equine Supplement Products Market, by Supplement , 2016-2026 (USD Million )
      4. 5.5.4. Asia Pacific Equine Supplement Products Market, by Application, 2016-2026
        1. 5.5.4.1. Asia Pacific Equine Supplement Products Market, by Application, 2016-2026 (USD Million )
      5. 5.5.5. Asia Pacific Equine Supplement Products Market, by Distribution Channel, 2016-2026
        1. 5.5.5.1. Asia Pacific Equine Supplement Products Market, by Distribution Channel, 2016-2026 (USD Million )
      6. 5.5.6. China
        1. 5.5.6.1. China Market size and forecast, 2016-2026 (USD Million )
      7. 5.5.7. Japan
        1. 5.5.7.1. Japan Market size and forecast, 2016-2026 (USD Million )
      8. 5.5.8. India
        1. 5.5.8.1. India Market size and forecast, 2016-2026 (USD Million )
      9. 5.5.9. South Korea
        1. 5.5.9.1. South Korea Market size and forecast, 2016-2026 (USD Million )
      10. 5.5.10. South-East Asia
        1. 5.5.10.1. South-East Asia Market size and forecast, 2016-2026 (USD Million )
      11. 5.5.11. Rest of Asia Pacific
        1. 5.5.11.1. Rest of Asia Pacific Market size and forecast, 2016-2026 (USD Million )
    6. 5.6. Latin America
      1. 5.6.1. Latin America Equine Supplement Products Market size and forecast, 2016-2026
      2. 5.6.2. Latin America Equine Supplement Products Market, by Country, 2018 & 2025 (USD Million )
      3. 5.6.3. Latin America Equine Supplement Products Market, by Supplement , 2016-2026
        1. 5.6.3.1. Latin America Equine Supplement Products Market, by Supplement , 2016-2026 (USD Million )
      4. 5.6.4. Latin America Equine Supplement Products Market, by Application, 2016-2026
        1. 5.6.4.1. Latin America Equine Supplement Products Market, by Application, 2016-2026 (USD Million )
      5. 5.6.5. Latin America Equine Supplement Products Market, by Distribution Channel, 2016-2026
        1. 5.6.5.1. Latin America Equine Supplement Products Market, by Distribution Channel, 2016-2026 (USD Million )
      6. 5.6.6. Brazil
        1. 5.6.6.1. Brazil Market size and forecast, 2016-2026 (USD Million )
      7. 5.6.7. Mexico
        1. 5.6.7.1. Mexico Market size and forecast, 2016-2026 (USD Million )
      8. 5.6.8. Rest of Latin America
        1. 5.6.8.1. Rest of Latin America Market size and forecast, 2016-2026 (USD Million )
    7. 5.7. The Middle-East and Africa
      1. 5.7.1. The Middle-East and Africa Equine Supplement Products Market size and forecast, 2016-2026
      2. 5.7.2. The Middle-East and Africa Equine Supplement Products Market, by Country, 2018 & 2025 (USD Million )
      3. 5.7.3. The Middle-East and Africa Equine Supplement Products Market, by Supplement , 2016-2026
        1. 5.7.3.1. The Middle-East and Africa Equine Supplement Products Market, by Supplement , 2016-2026 (USD Million )
      4. 5.7.4. The Middle-East and Africa Equine Supplement Products Market, by Application, 2016-2026
        1. 5.7.4.1. The Middle-East and Africa Equine Supplement Products Market, by Application, 2016-2026 (USD Million )
      5. 5.7.5. The Middle-East and Africa Equine Supplement Products Market, by Distribution Channel, 2016-2026
        1. 5.7.5.1. The Middle-East and Africa Equine Supplement Products Market, by Distribution Channel, 2016-2026 (USD Million )
      6. 5.7.6. GCC Countries
        1. 5.7.6.1. GCC Countries Market size and forecast, 2016-2026 (USD Million )
      7. 5.7.7. South Africa
        1. 5.7.7.1. South Africa Market size and forecast, 2016-2026 (USD Million )
      8. 5.7.8. Rest of Middle-East Africa
        1. 5.7.8.1. Rest of Middle-East Africa Market size and forecast, 2016-2026 (USD Million )
  6. CHAPTER 6. Equine Supplement Products market – Competitive Landscape
    1. 6.1. Competitor Market Share – Revenue
    2. 6.2. Market Concentration Rate Analysis, Top 3 and Top 5 Players
    3. 6.3. Strategic Development
      1. 6.3.1. Acquisitions and Mergers
      2. 6.3.2. New Products
      3. 6.3.3. Research & Development Activities
  7. CHAPTER 7. Company Profiles
    1. 7.1. Zoetis
      1. 7.1.1. Company Overview
      2. 7.1.2. Zoetis Revenue and Gross Margin
      3. 7.1.3. Product portfolio
      4. 7.1.4. Recent initiatives
    2. 7.2. Vetoquinol S.A.
      1. 7.2.1. Company Overview
      2. 7.2.2. Vetoquinol S.A. Revenue and Gross Margin
      3. 7.2.3. Product portfolio
      4. 7.2.4. Recent initiatives
    3. 7.3. Virbac
      1. 7.3.1. Company Overview
      2. 7.3.2. Virbac Revenue and Gross Margin
      3. 7.3.3. Product portfolio
      4. 7.3.4. Recent initiatives
    4. 7.4. Plusvital Ltd.
      1. 7.4.1. Company Overview
      2. 7.4.2. Plusvital Ltd. Revenue and Gross Margin
      3. 7.4.3. Product portfolio
      4. 7.4.4. Recent initiatives
    5. 7.5. Lallemand Inc.
      1. 7.5.1. Company Overview
      2. 7.5.2. Lallemand Inc. Revenue and Gross Margin
      3. 7.5.3. Product portfolio
      4. 7.5.4. Recent initiatives
    6. 7.6. Kentucky Equine Research
      1. 7.6.1. Company Overview
      2. 7.6.2. Kentucky Equine Research Revenue and Gross Margin
      3. 7.6.3. Product portfolio
      4. 7.6.4. Recent initiatives
    7. 7.7. Equine Products UK LTD
      1. 7.7.1. Company Overview
      2. 7.7.2. Equine Products UK LTD Revenue and Gross Margin
      3. 7.7.3. Product portfolio
      4. 7.7.4. Recent initiatives
    8. 7.8. Purina Animal Nutrition LLC.
      1. 7.8.1. Company Overview
      2. 7.8.2. Purina Animal Nutrition LLC. Revenue and Gross Margin
      3. 7.8.3. Product portfolio
      4. 7.8.4. Recent initiatives
    9. 7.9. Bayer AG
      1. 7.9.1. Company Overview
      2. 7.9.2. Bayer AG Revenue and Gross Margin
      3. 7.9.3. Product portfolio
      4. 7.9.4. Recent initiatives
  8. CHAPTER 8. Equine Supplement Products — Industry Analysis
    1. 8.1. Equine Supplement Products Market – Key Trends
      1. 8.1.1. Market Drivers
      2. 8.1.2. Market Restraints
      3. 8.1.3. Market Opportunities
    2. 8.2. Value Chain Analysis
    3. 8.3. Technology Roadmap and Timeline
    4. 8.4. Equine Supplement Products Market – Attractiveness Analysis
      1. 8.4.1. By Supplement
      2. 8.4.2. By Application
      3. 8.4.3. By Distribution Channel
      4. 8.4.4. By Region
  9. CHAPTER 9. Marketing Strategy Analysis, Distributors
    1. 9.1. Marketing Channel
    2. 9.2. Direct Marketing
    3. 9.3. Indirect Marketing
    4. 9.4. Marketing Channel Development Trend
    5. 9.5. Economic/Political Environmental Change
  10. CHAPTER 10. Report Conclusion
  11. CHAPTER 11. Research Approach & Methodology
    1. 11.1. Report Description
    2. 11.2. Research Scope
    3. 11.3. Research Methodology
      1. 11.3.1. Secondary Research
      2. 11.3.2. Primary Research
      3. 11.3.3. Models
        1. 11.3.3.1. Company Share Analysis Model
        2. 11.3.3.2. Revenue Based Modeling
        3. 11.3.3.3. Research Limitations

        List of Figures

        FIG. 1 Global Equine Supplement Products  Market, 2016-2026 (USD Million )
        FIG. 2 Global Equine Supplement Products  Market Share, by Supplement , 2018 & 2025 (USD Million )
        FIG. 3 Global Proteins/ Amino Acids Equine Supplement Products  Market, 2016-2026 (USD Million )
        FIG. 4 Global Vitamins Equine Supplement Products  Market, 2016-2026 (USD Million )
        FIG. 5 Global Enzymes Equine Supplement Products  Market, 2016-2026 (USD Million )
        FIG. 6 Global Electrolytes/ Minerals Equine Supplement Products  Market, 2016-2026 (USD Million )
        FIG. 7 Global Others Equine Supplement Products  Market, 2016-2026 (USD Million )
        FIG. 8 Global Equine Supplement Products  Market Share, by Application, 2018 & 2025 (USD Million )
        FIG. 9 Global  Performance Enhancement Equine Supplement Products  Market, 2016-2026 (USD Million )
        FIG. 10 Global Joint Disorder Prevention Equine Supplement Products  Market, 2016-2026 (USD Million )
        FIG. 11 Global Others Equine Supplement Products  Market, 2016-2026 (USD Million )
        FIG. 12 Global Equine Supplement Products  Market Share, by Distribution Channel, 2018 & 2025 (USD Million )
        FIG. 13 Global Veterinary Hospital Pharmacies Equine Supplement Products  Market, 2016-2026 (USD Million )
        FIG. 14 Global Retail Pharmacies Equine Supplement Products  Market, 2016-2026 (USD Million )
        FIG. 15 Global Others Equine Supplement Products  Market, 2016-2026 (USD Million )
        FIG. 16 Global Equine Supplement Products  Market Share, by Region, 2018 & 2025
        FIG. 17 North America Equine Supplement Products  Market, 2016-2026
        FIG. 18 U.S. Equine Supplement Products  Market, 2016-2026
        FIG. 19 Canada Equine Supplement Products  Market, 2016-2026
        FIG. 20 Europe Equine Supplement Products  Market, 2016-2026
        FIG. 21 Germany Equine Supplement Products  Market, 2016-2026
        FIG. 22 France Equine Supplement Products  Market, 2016-2026
        FIG. 23 U.K. Equine Supplement Products  Market, 2016-2026
        FIG. 24 Italy Equine Supplement Products  Market, 2016-2026
        FIG. 25 Spain Equine Supplement Products  Market, 2016-2026
        FIG. 26 Rest of Europe Equine Supplement Products  Market, 2016-2026
        FIG. 27 Asia Pacific Equine Supplement Products  Market, 2016-2026
        FIG. 28 China Equine Supplement Products  Market, 2016-2026
        FIG. 29 Japan Equine Supplement Products  Market, 2016-2026
        FIG. 30 India Equine Supplement Products  Market, 2016-2026
        FIG. 31 South  Korea Equine Supplement Products  Market, 2016-2026
        FIG. 32 South-East Asia Equine Supplement Products  Market, 2016-2026
        FIG. 33 Rest of Asia Pacific Equine Supplement Products  Market, 2016-2026
        FIG. 34 Latin America Equine Supplement Products  Market, 2016-2026
        FIG. 35 Brazil Equine Supplement Products  Market, 2016-2026
        FIG. 36 Mexico Equine Supplement Products  Market, 2016-2026
        FIG. 37 Rest of Latin America Equine Supplement Products  Market, 2016-2026
        FIG. 38 The Middle-East and Africa Equine Supplement Products  Market, 2016-2026
        FIG. 39 GCC Countries Equine Supplement Products  Market, 2016-2026
        FIG. 40 South Africa Equine Supplement Products  Market, 2016-2026
        FIG. 41 Rest of Middle-East Africa Equine Supplement Products  Market, 2016-2026
        FIG. 42 Competitor Market Share – Revenue
        FIG. 43 Zoetis Revenue and Growth Rate
        FIG. 44 Zoetis Market Share
        FIG. 45 Vetoquinol S.A. Revenue and Growth Rate
        FIG. 46 Vetoquinol S.A. Market Share
        FIG. 47 Virbac Revenue and Growth Rate
        FIG. 48 Virbac Market Share
        FIG. 49 Plusvital Ltd. Revenue and Growth Rate
        FIG. 50 Plusvital Ltd. Market Share
        FIG. 51 Lallemand Inc. Revenue and Growth Rate
        FIG. 52 Lallemand Inc. Market Share
        FIG. 53 Kentucky Equine Research Revenue and Growth Rate
        FIG. 54 Kentucky Equine Research Market Share
        FIG. 55 Equine Products UK LTD Revenue and Growth Rate
        FIG. 56 Equine Products UK LTD Market Share
        FIG. 57 Purina Animal Nutrition LLC. Revenue and Growth Rate
        FIG. 58 Purina Animal Nutrition LLC. Market Share
        FIG. 59 Bayer AG Revenue and Growth Rate
        FIG. 60 Bayer AG Market Share
        FIG. 61 Market Dynamics
        FIG. 62 Global Equine Supplement Products  – Value Chain Analysis
        FIG. 63 Technology Roadmap and Timeline
        FIG. 64 Market Attractiveness Analysis – By Supplement
        FIG. 65 Market Attractiveness Analysis – By Application
        FIG. 66 Market Attractiveness Analysis – By Distribution Channel
        FIG. 67 Market Attractiveness Analysis – By Region
        FIG. 68 Market Channel
        FIG. 69 Marketing Channel Development Trend
        FIG. 70 Growth in World Gross Product, 2008-2018

        List of Tables

        TABLE 1 Global Equine Supplement Products  Market, 2018 & 2025 (USD Million )
        TABLE 2 Global Equine Supplement Products  market, by Supplement , 2016-2026 (USD Million )
        TABLE 3 Global Equine Supplement Products  market, by Application, 2016-2026 (USD Million )
        TABLE 4 Global Equine Supplement Products  market, by Distribution Channel, 2016-2026 (USD Million )
        TABLE 5 Global Equine Supplement Products  market, by Region, 2016-2026 (USD Million )
        TABLE 6 North America Equine Supplement Products  Market, by Supplement , 2016-2026 (USD Million )
        TABLE 7 North America Equine Supplement Products  Market, by Application, 2016-2026 (USD Million )
        TABLE 8 North America Equine Supplement Products  Market, by Distribution Channel, 2016-2026 (USD Million )
        TABLE 9 Europe Equine Supplement Products  Market, by Supplement , 2016-2026 (USD Million )
        TABLE 10 Europe Equine Supplement Products  Market, by Application, 2016-2026 (USD Million )
        TABLE 11 Europe Equine Supplement Products  Market, by Distribution Channel, 2016-2026 (USD Million )
        TABLE 12 Asia Pacific Equine Supplement Products  Market, by Supplement , 2016-2026 (USD Million )
        TABLE 13 Asia Pacific Equine Supplement Products  Market, by Application, 2016-2026 (USD Million )
        TABLE 14 Asia Pacific Equine Supplement Products  Market, by Distribution Channel, 2016-2026 (USD Million )
        TABLE 15 Latin America Equine Supplement Products  Market, by Supplement , 2016-2026 (USD Million )
        TABLE 16 Latin America Equine Supplement Products  Market, by Application, 2016-2026 (USD Million )
        TABLE 17 Latin America Equine Supplement Products  Market, by Distribution Channel, 2016-2026 (USD Million )
        TABLE 18 The Middle-East and Africa Equine Supplement Products  Market, by Supplement , 2016-2026 (USD Million )
        TABLE 19 The Middle-East and Africa Equine Supplement Products  Market, by Application, 2016-2026 (USD Million )
        TABLE 20 The Middle-East and Africa Equine Supplement Products  Market, by Distribution Channel, 2016-2026 (USD Million )
        TABLE 21 Global Equine Supplement Products  Market - Company Revenue Analysis 2016-2019 (USD Million )
        TABLE 22 Global Equine Supplement Products  Market - Company Revenue Share Analysis 2016-2019(%)
        TABLE 23 Acquisitions and Mergers
        TABLE 24 New Product/Service Launch
        TABLE 25 Research & Development Activities
        TABLE 26 Market Drivers
        TABLE 27 Market Restraints
        TABLE 28 Market Opportunities

Industry Major Market Players

  •  Zoetis
  •  Vetoquinol S.A.
  •  Virbac
  •  Plusvital Ltd.
  •  Lallemand Inc.
  •  Kentucky Equine Research
  •  Equine Products UK LTD
  •  Purina Animal Nutrition LLC.
  •  Bayer AG