Search Market Research Report

Discover Our Latest Reports
Discover Our Featured Reports
Discover Top Selling Reports

Enterprise Governance, Risk, And Compliance (eGRC) Market Size, Share Global Analysis Report, 2021 – 2026

report img

Enterprise Governance, Risk, And Compliance (eGRC) Market By Component (Software & Services), By Type (Audit Management, Compliance Management, Risk Management, Policy Management, Incident Management, & Others), By Services (Integration, Consulting, & Support), By Enterprise Size (SMEs & Large Enterprises), By Industry Verticals (BSFI, Construction & Engineering, Energy & Utilities, Healthcare, Government, Manufacturing, Retail & Consumer Goods, Telecom & IT, & Others), And By Regions - Global & Regional Industry Perspective, Comprehensive Analysis, and Forecast 2021 – 2026

Industry Insights

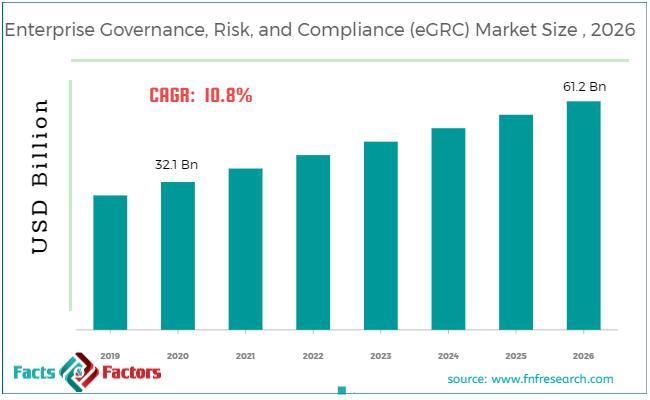
[198+ pages Report] The latest findings and offering on the enterprise governance, risk, and compliance (eGRC) market released by Facts & Factors cover the entire market summary in a neatly titled “Global Enterprise Governance, Risk, And Compliance (eGRC) Market” report. The current study estimates the global enterprise governance, risk, and compliance (eGRC) market to be valued at USD 32.1 Billion in the year 2020 and will grow at an estimated CAGR rate of 10.8% to an overall value of USD 61.2 Billion in the year 2026.

Enterprise Governance, Risk, And Compliance (eGRC) Market Size

To know more about this report | Request Free Sample Copy

logoMarket Overview

Enterprise governance, risk, and compliance (eGRC) is a concept of tackling governance, mitigating risks, and compliances for an enterprise or an organization by creating a wider set of policies that provide policies, procedures, regulatory controls, risk assessment controls, risk monitoring measures, and internal controls to name a few. These mechanisms identify the correct mechanisms in order to identify, manage, and anticipate incoming risks so that the upper management can induce policies and institute procedures for minimizing risks.

logoIndustry Growth Factors

The global enterprise governance, risk, and compliance (eGRC) market are expected to witness higher growth during the forecast period owing to the rising need of meeting stringent compliance standard mandates coupled with rising data and security breaches to name a few. Additionally, increasing integration of technologies pertaining to artificial intelligence and blockchain technologies coupled with the rising number of eGRC vendors is expected to increase the footprint of the global enterprise governance, risk, and compliance (eGRC) market during the forecast period. Moreover, increasing complexities in the ongoing infrastructure-related projects coupled with the rising volume of data are expected to boost the global enterprise governance, risk, and compliance (eGRC) market during the forecast period.

The global enterprise governance, risk, and compliance (eGRC) market are expected to be driven by factors pertaining to real-time situation monitoring tools coupled with efficient implementation leading to the prevention of monetary and reputational risks to name a few. However, irregular regulatory policies across the global scale are expected to hamper the growth of the global enterprise governance, risk, and compliance (eGRC) market during the forecast period.

logoSegmentation Analysis

The global enterprise governance, risk, and compliance (eGRC) market are segmented into components, type, services, enterprise size, industry verticals, and regions.

The global enterprise governance, risk, and compliance (eGRC) market are bifurcated into software & services on the basis of components. The software segment is expected to witness the largest market share during the advent of the forecast owing to decreasing cost of software integrated solutions coupled with increasing functionality dealing with compliance to supply chain, quality control, and OSHA mandated rules. Based on type, the global enterprise governance, risk, and compliance (eGRC) market are divided into audit management, compliance management, risk management, policy management, incident management, and others. The segment pertaining to risk management is expected to witness the largest market share during the advent of the forecast owing to the latter’s ability to avert breaches against requirements and further help avoid subsequent policies to name a few. The global enterprise governance, risk, and compliance (eGRC) market are segregated into integration, consulting, and support on the basis of services. The consulting segment is expected to occupy the largest market share during the advent of the forecast owing to the shifting paradigm of consumers to the emergence of IoT and other digital frameworks coupled with the integration of big data practices to name a few.

The global enterprise governance, risk, and compliance (eGRC) market can be segregated into SMEs and large enterprises on the basis of enterprise size. The segment pertaining to large enterprise is expected to witness the largest market share during the advent of the forecast owing to changing regulatory scenarios coupled with rising number of measures evolving mitigating threats to name a few. The global enterprise governance, risk, and compliance (eGRC) market can be shattered intoBSFI, construction & engineering, energy & utilities, healthcare, government, manufacturing, retail & consumer goods, telecom & IT, and others on the basis of industry verticals. The segment pertaining to BSFI is expected to witness the largest market share during the advent of the forecast owing to risk management tools pertaining to identifying potential threats to the consumers coupled with increasing number of third parties expanding their product range to name a few.

logo Report Scope

Report Attribute

Details

Market Size in 2020

USD 32.1 Billion

Projected Market Size in 2026

USD 61.2 Billion

CAGR Growth Rate

10.8% CAGR

Base Year

2020

Forecast Years

2021-2026

Key Market Players

IBM, Oracle, SAP, SAS Institute, ServiceNow, Software AG, RSA Security, MEGA International, Ideagen, Mphasis, MetricStream, Protiviti, SAI Global, Process Gene, LogicManager, Quantivate, Riskonnect, NAVEX Global, Alyne, Lexcomply, StandardFusion, and FIS, among others.

Key Segments

Components, Types, Services, Enterprise Size, Industry Verticals, and Region

Major Regions Covered

North America, Europe, Asia Pacific, Latin America, and Middle East & Africa

Purchase Options

Request customized purchase options to meet your research needs. Explore purchase options

logo Regional Analysis

North America is expected to witness the largest market share during the advent of the forecast owing to the region is the home to many large-scale companies that are often prone to cyber-attacks and phishing scams coupled with increasing government scrutiny to name a few. Additionally, the rising adoption of big data, AI, and ML-based solutions coupled with the rising number of general activities of organizations is expected to increase the footprint of the enterprise governance, risk, and compliance (eGRC) market during the forecast period. Factors pertaining to the increased adoption of cloud-based measures are further expected to open new revenue opportunities for the enterprise governance, risk, and compliance (eGRC) market during the forecast period. Asia-Pacific is expected to witness the fastest growing CAGR during the advent of the forecast period owing to the rising IT sector in emerging economies such as IT and China coupled with the rising need for tackling internal and external business risks to name a few.

logo Competitive Players

The key market participants in the global enterprise governance, risk, and compliance (eGRC) market are :

  • IBM
  • Oracle
  • SAP
  • SAS Institute
  • ServiceNow
  • Software AG
  • RSA Security
  • MEGA International
  • Ideagen
  • Mphasis
  • MetricStream
  • Protiviti
  • SAI Global
  • Process Gene
  • LogicManager
  • Quantivate
  • Riskonnect
  • NAVEX Global
  • Alyne
  • Lexcomply
  • StandardFusion
  • FIS

logo By Component Segment Analysis

  • Software
  • Services

logo By Type Segment Analysis

  • Audit Management
  • Compliance Management
  • Risk Management
  • Policy Management
  • Incident Management
  • Others

logo By Services Segment Analysis

  • Integration
  • Consulting
  • Support

logo By Enterprise Size Segment Analysis

  • SMEs
  • Large Enterprises

logo By Industry Verticals Segment Analysis

  • BSFI
  • Construction & Engineering
  • Energy & Utilities
  • Healthcare
  • Government
  • Manufacturing
  • Retail & Consumer Goods
  • Telecom & IT
  • Others

logoEnterprise Governance, Risk, and Compliance (eGRC) Market: By Regional Segment Analysis

  • North America
    • U.S.
  • Europe
    • UK
    • France
    • Germany
  • Asia Pacific
    • China
    • Japan
    • India
  • Latin America
    • Brazil
  • The Middle East and Africa

Table of Content

  1. Chapter 1 Executive Summary
    1. 1.1. Introduction of Enterprise Governance, Risk, And Compliance (eGRC)
    2. 1.2. Global Enterprise Governance, Risk, And Compliance (eGRC) Market, 2019 & 2026 (USD Billion)
    3. 1.3. Global Enterprise Governance, Risk, And Compliance (eGRC) Market, 2016 – 2026 (USD Billion)
    4. 1.4. Global Enterprise Governance, Risk, And Compliance (eGRC) Market Absolute Revenue Opportunity, 2016 – 2026 (USD Billion)
    5. 1.5. Global Enterprise Governance, Risk, And Compliance (eGRC) Market Incremental Revenue Opportunity, 2020 – 2026 (USD Billion)
  2. Chapter 2 Enterprise Governance, Risk, And Compliance (eGRC) Market – Component Analysis
    1. 2.1. Global Enterprise Governance, Risk, And Compliance (eGRC) Market – Component Overview
    2. 2.2. Global Enterprise Governance, Risk, And Compliance (eGRC) Market Share, by Component, 2019 & 2026 (USD Billion)
    3. 2.3. Software
      1. 2.3.1. Global Software Enterprise Governance, Risk, And Compliance (eGRC) Market, 2016 – 2026 (USD Billion)
    4. 2.4. Services
      1. 2.4.1. Global Services Enterprise Governance, Risk, And Compliance (eGRC) Market, 2016 – 2026 (USD Billion)
  3. Chapter 3 Enterprise Governance, Risk, And Compliance (eGRC) Market – Type Analysis
    1. 3.1. Global Enterprise Governance, Risk, And Compliance (eGRC) Market – Type Overview
    2. 3.2. Global Enterprise Governance, Risk, And Compliance (eGRC) Market Share, by Type, 2019 & 2026 (USD Billion)
    3. 3.3. Audit Management
      1. 3.3.1. Global Audit Management Enterprise Governance, Risk, And Compliance (eGRC) Market, 2016 – 2026 (USD Billion)
    4. 3.4. Compliance Management
      1. 3.4.1. Global Compliance Management Enterprise Governance, Risk, And Compliance (eGRC) Market, 2016 – 2026 (USD Billion)
    5. 3.5. Risk Management
      1. 3.5.1. Global Risk Management Enterprise Governance, Risk, And Compliance (eGRC) Market, 2016 – 2026 (USD Billion)
    6. 3.6. Policy Management
      1. 3.6.1. Global Policy Management Enterprise Governance, Risk, And Compliance (eGRC) Market, 2016 – 2026 (USD Billion)
    7. 3.7. Incident Management
      1. 3.7.1. Global Incident Management Enterprise Governance, Risk, And Compliance (eGRC) Market, 2016 – 2026 (USD Billion)
    8. 3.8. Others
      1. 3.8.1. Global Others Enterprise Governance, Risk, And Compliance (eGRC) Market, 2016 – 2026 (USD Billion)
  4. Chapter 4 Enterprise Governance, Risk, And Compliance (eGRC) Market – Services Analysis
    1. 4.1. Global Enterprise Governance, Risk, And Compliance (eGRC) Market – Services Overview
    2. 4.2. Global Enterprise Governance, Risk, And Compliance (eGRC) Market Share, by Services, 2019 & 2026 (USD Billion)
    3. 4.3. Integration
      1. 4.3.1. Global Integration Enterprise Governance, Risk, And Compliance (eGRC) Market, 2016 – 2026 (USD Billion)
    4. 4.4. Consulting
      1. 4.4.1. Global Consulting Enterprise Governance, Risk, And Compliance (eGRC) Market, 2016 – 2026 (USD Billion)
    5. 4.5. Support
      1. 4.5.1. Global Support Enterprise Governance, Risk, And Compliance (eGRC) Market, 2016 – 2026 (USD Billion)
  5. Chapter 5 Enterprise Governance, Risk, And Compliance (eGRC) Market – Enterprise Size Analysis
    1. 5.1. Global Enterprise Governance, Risk, And Compliance (eGRC) Market – Enterprise Size Overview
    2. 5.2. Global Enterprise Governance, Risk, And Compliance (eGRC) Market Share, by Enterprise Size, 2019 & 2026 (USD Billion)
    3. 5.3. SMEs
      1. 5.3.1. Global SMEs Enterprise Governance, Risk, And Compliance (eGRC) Market, 2016 – 2026 (USD Billion)
    4. 5.4. Large Enterprises
      1. 5.4.1. Global Large Enterprises Enterprise Governance, Risk, And Compliance (eGRC) Market, 2016 – 2026 (USD Billion)
  6. Chapter 6 Enterprise Governance, Risk, And Compliance (eGRC) Market – Industry Verticals Analysis
    1. 6.1. Global Enterprise Governance, Risk, And Compliance (eGRC) Market – Industry Verticals Overview
    2. 6.2. Global Enterprise Governance, Risk, And Compliance (eGRC) Market Share, by Industry Verticals, 2019 & 2026 (USD Billion)
    3. 6.3. BSFI
      1. 6.3.1. Global BSFI Enterprise Governance, Risk, And Compliance (eGRC) Market, 2016 – 2026 (USD Billion)
    4. 6.4. Construction & Engineering
      1. 6.4.1. Global Construction & Engineering Enterprise Governance, Risk, And Compliance (eGRC) Market, 2016 – 2026 (USD Billion)
    5. 6.5. Energy & Utilities
      1. 6.5.1. Global Energy & Utilities Enterprise Governance, Risk, And Compliance (eGRC) Market, 2016 – 2026 (USD Billion)
    6. 6.6. Healthcare
      1. 6.6.1. Global Healthcare Enterprise Governance, Risk, And Compliance (eGRC) Market, 2016 – 2026 (USD Billion)
    7. 6.7. Government
      1. 6.7.1. Global Government Enterprise Governance, Risk, And Compliance (eGRC) Market, 2016 – 2026 (USD Billion)
    8. 6.8. Manufacturing
      1. 6.8.1. Global Manufacturing Enterprise Governance, Risk, And Compliance (eGRC) Market, 2016 – 2026 (USD Billion)
    9. 6.9. Retail & Consumer Goods
      1. 6.9.1. Global Retail & Consumer Goods Enterprise Governance, Risk, And Compliance (eGRC) Market, 2016 – 2026 (USD Billion)
    10. 6.10. Telecom & IT
      1. 6.10.1. Global Telecom & IT Enterprise Governance, Risk, And Compliance (eGRC) Market, 2016 – 2026 (USD Billion)
    11. 6.11. Others
      1. 6.11.1. Global Others Enterprise Governance, Risk, And Compliance (eGRC) Market, 2016 – 2026 (USD Billion)
  7. Chapter 7 Enterprise Governance, Risk, And Compliance (eGRC) Market – Regional Analysis
    1. 7.1. Global Enterprise Governance, Risk, And Compliance (eGRC) Market Regional Overview
    2. 7.2. Global Enterprise Governance, Risk, And Compliance (eGRC) Market Share, by Region, 2019 & 2026 (USD Billion)
    3. 7.3. North America
      1. 7.3.1. North America Enterprise Governance, Risk, And Compliance (eGRC) Market, 2016 – 2026 (USD Billion)
        1. 7.3.1.1. North America Enterprise Governance, Risk, And Compliance (eGRC) Market, by Country, 2016 - 2026 (USD Billion)
      2. 7.3.2. North America Enterprise Governance, Risk, And Compliance (eGRC) Market, by Component, 2016 – 2026
        1. 7.3.2.1. North America Enterprise Governance, Risk, And Compliance (eGRC) Market, by Component, 2016 – 2026 (USD Billion)
      3. 7.3.3. North America Enterprise Governance, Risk, And Compliance (eGRC) Market, by Type, 2016 – 2026
        1. 7.3.3.1. North America Enterprise Governance, Risk, And Compliance (eGRC) Market, by Type, 2016 – 2026 (USD Billion)
      4. 7.3.4. North America Enterprise Governance, Risk, And Compliance (eGRC) Market, by Services, 2016 – 2026
        1. 7.3.4.1. North America Enterprise Governance, Risk, And Compliance (eGRC) Market, by Services, 2016 – 2026 (USD Billion)
      5. 7.3.5. North America Enterprise Governance, Risk, And Compliance (eGRC) Market, by Enterprise Size, 2016 – 2026
        1. 7.3.5.1. North America Enterprise Governance, Risk, And Compliance (eGRC) Market, by Enterprise Size, 2016 – 2026 (USD Billion)
      6. 7.3.6. North America Enterprise Governance, Risk, And Compliance (eGRC) Market, by Industry Verticals, 2016 – 2026
        1. 7.3.6.1. North America Enterprise Governance, Risk, And Compliance (eGRC) Market, by Industry Verticals, 2016 – 2026 (USD Billion)
      7. 7.3.7. U.S.
        1. 7.3.7.1. U.S. Enterprise Governance, Risk, And Compliance (eGRC) Market, 2016 – 2026 (USD Billion)
      8. 7.3.8. Canada
        1. 7.3.8.1. Canada Enterprise Governance, Risk, And Compliance (eGRC) Market, 2016 – 2026 (USD Billion)
    4. 7.4. Europe
      1. 7.4.1. Europe Enterprise Governance, Risk, And Compliance (eGRC) Market, 2016 – 2026 (USD Billion)
        1. 7.4.1.1. Europe Enterprise Governance, Risk, And Compliance (eGRC) Market, by Country, 2016 - 2026 (USD Billion)
      2. 7.4.2. Europe Enterprise Governance, Risk, And Compliance (eGRC) Market, by Component, 2016 – 2026
        1. 7.4.2.1. Europe Enterprise Governance, Risk, And Compliance (eGRC) Market, by Component, 2016 – 2026 (USD Billion)
      3. 7.4.3. Europe Enterprise Governance, Risk, And Compliance (eGRC) Market, by Type, 2016 – 2026
        1. 7.4.3.1. Europe Enterprise Governance, Risk, And Compliance (eGRC) Market, by Type, 2016 – 2026 (USD Billion)
      4. 7.4.4. Europe Enterprise Governance, Risk, And Compliance (eGRC) Market, by Services, 2016 – 2026
        1. 7.4.4.1. Europe Enterprise Governance, Risk, And Compliance (eGRC) Market, by Services, 2016 – 2026 (USD Billion)
      5. 7.4.5. Europe Enterprise Governance, Risk, And Compliance (eGRC) Market, by Enterprise Size, 2016 – 2026
        1. 7.4.5.1. Europe Enterprise Governance, Risk, And Compliance (eGRC) Market, by Enterprise Size, 2016 – 2026 (USD Billion)
      6. 7.4.6. Europe Enterprise Governance, Risk, And Compliance (eGRC) Market, by Industry Verticals, 2016 – 2026
        1. 7.4.6.1. Europe Enterprise Governance, Risk, And Compliance (eGRC) Market, by Industry Verticals, 2016 – 2026 (USD Billion)
      7. 7.4.7. Germany
        1. 7.4.7.1. Germany Enterprise Governance, Risk, And Compliance (eGRC) Market, 2016 – 2026 (USD Billion)
      8. 7.4.8. France
        1. 7.4.8.1. France Enterprise Governance, Risk, And Compliance (eGRC) Market, 2016 – 2026 (USD Billion)
      9. 7.4.9. U.K.
        1. 7.4.9.1. U.K. Enterprise Governance, Risk, And Compliance (eGRC) Market, 2016 – 2026 (USD Billion)
      10. 7.4.10. Italy
        1. 7.4.10.1. Italy Enterprise Governance, Risk, And Compliance (eGRC) Market, 2016 – 2026 (USD Billion)
      11. 7.4.11. Spain
        1. 7.4.11.1. Spain Enterprise Governance, Risk, And Compliance (eGRC) Market, 2016 – 2026 (USD Billion)
      12. 7.4.12. Rest of Europe
        1. 7.4.12.1. Rest of Europe Enterprise Governance, Risk, And Compliance (eGRC) Market, 2016 – 2026 (USD Billion)
    5. 7.5. Asia Pacific
      1. 7.5.1. Asia Pacific Enterprise Governance, Risk, And Compliance (eGRC) Market, 2016 – 2026 (USD Billion)
        1. 7.5.1.1. Asia Pacific Enterprise Governance, Risk, And Compliance (eGRC) Market, by Country, 2016 - 2026 (USD Billion)
      2. 7.5.2. Asia Pacific Enterprise Governance, Risk, And Compliance (eGRC) Market, by Component, 2016 – 2026
        1. 7.5.2.1. Asia Pacific Enterprise Governance, Risk, And Compliance (eGRC) Market, by Component, 2016 – 2026 (USD Billion)
      3. 7.5.3. Asia Pacific Enterprise Governance, Risk, And Compliance (eGRC) Market, by Type, 2016 – 2026
        1. 7.5.3.1. Asia Pacific Enterprise Governance, Risk, And Compliance (eGRC) Market, by Type, 2016 – 2026 (USD Billion)
      4. 7.5.4. Asia Pacific Enterprise Governance, Risk, And Compliance (eGRC) Market, by Services, 2016 – 2026
        1. 7.5.4.1. Asia Pacific Enterprise Governance, Risk, And Compliance (eGRC) Market, by Services, 2016 – 2026 (USD Billion)
      5. 7.5.5. Asia Pacific Enterprise Governance, Risk, And Compliance (eGRC) Market, by Enterprise Size, 2016 – 2026
        1. 7.5.5.1. Asia Pacific Enterprise Governance, Risk, And Compliance (eGRC) Market, by Enterprise Size, 2016 – 2026 (USD Billion)
      6. 7.5.6. Asia Pacific Enterprise Governance, Risk, And Compliance (eGRC) Market, by Industry Verticals, 2016 – 2026
        1. 7.5.6.1. Asia Pacific Enterprise Governance, Risk, And Compliance (eGRC) Market, by Industry Verticals, 2016 – 2026 (USD Billion)
      7. 7.5.7. China
        1. 7.5.7.1. China Enterprise Governance, Risk, And Compliance (eGRC) Market, 2016 – 2026 (USD Billion)
      8. 7.5.8. Japan
        1. 7.5.8.1. Japan Enterprise Governance, Risk, And Compliance (eGRC) Market, 2016 – 2026 (USD Billion)
      9. 7.5.9. India
        1. 7.5.9.1. India Enterprise Governance, Risk, And Compliance (eGRC) Market, 2016 – 2026 (USD Billion)
      10. 7.5.10. South Korea
        1. 7.5.10.1. South Korea Enterprise Governance, Risk, And Compliance (eGRC) Market, 2016 – 2026 (USD Billion)
      11. 7.5.11. South-East Asia
        1. 7.5.11.1. South-East Asia Enterprise Governance, Risk, And Compliance (eGRC) Market, 2016 – 2026 (USD Billion)
      12. 7.5.12. Rest of Asia Pacific
        1. 7.5.12.1. Rest of Asia Pacific Enterprise Governance, Risk, And Compliance (eGRC) Market, 2016 – 2026 (USD Billion)
    6. 7.6. Latin America
      1. 7.6.1. Latin America Enterprise Governance, Risk, And Compliance (eGRC) Market, 2016 – 2026 (USD Billion)
        1. 7.6.1.1. Latin America Enterprise Governance, Risk, And Compliance (eGRC) Market, by Country, 2016 - 2026 (USD Billion)
      2. 7.6.2. Latin America Enterprise Governance, Risk, And Compliance (eGRC) Market, by Component, 2016 – 2026
        1. 7.6.2.1. Latin America Enterprise Governance, Risk, And Compliance (eGRC) Market, by Component, 2016 – 2026 (USD Billion)
      3. 7.6.3. Latin America Enterprise Governance, Risk, And Compliance (eGRC) Market, by Type, 2016 – 2026
        1. 7.6.3.1. Latin America Enterprise Governance, Risk, And Compliance (eGRC) Market, by Type, 2016 – 2026 (USD Billion)
      4. 7.6.4. Latin America Enterprise Governance, Risk, And Compliance (eGRC) Market, by Services, 2016 – 2026
        1. 7.6.4.1. Latin America Enterprise Governance, Risk, And Compliance (eGRC) Market, by Services, 2016 – 2026 (USD Billion)
      5. 7.6.5. Latin America Enterprise Governance, Risk, And Compliance (eGRC) Market, by Enterprise Size, 2016 – 2026
        1. 7.6.5.1. Latin America Enterprise Governance, Risk, And Compliance (eGRC) Market, by Enterprise Size, 2016 – 2026 (USD Billion)
      6. 7.6.6. Latin America Enterprise Governance, Risk, And Compliance (eGRC) Market, by Industry Verticals, 2016 – 2026
        1. 7.6.6.1. Latin America Enterprise Governance, Risk, And Compliance (eGRC) Market, by Industry Verticals, 2016 – 2026 (USD Billion)
      7. 7.6.7. Brazil
        1. 7.6.7.1. Brazil Enterprise Governance, Risk, And Compliance (eGRC) Market, 2016 – 2026 (USD Billion)
      8. 7.6.8. Mexico
        1. 7.6.8.1. Mexico Enterprise Governance, Risk, And Compliance (eGRC) Market, 2016 – 2026 (USD Billion)
      9. 7.6.9. Rest of Latin America
        1. 7.6.9.1. Rest of Latin America Enterprise Governance, Risk, And Compliance (eGRC) Market, 2016 – 2026 (USD Billion)
    7. 7.7. The Middle-East and Africa
      1. 7.7.1. The Middle-East and Africa Enterprise Governance, Risk, And Compliance (eGRC) Market, 2016 – 2026 (USD Billion)
        1. 7.7.1.1. The Middle-East and Africa Enterprise Governance, Risk, And Compliance (eGRC) Market, by Country, 2016 - 2026 (USD Billion)
      2. 7.7.2. The Middle-East and Africa Enterprise Governance, Risk, And Compliance (eGRC) Market, by Component, 2016 – 2026
        1. 7.7.2.1. The Middle-East and Africa Enterprise Governance, Risk, And Compliance (eGRC) Market, by Component, 2016 – 2026 (USD Billion)
      3. 7.7.3. The Middle-East and Africa Enterprise Governance, Risk, And Compliance (eGRC) Market, by Type, 2016 – 2026
        1. 7.7.3.1. The Middle-East and Africa Enterprise Governance, Risk, And Compliance (eGRC) Market, by Type, 2016 – 2026 (USD Billion)
      4. 7.7.4. The Middle-East and Africa Enterprise Governance, Risk, And Compliance (eGRC) Market, by Services, 2016 – 2026
        1. 7.7.4.1. The Middle-East and Africa Enterprise Governance, Risk, And Compliance (eGRC) Market, by Services, 2016 – 2026 (USD Billion)
      5. 7.7.5. The Middle-East and Africa Enterprise Governance, Risk, And Compliance (eGRC) Market, by Enterprise Size, 2016 – 2026
        1. 7.7.5.1. The Middle-East and Africa Enterprise Governance, Risk, And Compliance (eGRC) Market, by Enterprise Size, 2016 – 2026 (USD Billion)
      6. 7.7.6. The Middle-East and Africa Enterprise Governance, Risk, And Compliance (eGRC) Market, by Industry Verticals, 2016 – 2026
        1. 7.7.6.1. The Middle-East and Africa Enterprise Governance, Risk, And Compliance (eGRC) Market, by Industry Verticals, 2016 – 2026 (USD Billion)
      7. 7.7.7. GCC Countries
        1. 7.7.7.1. GCC Countries Enterprise Governance, Risk, And Compliance (eGRC) Market, 2016 – 2026 (USD Billion)
      8. 7.7.8. South Africa
        1. 7.7.8.1. South Africa Enterprise Governance, Risk, And Compliance (eGRC) Market, 2016 – 2026 (USD Billion)
      9. 7.7.9. Rest of Middle-East Africa
        1. 7.7.9.1. Rest of Middle-East Africa Enterprise Governance, Risk, And Compliance (eGRC) Market, 2016 – 2026 (USD Billion)
  8. Chapter 8 Enterprise Governance, Risk, And Compliance (eGRC) Market – Competitive Landscape
    1. 8.1. Competitor Market Share – Revenue
    2. 8.2. Market Concentration Rate Analysis, Top 3 and Top 5 Players
    3. 8.3. Strategic Developments
      1. 8.3.1. Acquisitions and Mergers
      2. 8.3.2. New Products
      3. 8.3.3. Research & Development Activities
  9. Chapter 9 Company Profiles
    1. 9.1. IBM
      1. 9.1.1. Company Overview
      2. 9.1.2. Product/Service Portfolio
      3. 9.1.3. IBM Sales, Revenue, and Gross Margin
      4. 9.1.4. IBM Revenue and Growth Rate
      5. 9.1.5. IBM Market Share
      6. 9.1.6. Recent Initiatives, Funding/VC Activities, and Technological Innovations
    2. 9.2. Oracle
      1. 9.2.1. Company Overview
      2. 9.2.2. Product/Service Portfolio
      3. 9.2.3. Oracle Sales, Revenue, and Gross Margin
      4. 9.2.4. Oracle Revenue and Growth Rate
      5. 9.2.5. Oracle Market Share
      6. 9.2.6. Recent Initiatives, Funding/VC Activities, and Technological Innovations
    3. 9.3. SAP
      1. 9.3.1. Company Overview
      2. 9.3.2. Product/Service Portfolio
      3. 9.3.3. SAP Sales, Revenue, and Gross Margin
      4. 9.3.4. SAP Revenue and Growth Rate
      5. 9.3.5. SAP Market Share
      6. 9.3.6. Recent Initiatives, Funding/VC Activities, and Technological Innovations
    4. 9.4. SAS Institute
      1. 9.4.1. Company Overview
      2. 9.4.2. Product/Service Portfolio
      3. 9.4.3. SAS Institute Sales, Revenue, and Gross Margin
      4. 9.4.4. SAS Institute Revenue and Growth Rate
      5. 9.4.5. SAS Institute Market Share
      6. 9.4.6. Recent Initiatives, Funding/VC Activities, and Technological Innovations
    5. 9.5. ServiceNow
      1. 9.5.1. Company Overview
      2. 9.5.2. Product/Service Portfolio
      3. 9.5.3. ServiceNow Sales, Revenue, and Gross Margin
      4. 9.5.4. ServiceNow Revenue and Growth Rate
      5. 9.5.5. ServiceNow Market Share
      6. 9.5.6. Recent Initiatives, Funding/VC Activities, and Technological Innovations
    6. 9.6. Software AG
      1. 9.6.1. Company Overview
      2. 9.6.2. Product/Service Portfolio
      3. 9.6.3. Software AG Sales, Revenue, and Gross Margin
      4. 9.6.4. Software AG Revenue and Growth Rate
      5. 9.6.5. Software AG Market Share
      6. 9.6.6. Recent Initiatives, Funding/VC Activities, and Technological Innovations
    7. 9.7. RSA Security
      1. 9.7.1. Company Overview
      2. 9.7.2. Product/Service Portfolio
      3. 9.7.3. RSA Security Sales, Revenue, and Gross Margin
      4. 9.7.4. RSA Security Revenue and Growth Rate
      5. 9.7.5. RSA Security Market Share
      6. 9.7.6. Recent Initiatives, Funding/VC Activities, and Technological Innovations
    8. 9.8. MEGA International
      1. 9.8.1. Company Overview
      2. 9.8.2. Product/Service Portfolio
      3. 9.8.3. MEGA International Sales, Revenue, and Gross Margin
      4. 9.8.4. MEGA International Revenue and Growth Rate
      5. 9.8.5. MEGA International Market Share
      6. 9.8.6. Recent Initiatives, Funding/VC Activities, and Technological Innovations
    9. 9.9. Ideagen
      1. 9.9.1. Company Overview
      2. 9.9.2. Product/Service Portfolio
      3. 9.9.3. Ideagen Sales, Revenue, and Gross Margin
      4. 9.9.4. Ideagen Revenue and Growth Rate
      5. 9.9.5. Ideagen Market Share
      6. 9.9.6. Recent Initiatives, Funding/VC Activities, and Technological Innovations
    10. 9.10. Mphasis
      1. 9.10.1. Company Overview
      2. 9.10.2. Product/Service Portfolio
      3. 9.10.3. Mphasis Sales, Revenue, and Gross Margin
      4. 9.10.4. Mphasis Revenue and Growth Rate
      5. 9.10.5. Mphasis Market Share
      6. 9.10.6. Recent Initiatives, Funding/VC Activities, and Technological Innovations
    11. 9.11. MetricStream
      1. 9.11.1. Company Overview
      2. 9.11.2. Product/Service Portfolio
      3. 9.11.3. MetricStream Sales, Revenue, and Gross Margin
      4. 9.11.4. MetricStream Revenue and Growth Rate
      5. 9.11.5. MetricStream Market Share
      6. 9.11.6. Recent Initiatives, Funding/VC Activities, and Technological Innovations
    12. 9.12. Protiviti
      1. 9.12.1. Company Overview
      2. 9.12.2. Product/Service Portfolio
      3. 9.12.3. Protiviti Sales, Revenue, and Gross Margin
      4. 9.12.4. Protiviti Revenue and Growth Rate
      5. 9.12.5. Protiviti Market Share
      6. 9.12.6. Recent Initiatives, Funding/VC Activities, and Technological Innovations
    13. 9.13. SAI Global
      1. 9.13.1. Company Overview
      2. 9.13.2. Product/Service Portfolio
      3. 9.13.3. SAI Global Sales, Revenue, and Gross Margin
      4. 9.13.4. SAI Global Revenue and Growth Rate
      5. 9.13.5. SAI Global Market Share
      6. 9.13.6. Recent Initiatives, Funding/VC Activities, and Technological Innovations
    14. 9.14. Process Gene
      1. 9.14.1. Company Overview
      2. 9.14.2. Product/Service Portfolio
      3. 9.14.3. Process Gene Sales, Revenue, and Gross Margin
      4. 9.14.4. Process Gene Revenue and Growth Rate
      5. 9.14.5. Process Gene Market Share
      6. 9.14.6. Recent Initiatives, Funding/VC Activities, and Technological Innovations
    15. 9.15. LogicManager
      1. 9.15.1. Company Overview
      2. 9.15.2. Product/Service Portfolio
      3. 9.15.3. LogicManager Sales, Revenue, and Gross Margin
      4. 9.15.4. LogicManager Revenue and Growth Rate
      5. 9.15.5. LogicManager Market Share
      6. 9.15.6. Recent Initiatives, Funding/VC Activities, and Technological Innovations
    16. 9.16. Quantivate
      1. 9.16.1. Company Overview
      2. 9.16.2. Product/Service Portfolio
      3. 9.16.3. Quantivate Sales, Revenue, and Gross Margin
      4. 9.16.4. Quantivate Revenue and Growth Rate
      5. 9.16.5. Quantivate Market Share
      6. 9.16.6. Recent Initiatives, Funding/VC Activities, and Technological Innovations
    17. 9.17. Riskonnect
      1. 9.17.1. Company Overview
      2. 9.17.2. Product/Service Portfolio
      3. 9.17.3. Riskonnect Sales, Revenue, and Gross Margin
      4. 9.17.4. Riskonnect Revenue and Growth Rate
      5. 9.17.5. Riskonnect Market Share
      6. 9.17.6. Recent Initiatives, Funding/VC Activities, and Technological Innovations
    18. 9.18. NAVEX Global
      1. 9.18.1. Company Overview
      2. 9.18.2. Product/Service Portfolio
      3. 9.18.3. NAVEX Global Sales, Revenue, and Gross Margin
      4. 9.18.4. NAVEX Global Revenue and Growth Rate
      5. 9.18.5. NAVEX Global Market Share
      6. 9.18.6. Recent Initiatives, Funding/VC Activities, and Technological Innovations
    19. 9.19. Alyne
      1. 9.19.1. Company Overview
      2. 9.19.2. Product/Service Portfolio
      3. 9.19.3. Alyne Sales, Revenue, and Gross Margin
      4. 9.19.4. Alyne Revenue and Growth Rate
      5. 9.19.5. Alyne Market Share
      6. 9.19.6. Recent Initiatives, Funding/VC Activities, and Technological Innovations
    20. 9.20. Lexcomply
      1. 9.20.1. Company Overview
      2. 9.20.2. Product/Service Portfolio
      3. 9.20.3. Lexcomply Sales, Revenue, and Gross Margin
      4. 9.20.4. Lexcomply Revenue and Growth Rate
      5. 9.20.5. Lexcomply Market Share
      6. 9.20.6. Recent Initiatives, Funding/VC Activities, and Technological Innovations
    21. 9.21. StandardFusion
      1. 9.21.1. Company Overview
      2. 9.21.2. Product/Service Portfolio
      3. 9.21.3. StandardFusion Sales, Revenue, and Gross Margin
      4. 9.21.4. StandardFusion Revenue and Growth Rate
      5. 9.21.5. StandardFusion Market Share
      6. 9.21.6. Recent Initiatives, Funding/VC Activities, and Technological Innovations
    22. 9.22. FIS
      1. 9.22.1. Company Overview
      2. 9.22.2. Product/Service Portfolio
      3. 9.22.3. FIS Sales, Revenue, and Gross Margin
      4. 9.22.4. FIS Revenue and Growth Rate
      5. 9.22.5. FIS Market Share
      6. 9.22.6. Recent Initiatives, Funding/VC Activities, and Technological Innovations
  10. Chapter 10 Enterprise Governance, Risk, And Compliance (eGRC) — Industry Analysis
    1. 10.1. Introduction and Taxonomy
    2. 10.2. Enterprise Governance, Risk, And Compliance (eGRC) Market – Key Trends
      1. 10.2.1. Market Drivers
      2. 10.2.2. Market Restraints
      3. 10.2.3. Market Opportunities
    3. 10.3. Value Chain Analysis
    4. 10.4. Key Mandates and Regulations
    5. 10.5. Technology Roadmap and Timeline
    6. 10.6. Enterprise Governance, Risk, And Compliance (eGRC) Market – Attractiveness Analysis
      1. 10.6.1. By Component
      2. 10.6.2. By Type
      3. 10.6.3. By Services
      4. 10.6.4. By Enterprise Size
      5. 10.6.5. By Industry Verticals
      6. 10.6.6. By Region
  11. Chapter 11 Industrial Chain, Sourcing Strategy, and Downstream Buyers
    1. 11.1. Enterprise Governance, Risk, And Compliance (eGRC) Industrial Chain Analysis
    2. 11.2. Downstream Buyers
    3. 11.3. Distributors/Traders List
  12. Chapter 12 Marketing Strategy Analysis
    1. 12.1. Marketing Channel
    2. 12.2. Direct Marketing
    3. 12.3. Indirect Marketing
    4. 12.4. Marketing Channel Development Trends
    5. 12.5. Economic/Political Environmental Change
  13. Chapter 13 Report Conclusion & Key Insights
    1. 13.1. Key Insights from Primary Interviews & Surveys Respondents
    2. 13.2. Key Takeaways from Analysts, Consultants, and Industry Leaders
  14. Chapter 14 Research Approach & Methodology
    1. 14.1. Report Description
    2. 14.2. Research Scope
    3. 14.3. Research Methodology
      1. 14.3.1. Secondary Research
      2. 14.3.2. Primary Research
      3. 14.3.3. Statistical Models
        1. 14.3.3.1. Company Share Analysis Model
        2. 14.3.3.2. Revenue Based Modeling
      4. 14.3.4. Research Limitations

      List of Figures

      Fig.1	Product Picture of Enterprise Governance, Risk, And Compliance (eGRC)
      Fig.2	Global Enterprise Governance, Risk, And Compliance (eGRC) Market, 2016 – 2026 (USD Billion)
      Fig.3	Global Enterprise Governance, Risk, And Compliance (eGRC) Market Absolute Revenue Opportunity, 2016 – 2026 (USD Billion)
      Fig.4	Global Enterprise Governance, Risk, And Compliance (eGRC) Market Incremental Revenue Opportunity, 2020 – 2026 (USD Billion)
      Fig.5	Global Enterprise Governance, Risk, And Compliance (eGRC) Market Share, by Component, 2019 & 2026 (USD Billion)
      Fig.6	Global Software Enterprise Governance, Risk, And Compliance (eGRC) Market, 2016 – 2026 (USD Billion)
      Fig.7	Global Services Enterprise Governance, Risk, And Compliance (eGRC) Market, 2016 – 2026 (USD Billion)
      Fig.8	Global Enterprise Governance, Risk, And Compliance (eGRC) Market Share, by Type, 2019 & 2026 (USD Billion)
      Fig.9	Global Audit Management Enterprise Governance, Risk, And Compliance (eGRC) Market, 2016 – 2026 (USD Billion)
      Fig.10	Global Compliance Management Enterprise Governance, Risk, And Compliance (eGRC) Market, 2016 – 2026 (USD Billion)
      Fig.11	Global Risk Management  Enterprise Governance, Risk, And Compliance (eGRC) Market, 2016 – 2026 (USD Billion)
      Fig.12	Global Policy Management Enterprise Governance, Risk, And Compliance (eGRC) Market, 2016 – 2026 (USD Billion)
      Fig.13	Global Incident Management  Enterprise Governance, Risk, And Compliance (eGRC) Market, 2016 – 2026 (USD Billion)
      Fig.14	Global Others Enterprise Governance, Risk, And Compliance (eGRC) Market, 2016 – 2026 (USD Billion)
      Fig.15	Global Enterprise Governance, Risk, And Compliance (eGRC) Market Share, by Services, 2019 & 2026 (USD Billion)
      Fig.16	Global Integration  Enterprise Governance, Risk, And Compliance (eGRC) Market, 2016 – 2026 (USD Billion)
      Fig.17	Global Consulting  Enterprise Governance, Risk, And Compliance (eGRC) Market, 2016 – 2026 (USD Billion)
      Fig.18	Global Support Enterprise Governance, Risk, And Compliance (eGRC) Market, 2016 – 2026 (USD Billion)
      Fig.19	Global Enterprise Governance, Risk, And Compliance (eGRC) Market Share, by Enterprise Size, 2019 & 2026 (USD Billion)
      Fig.20	Global SMEs  Enterprise Governance, Risk, And Compliance (eGRC) Market, 2016 – 2026 (USD Billion)
      Fig.21	Global Large Enterprises Enterprise Governance, Risk, And Compliance (eGRC) Market, 2016 – 2026 (USD Billion)
      Fig.22	Global Enterprise Governance, Risk, And Compliance (eGRC) Market Share, by Industry Verticals, 2019 & 2026 (USD Billion)
      Fig.23	Global BSFI Enterprise Governance, Risk, And Compliance (eGRC) Market, 2016 – 2026 (USD Billion)
      Fig.24	Global Construction & Engineering Enterprise Governance, Risk, And Compliance (eGRC) Market, 2016 – 2026 (USD Billion)
      Fig.25	Global Energy & Utilities  Enterprise Governance, Risk, And Compliance (eGRC) Market, 2016 – 2026 (USD Billion)
      Fig.26	Global Healthcare Enterprise Governance, Risk, And Compliance (eGRC) Market, 2016 – 2026 (USD Billion)
      Fig.27	Global Government  Enterprise Governance, Risk, And Compliance (eGRC) Market, 2016 – 2026 (USD Billion)
      Fig.28	Global Manufacturing Enterprise Governance, Risk, And Compliance (eGRC) Market, 2016 – 2026 (USD Billion)
      Fig.29	Global Retail & Consumer Goods Enterprise Governance, Risk, And Compliance (eGRC) Market, 2016 – 2026 (USD Billion)
      Fig.30	Global Telecom & IT Enterprise Governance, Risk, And Compliance (eGRC) Market, 2016 – 2026 (USD Billion)
      Fig.31	Global Others Enterprise Governance, Risk, And Compliance (eGRC) Market, 2016 – 2026 (USD Billion)
      Fig.32	Global Enterprise Governance, Risk, And Compliance (eGRC) Market Share, by Region, 2019 & 2026 (USD Billion)
      Fig.33	North America Enterprise Governance, Risk, And Compliance (eGRC) Market, 2016 – 2026 (USD Billion)
      Fig.34	U.S. Enterprise Governance, Risk, And Compliance (eGRC) Market, 2016 – 2026 (USD Billion)
      Fig.35	Canada Enterprise Governance, Risk, And Compliance (eGRC) Market, 2016 – 2026 (USD Billion)
      Fig.36	Europe Enterprise Governance, Risk, And Compliance (eGRC) Market, 2016 – 2026 (USD Billion)
      Fig.37	Germany Enterprise Governance, Risk, And Compliance (eGRC) Market, 2016 – 2026 (USD Billion)
      Fig.38	France Enterprise Governance, Risk, And Compliance (eGRC) Market, 2016 – 2026 (USD Billion)
      Fig.39	U.K. Enterprise Governance, Risk, And Compliance (eGRC) Market, 2016 – 2026 (USD Billion)
      Fig.40	Italy Enterprise Governance, Risk, And Compliance (eGRC) Market, 2016 – 2026 (USD Billion)
      Fig.41	Spain Enterprise Governance, Risk, And Compliance (eGRC) Market, 2016 – 2026 (USD Billion)
      Fig.42	Rest of Europe Enterprise Governance, Risk, And Compliance (eGRC) Market, 2016 – 2026 (USD Billion)
      Fig.43	Asia Pacific Enterprise Governance, Risk, And Compliance (eGRC) Market, 2016 – 2026 (USD Billion)
      Fig.44	China Enterprise Governance, Risk, And Compliance (eGRC) Market, 2016 – 2026 (USD Billion)
      Fig.45	Japan Enterprise Governance, Risk, And Compliance (eGRC) Market, 2016 – 2026 (USD Billion)
      Fig.46	India Enterprise Governance, Risk, And Compliance (eGRC) Market, 2016 – 2026 (USD Billion)
      Fig.47	South  Korea Enterprise Governance, Risk, And Compliance (eGRC) Market, 2016 – 2026 (USD Billion)
      Fig.48	South-East Asia Enterprise Governance, Risk, And Compliance (eGRC) Market, 2016 – 2026 (USD Billion)
      Fig.49	Rest of Asia Pacific Enterprise Governance, Risk, And Compliance (eGRC) Market, 2016 – 2026 (USD Billion)
      Fig.50	Latin America Enterprise Governance, Risk, And Compliance (eGRC) Market, 2016 – 2026 (USD Billion)
      Fig.51	Brazil Enterprise Governance, Risk, And Compliance (eGRC) Market, 2016 – 2026 (USD Billion)
      Fig.52	Mexico Enterprise Governance, Risk, And Compliance (eGRC) Market, 2016 – 2026 (USD Billion)
      Fig.53	Rest of Latin America Enterprise Governance, Risk, And Compliance (eGRC) Market, 2016 – 2026 (USD Billion)
      Fig.54	The Middle-East and Africa Enterprise Governance, Risk, And Compliance (eGRC) Market, 2016 – 2026 (USD Billion)
      Fig.55	GCC Countries Enterprise Governance, Risk, And Compliance (eGRC) Market, 2016 – 2026 (USD Billion)
      Fig.56	South Africa Enterprise Governance, Risk, And Compliance (eGRC) Market, 2016 – 2026 (USD Billion)
      Fig.57	Rest of Middle-East Africa Enterprise Governance, Risk, And Compliance (eGRC) Market, 2016 – 2026 (USD Billion)
      Fig.58	Competitor Market Share – Revenue
      Fig.59	IBM Revenue and Growth Rate
      Fig.60	IBM Market Share
      Fig.61	Oracle Revenue and Growth Rate
      Fig.62	Oracle Market Share
      Fig.63	SAP Revenue and Growth Rate
      Fig.64	SAP Market Share
      Fig.65	SAS Institute Revenue and Growth Rate
      Fig.66	SAS Institute Market Share
      Fig.67	ServiceNow Revenue and Growth Rate
      Fig.68	ServiceNow Market Share
      Fig.69	Software AG Revenue and Growth Rate
      Fig.70	Software AG Market Share
      Fig.71	RSA Security Revenue and Growth Rate
      Fig.72	RSA Security Market Share
      Fig.73	MEGA International Revenue and Growth Rate
      Fig.74	MEGA International Market Share
      Fig.75	Ideagen Revenue and Growth Rate
      Fig.76	Ideagen Market Share
      Fig.77	Mphasis Revenue and Growth Rate
      Fig.78	Mphasis Market Share
      Fig.79	MetricStream Revenue and Growth Rate
      Fig.80	MetricStream Market Share
      Fig.81	Protiviti Revenue and Growth Rate
      Fig.82	Protiviti Market Share
      Fig.83	SAI Global Revenue and Growth Rate
      Fig.84	SAI Global Market Share
      Fig.85	Process Gene Revenue and Growth Rate
      Fig.86	Process Gene Market Share
      Fig.87	LogicManager Revenue and Growth Rate
      Fig.88	LogicManager Market Share
      Fig.89	Quantivate Revenue and Growth Rate
      Fig.90	Quantivate Market Share
      Fig.91	Riskonnect Revenue and Growth Rate
      Fig.92	Riskonnect Market Share
      Fig.93	NAVEX Global Revenue and Growth Rate
      Fig.94	NAVEX Global Market Share
      Fig.95	Alyne Revenue and Growth Rate
      Fig.96	Alyne Market Share
      Fig.97	Lexcomply Revenue and Growth Rate
      Fig.98	Lexcomply Market Share
      Fig.99	StandardFusion Revenue and Growth Rate
      Fig.100	StandardFusion Market Share
      Fig.101	FIS Revenue and Growth Rate
      Fig.102	FIS Market Share
      Fig.103	Market Dynamics
      Fig.104	Global Enterprise Governance, Risk, And Compliance (eGRC) – Value Chain Analysis
      Fig.105	Key Mandates and Regulations
      Fig.106	Technology Roadmap and Timeline
      Fig.107	Market Attractiveness Analysis – By Component
      Fig.108	Market Attractiveness Analysis – By Type
      Fig.109	Market Attractiveness Analysis – By Services
      Fig.110	Market Attractiveness Analysis – By Enterprise Size
      Fig.111	Market Attractiveness Analysis – By Industry Verticals
      Fig.112	Market Attractiveness Analysis – By Region
      Fig.113	Enterprise Governance, Risk, And Compliance (eGRC) Industrial Chain Analysis
      Fig.114	Market Channels
      Fig.115	Marketing Channel Development Trend
      Fig.116	Growth in World Gross Product, 2008-2018
      

      List of Tables

      Table 1	Global Enterprise Governance, Risk, And Compliance (eGRC) Market, 2019 & 2026 (USD Billion)
      Table 2	Global Enterprise Governance, Risk, And Compliance (eGRC) Market, by Component, 2016 – 2026 (USD Billion)
      Table 3	Global Enterprise Governance, Risk, And Compliance (eGRC) Market, by Type, 2016 – 2026 (USD Billion)
      Table 4	Global Enterprise Governance, Risk, And Compliance (eGRC) Market, by Services, 2016 – 2026 (USD Billion)
      Table 5	Global Enterprise Governance, Risk, And Compliance (eGRC) Market, by Enterprise Size, 2016 – 2026 (USD Billion)
      Table 6	Global Enterprise Governance, Risk, And Compliance (eGRC) Market, by Industry Verticals, 2016 – 2026 (USD Billion)
      Table 7	Global Enterprise Governance, Risk, And Compliance (eGRC) Market, by Region, 2016 – 2026 (USD Billion)
      Table 8	North America Enterprise Governance, Risk, And Compliance (eGRC) Market, by Country, 2016 – 2026 (USD Billion)
      Table 9 North America Enterprise Governance, Risk, And Compliance (eGRC) Market, by Component, 2016 – 2026 (USD Billion)
      Table 10 North America Enterprise Governance, Risk, And Compliance (eGRC) Market, by Type, 2016 – 2026 (USD Billion)
      Table 11 North America Enterprise Governance, Risk, And Compliance (eGRC) Market, by Services, 2016 – 2026 (USD Billion)
      Table 12 North America Enterprise Governance, Risk, And Compliance (eGRC) Market, by Enterprise Size, 2016 – 2026 (USD Billion)
      Table 13 North America Enterprise Governance, Risk, And Compliance (eGRC) Market, by Industry Verticals, 2016 – 2026 (USD Billion)
      Table 14 Europe Enterprise Governance, Risk, And Compliance (eGRC) Market, by Country, 2016 – 2026 (USD Billion)
      Table 15 Europe Enterprise Governance, Risk, And Compliance (eGRC) Market, by Component, 2016 – 2026 (USD Billion)
      Table 16 Europe Enterprise Governance, Risk, And Compliance (eGRC) Market, by Type, 2016 – 2026 (USD Billion)
      Table 17 Europe Enterprise Governance, Risk, And Compliance (eGRC) Market, by Services, 2016 – 2026 (USD Billion)
      Table 18 Europe Enterprise Governance, Risk, And Compliance (eGRC) Market, by Enterprise Size, 2016 – 2026 (USD Billion)
      Table 19 Europe Enterprise Governance, Risk, And Compliance (eGRC) Market, by Industry Verticals, 2016 – 2026 (USD Billion)
      Table 20 Asia Pacific Enterprise Governance, Risk, And Compliance (eGRC) Market, by Country, 2016 – 2026 (USD Billion)
      Table 21 Asia Pacific Enterprise Governance, Risk, And Compliance (eGRC) Market, by Component, 2016 – 2026 (USD Billion)
      Table 22 Asia Pacific Enterprise Governance, Risk, And Compliance (eGRC) Market, by Type, 2016 – 2026 (USD Billion)
      Table 23 Asia Pacific Enterprise Governance, Risk, And Compliance (eGRC) Market, by Services, 2016 – 2026 (USD Billion)
      Table 24 Asia Pacific Enterprise Governance, Risk, And Compliance (eGRC) Market, by Enterprise Size, 2016 – 2026 (USD Billion)
      Table 25 Asia Pacific Enterprise Governance, Risk, And Compliance (eGRC) Market, by Industry Verticals, 2016 – 2026 (USD Billion)
      Table 26 Latin America Enterprise Governance, Risk, And Compliance (eGRC) Market, by Country, 2016 – 2026 (USD Billion)
      Table 27 Latin America Enterprise Governance, Risk, And Compliance (eGRC) Market, by Component, 2016 – 2026 (USD Billion)
      Table 28 Latin America Enterprise Governance, Risk, And Compliance (eGRC) Market, by Type, 2016 – 2026 (USD Billion)
      Table 29 Latin America Enterprise Governance, Risk, And Compliance (eGRC) Market, by Services, 2016 – 2026 (USD Billion)
      Table 30 Latin America Enterprise Governance, Risk, And Compliance (eGRC) Market, by Enterprise Size, 2016 – 2026 (USD Billion)
      Table 31 Latin America Enterprise Governance, Risk, And Compliance (eGRC) Market, by Industry Verticals, 2016 – 2026 (USD Billion)
      Table 32 The Middle-East and Africa Enterprise Governance, Risk, And Compliance (eGRC) Market, by Country, 2016 – 2026 (USD Billion)
      Table 33 The Middle-East and Africa Enterprise Governance, Risk, And Compliance (eGRC) Market, by Component, 2016 – 2026 (USD Billion)
      Table 34 The Middle-East and Africa Enterprise Governance, Risk, And Compliance (eGRC) Market, by Type, 2016 – 2026 (USD Billion)
      Table 35 The Middle-East and Africa Enterprise Governance, Risk, And Compliance (eGRC) Market, by Services, 2016 – 2026 (USD Billion)
      Table 36 The Middle-East and Africa Enterprise Governance, Risk, And Compliance (eGRC) Market, by Enterprise Size, 2016 – 2026 (USD Billion)
      Table 37 The Middle-East and Africa Enterprise Governance, Risk, And Compliance (eGRC) Market, by Industry Verticals, 2016 – 2026 (USD Billion)
      Table 38 Global Enterprise Governance, Risk, And Compliance (eGRC) Market - Company Revenue Analysis, 2016 – 2019 (USD Billion)
      Table 39 Global Enterprise Governance, Risk, And Compliance (eGRC) Market - Company Revenue Share Analysis, 2016 – 2019 (%)
      Table 40 Acquisitions and Mergers
      Table 41 Market Drivers – Impact Analysis
      Table 42 Market Restraints
      Table 43 Market Opportunities
      Table 44 Major Buyers of Enterprise Governance, Risk, And Compliance (eGRC)
      Table 45 Distributors/Traders of Enterprise Governance, Risk, And Compliance (eGRC) by Region
      

Industry Major Market Players

  • IBM
  • Oracle
  • SAP
  • SAS Institute
  • ServiceNow
  • Software AG
  • RSA Security
  • MEGA International
  • Ideagen
  • Mphasis
  • MetricStream
  • Protiviti
  • SAI Global
  • Process Gene
  • LogicManager
  • Quantivate
  • Riskonnect
  • NAVEX Global
  • Alyne
  • Lexcomply
  • StandardFusion
  • FIS