Search Market Research Report

Discover Our Latest Reports
Discover Our Featured Reports
Discover Top Selling Reports

Energy Harvesting System Market Size, Share Global Analysis Report, 2021 – 2026

report img

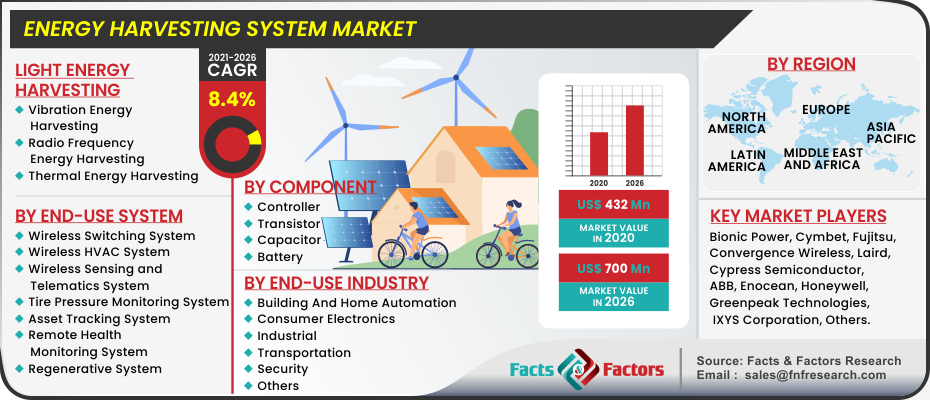
Energy Harvesting System Market By Technology (Light Energy Harvesting, Vibration Energy Harvesting, Radio Frequency Energy Harvesting, and Thermal Energy Harvesting), By End-use system (Wireless Switching System, Wireless HVAC System, Wireless Sensing and Telematics System, Tire Pressure Monitoring System, Asset Tracking System, Remote Health Monitoring System, and Regenerative Energy Harvesting System), By Component (Controller, Transistor, Capacitor, and Battery), By End-Use Industry (Building And Home Automation, Consumer Electronics, Industrial, Transportation, Security, and Others) By Region: Global & Regional Industry Perspective, Comprehensive Analysis, and Forecast 2021 – 2026

Industry Insights

[197+ Pages Report] According to a recent survey issued by Facts and Factors, the global energy harvesting systems market was valued at about USD 432 Million in 2020 and is predicted to reach USD 700 Million by the end of financial year 2026, rising at a CAGR of nearly 8.4% between 2021 and 2026.

logoMarket Overview     

Energy harvesting is the process of obtaining energy from external sources, then capturing and storing it. Wireless autonomous devices, including wearable electronics and wireless sensor networks, are commonly exposed to this technique. This method usually uses less energy for low-power devices and incorporates electrical circuitry for storage unit management and protection. An electrical circuit, sensing components (sensors and transducers), and a storage unit make up the power extraction system. The energy harvesting system charges the transducer with unconventional energy sources, which are then transformed into electricity and stored in the battery unit. A supplementary electronic circuit manages the produced power and protects the storage unit and principal circuitry in the system. The sensing elements act as a converter, converting physical energy (such as light, heat, vibration, pressure, salinity gradients, and radiofrequency) into electrical energy. This electrical energy is either stored in batteries, thin-film capacitors, supercapacitors, ultracapacitors, or utilized to power low-power electronic circuits.

Energy Harvesting System Market

To know more about this report | Request Free Sample Copy

logoIndustry Growth Factors

The energy harvesting systems market is anticipated to be driven by rising demand for safe, energy-efficient, and long-lasting systems that require little or no maintenance during the forecast period. The growing IoT trend would effectively raise the requirement for energy-efficient and wireless sensors autonomous systems. As a result, the need for efficient energy harvesting devices will increase, reducing the requirement for battery charging and lowering overall costs. As a result, IoT intervention in a variety of industrial and non-industrial applications will increase market demand for energy harvesting systems within the forecast period. The higher initial cost of energy harvesting systems, as well as the restrictions of remotely deployed networking modules, are two major factors that are hindering the energy harvesting systems industry's growth.

logoGlobal Energy Harvesting System Market - Segmentation

The global energy harvesting system market is segregated based on end-use system, technology, component, end-use industry, and region. On the basis of technology, the global energy harvesting system industry is categorized into vibration energy harvesting, light energy harvesting, thermal energy harvesting, and radiofrequency energy harvesting. Based on the End-use system, the global energy harvesting system industry is categorized into the wireless HVAC system, wireless switching system, tire pressure monitoring system, wireless sensing and telematics system, remote health monitoring system, asset tracking system, and regenerative energy harvesting system. Based on components, the global Energy Harvesting System industry is categorized into power management ic (PMIC), transducers, and secondary batteries. Based on the end-use industry, the global energy harvesting system industry is categorized into consumer electronics, industrial, transportation, building and home automation, security, and others.     

logoReport Scope

Report Attribute

Details

Market Size in 2020

USD 432 Million

Projected Market Size in 2026

USD 700 Million

CAGR Growth Rate

8.4% CAGR

Base Year

2020

Forecast Years

2021-2026

Key Market Players

Bionic Power, Convergence Wireless, Cymbet, Cypress Semiconductor, ABB, Enocean, Fujitsu, Greenpeak Technologies, Honeywell, IXYS Corporation, Laird, Linear Technology, Lord Microstrain, Microchip Technology, MIDE Technology, O-Flexx Technologies, Powercast Corporation, Stmicroelectronics, Texas Instruments, Voltree Power. amongst others.

Key Segment

By Light, End-use, Component, End-use, and Region

Major Regions Covered

North America, Europe, Asia Pacific, Latin America, and the Middle East & Africa

Purchase Options

Request customized purchase options to meet your research needs.Explore purchase options

logoGlobal Energy Harvesting System Market - Regional Analysis

In 2020, North America is likely to be the leading regional energy harvesting systems market. Energy With the region's rapid technical advancements, it has emerged as the most important market for building and home automation investments that use renewable energy and drive the market for energy harvesting systems. In the North American area, the United States accounted for the majority of the income. The market is anticipated to develop significantly as a result of the country's thriving industrial and transportation sectors, which are influenced by the administration's goal of making the country energy self-sufficient. The North American market has seen a high level of industrial IoT adoption compared to other regions, which also drives demand for energy recovery systems. Government attempts to reduce energy emissions from historic and public buildings have supported this rise.

logoGlobal Energy Harvesting System Market - Competitive Players

Some main participants of the worldwide energy harvesting system market are :

  • Bionic Power
  • Convergence Wireless
  • Cymbet
  • Cypress Semiconductor
  • ABB
  • Enocean
  • Fujitsu
  • Greenpeak Technologies
  • Honeywell
  • IXYS Corporation
  • Laird
  • Linear Technology
  • Lord Microstrain
  • Microchip Technology
  • MIDE Technology
  • O-Flexx Technologies
  • Powercast Corporation
  • Stmicroelectronics
  • Texas Instruments
  • Voltree Power

logoGlobal Energy Harvesting System Market - Light Energy Harvesting:

  • Vibration Energy Harvesting
  • Radio Frequency Energy Harvesting
  • Thermal Energy Harvesting

logoGlobal Energy Harvesting System Market - By End-use system:

  • Wireless Switching System
  • Wireless HVAC System
  • Wireless Sensing and Telematics System
  • Tire Pressure Monitoring System
  • Asset Tracking System
  • Remote Health Monitoring System
  • Regenerative Energy Harvesting System

logoGlobal Energy Harvesting System Market - By Component:

  • Controller
  • Transistor
  • Capacitor
  • Battery

logoGlobal Energy Harvesting System Market - By End-use Industry:

  • Building And Home Automation
  • Consumer Electronics
  • Industrial
  • Transportation
  • Security
  • Others

logoGlobal Energy Harvesting System Market - By Region:

  • North America
    • The U.S.
    • Canada
  • Europe
    • France
    • The UK
    • Spain
    • Germany
    • Italy
    • Rest of Europe
  • Asia Pacific
    • China
    • Japan
    • India
    • South Korea
    • Southeast Asia
    • Rest of Asia Pacific
  • Latin America
    • Brazil
    • Mexico
    • Rest of Latin America
  • Middle East & Africa
    • GCC Countries
    • South Africa
    • Rest of Middle East & Africa

Table of Content

  1. Chapter 1 Executive Summary
    1. 1.1. Introduction of Energy Harvesting System
    2. 1.2. Global Energy Harvesting System Market, 2020 & 2026 (USD Million)
    3. 1.3. Global Energy Harvesting System Market, 2016 – 2026 (USD Million)
    4. 1.4. Global Energy Harvesting System Market Absolute Revenue Opportunity, 2016 – 2026 (USD Million)
    5. 1.5. Global Energy Harvesting System Market Incremental Revenue Opportunity, 2020 – 2026 (USD Million)
  2. Chapter 2 Energy Harvesting System Market – Technology Analysis
    1. 2.1. Global Energy Harvesting System Market – Technology Overview
    2. 2.2. Global Energy Harvesting System Market Share, by Technology, 2020 & 2026 (USD Million)
    3. 2.3. Light Energy Harvesting
      1. 2.3.1. Global Light Energy Harvesting Energy Harvesting System Market, 2016 – 2026 (USD Million)
    4. 2.4. Vibration Energy Harvesting
      1. 2.4.1. Global Vibration Energy Harvesting Energy Harvesting System Market, 2016 – 2026 (USD Million)
    5. 2.5. Radio Frequency Energy Harvesting
      1. 2.5.1. Global Radio Frequency Energy Harvesting Energy Harvesting System Market, 2016 – 2026 (USD Million)
    6. 2.6. Thermal Energy Harvesting
      1. 2.6.1. Global Thermal Energy Harvesting Energy Harvesting System Market, 2016 – 2026 (USD Million)
  3. Chapter 3 Energy Harvesting System Market – End-use system Analysis
    1. 3.1. Global Energy Harvesting System Market – End-use system Overview
    2. 3.2. Global Energy Harvesting System Market Share, by End-use system, 2020 & 2026 (USD Million)
    3. 3.3. Wireless Switching System
      1. 3.3.1. Global Wireless Switching System Energy Harvesting System Market, 2016 – 2026 (USD Million)
    4. 3.4. Wireless HVAC System
      1. 3.4.1. Global Wireless HVAC System Energy Harvesting System Market, 2016 – 2026 (USD Million)
    5. 3.5. Wireless Sensing and Telematics System
      1. 3.5.1. Global Wireless Sensing and Telematics System Energy Harvesting System Market, 2016 – 2026 (USD Million)
    6. 3.6. Tire Pressure Monitoring System
      1. 3.6.1. Global Tire Pressure Monitoring System Energy Harvesting System Market, 2016 – 2026 (USD Million)
    7. 3.7. Asset Tracking System
      1. 3.7.1. Global Asset Tracking System Energy Harvesting System Market, 2016 – 2026 (USD Million)
    8. 3.8. Remote Health Monitoring System
      1. 3.8.1. Global Remote Health Monitoring System Energy Harvesting System Market, 2016 – 2026 (USD Million)
    9. 3.9. Regenerative Energy Harvesting System
      1. 3.9.1. Global Regenerative Energy Harvesting System Energy Harvesting System Market, 2016 – 2026 (USD Million)
  4. Chapter 4 Energy Harvesting System Market – Component Analysis
    1. 4.1. Global Energy Harvesting System Market – Component Overview
    2. 4.2. Global Energy Harvesting System Market Share, by Component, 2020 & 2026 (USD Million)
    3. 4.3. Controller
      1. 4.3.1. Global Controller Energy Harvesting System Market, 2016 – 2026 (USD Million)
    4. 4.4. Transistor
      1. 4.4.1. Global Transistor Energy Harvesting System Market, 2016 – 2026 (USD Million)
    5. 4.5. Capacitor
      1. 4.5.1. Global Capacitor Energy Harvesting System Market, 2016 – 2026 (USD Million)
    6. 4.6. Battery
      1. 4.6.1. Global Battery Energy Harvesting System Market, 2016 – 2026 (USD Million)
  5. Chapter 5 Energy Harvesting System Market – End-use Industry Analysis
    1. 5.1. Global Energy Harvesting System Market – End-use Industry Overview
    2. 5.2. Global Energy Harvesting System Market Share, by End-use Industry, 2020 & 2026 (USD Million)
    3. 5.3. Building And Home Automation
      1. 5.3.1. Global Building And Home Automation Energy Harvesting System Market, 2016 – 2026 (USD Million)
    4. 5.4. Consumer Electronics
      1. 5.4.1. Global Consumer Electronics Energy Harvesting System Market, 2016 – 2026 (USD Million)
    5. 5.5. Industrial
      1. 5.5.1. Global Industrial Energy Harvesting System Market, 2016 – 2026 (USD Million)
    6. 5.6. Transportation
      1. 5.6.1. Global Transportation Energy Harvesting System Market, 2016 – 2026 (USD Million)
    7. 5.7. Security
      1. 5.7.1. Global Security Energy Harvesting System Market, 2016 – 2026 (USD Million)
    8. 5.8. Others
      1. 5.8.1. Global Others Energy Harvesting System Market, 2016 – 2026 (USD Million)
  6. Chapter 6 Energy Harvesting System Market – Regional Analysis
    1. 6.1. Global Energy Harvesting System Market Regional Overview
    2. 6.2. Global Energy Harvesting System Market Share, by Region, 2020 & 2026 (USD Million)
    3. 6.3. North America
      1. 6.3.1. North America Energy Harvesting System Market, 2016 – 2026 (USD Million)
        1. 6.3.1.1. North America Energy Harvesting System Market, by Country, 2016 - 2026 (USD Million)
      2. 6.3.2. North America Energy Harvesting System Market, by Technology, 2016 – 2026
        1. 6.3.2.1. North America Energy Harvesting System Market, by Technology, 2016 – 2026 (USD Million)
      3. 6.3.3. North America Energy Harvesting System Market, by End-use system, 2016 – 2026
        1. 6.3.3.1. North America Energy Harvesting System Market, by End-use system, 2016 – 2026 (USD Million)
      4. 6.3.4. North America Energy Harvesting System Market, by Component, 2016 – 2026
        1. 6.3.4.1. North America Energy Harvesting System Market, by Component, 2016 – 2026 (USD Million)
      5. 6.3.5. North America Energy Harvesting System Market, by End-use Industry, 2016 – 2026
        1. 6.3.5.1. North America Energy Harvesting System Market, by End-use Industry, 2016 – 2026 (USD Million)
      6. 6.3.6. U.S.
        1. 6.3.6.1. U.S. Energy Harvesting System Market, 2016 – 2026 (USD Million)
      7. 6.3.7. Canada
        1. 6.3.7.1. Canada Energy Harvesting System Market, 2016 – 2026 (USD Million)
    4. 6.4. Europe
      1. 6.4.1. Europe Energy Harvesting System Market, 2016 – 2026 (USD Million)
        1. 6.4.1.1. Europe Energy Harvesting System Market, by Country, 2016 - 2026 (USD Million)
      2. 6.4.2. Europe Energy Harvesting System Market, by Technology, 2016 – 2026
        1. 6.4.2.1. Europe Energy Harvesting System Market, by Technology, 2016 – 2026 (USD Million)
      3. 6.4.3. Europe Energy Harvesting System Market, by End-use system, 2016 – 2026
        1. 6.4.3.1. Europe Energy Harvesting System Market, by End-use system, 2016 – 2026 (USD Million)
      4. 6.4.4. Europe Energy Harvesting System Market, by Component, 2016 – 2026
        1. 6.4.4.1. Europe Energy Harvesting System Market, by Component, 2016 – 2026 (USD Million)
      5. 6.4.5. Europe Energy Harvesting System Market, by End-use Industry, 2016 – 2026
        1. 6.4.5.1. Europe Energy Harvesting System Market, by End-use Industry, 2016 – 2026 (USD Million)
      6. 6.4.6. Germany
        1. 6.4.6.1. Germany Energy Harvesting System Market, 2016 – 2026 (USD Million)
      7. 6.4.7. France
        1. 6.4.7.1. France Energy Harvesting System Market, 2016 – 2026 (USD Million)
      8. 6.4.8. U.K.
        1. 6.4.8.1. U.K. Energy Harvesting System Market, 2016 – 2026 (USD Million)
      9. 6.4.9. Italy
        1. 6.4.9.1. Italy Energy Harvesting System Market, 2016 – 2026 (USD Million)
      10. 6.4.10. Spain
        1. 6.4.10.1. Spain Energy Harvesting System Market, 2016 – 2026 (USD Million)
      11. 6.4.11. Rest of Europe
        1. 6.4.11.1. Rest of Europe Energy Harvesting System Market, 2016 – 2026 (USD Million)
    5. 6.5. Asia Pacific
      1. 6.5.1. Asia Pacific Energy Harvesting System Market, 2016 – 2026 (USD Million)
        1. 6.5.1.1. Asia Pacific Energy Harvesting System Market, by Country, 2016 - 2026 (USD Million)
      2. 6.5.2. Asia Pacific Energy Harvesting System Market, by Technology, 2016 – 2026
        1. 6.5.2.1. Asia Pacific Energy Harvesting System Market, by Technology, 2016 – 2026 (USD Million)
      3. 6.5.3. Asia Pacific Energy Harvesting System Market, by End-use system, 2016 – 2026
        1. 6.5.3.1. Asia Pacific Energy Harvesting System Market, by End-use system, 2016 – 2026 (USD Million)
      4. 6.5.4. Asia Pacific Energy Harvesting System Market, by Component, 2016 – 2026
        1. 6.5.4.1. Asia Pacific Energy Harvesting System Market, by Component, 2016 – 2026 (USD Million)
      5. 6.5.5. Asia Pacific Energy Harvesting System Market, by End-use Industry, 2016 – 2026
        1. 6.5.5.1. Asia Pacific Energy Harvesting System Market, by End-use Industry, 2016 – 2026 (USD Million)
      6. 6.5.6. China
        1. 6.5.6.1. China Energy Harvesting System Market, 2016 – 2026 (USD Million)
      7. 6.5.7. Japan
        1. 6.5.7.1. Japan Energy Harvesting System Market, 2016 – 2026 (USD Million)
      8. 6.5.8. India
        1. 6.5.8.1. India Energy Harvesting System Market, 2016 – 2026 (USD Million)
      9. 6.5.9. South Korea
        1. 6.5.9.1. South Korea Energy Harvesting System Market, 2016 – 2026 (USD Million)
      10. 6.5.10. South-East Asia
        1. 6.5.10.1. South-East Asia Energy Harvesting System Market, 2016 – 2026 (USD Million)
      11. 6.5.11. Rest of Asia Pacific
        1. 6.5.11.1. Rest of Asia Pacific Energy Harvesting System Market, 2016 – 2026 (USD Million)
    6. 6.6. Latin America
      1. 6.6.1. Latin America Energy Harvesting System Market, 2016 – 2026 (USD Million)
        1. 6.6.1.1. Latin America Energy Harvesting System Market, by Country, 2016 - 2026 (USD Million)
      2. 6.6.2. Latin America Energy Harvesting System Market, by Technology, 2016 – 2026
        1. 6.6.2.1. Latin America Energy Harvesting System Market, by Technology, 2016 – 2026 (USD Million)
      3. 6.6.3. Latin America Energy Harvesting System Market, by End-use system, 2016 – 2026
        1. 6.6.3.1. Latin America Energy Harvesting System Market, by End-use system, 2016 – 2026 (USD Million)
      4. 6.6.4. Latin America Energy Harvesting System Market, by Component, 2016 – 2026
        1. 6.6.4.1. Latin America Energy Harvesting System Market, by Component, 2016 – 2026 (USD Million)
      5. 6.6.5. Latin America Energy Harvesting System Market, by End-use Industry, 2016 – 2026
        1. 6.6.5.1. Latin America Energy Harvesting System Market, by End-use Industry, 2016 – 2026 (USD Million)
      6. 6.6.6. Brazil
        1. 6.6.6.1. Brazil Energy Harvesting System Market, 2016 – 2026 (USD Million)
      7. 6.6.7. Mexico
        1. 6.6.7.1. Mexico Energy Harvesting System Market, 2016 – 2026 (USD Million)
      8. 6.6.8. Rest of Latin America
        1. 6.6.8.1. Rest of Latin America Energy Harvesting System Market, 2016 – 2026 (USD Million)
    7. 6.7. The Middle-East and Africa
      1. 6.7.1. The Middle-East and Africa Energy Harvesting System Market, 2016 – 2026 (USD Million)
        1. 6.7.1.1. The Middle-East and Africa Energy Harvesting System Market, by Country, 2016 - 2026 (USD Million)
      2. 6.7.2. The Middle-East and Africa Energy Harvesting System Market, by Technology, 2016 – 2026
        1. 6.7.2.1. The Middle-East and Africa Energy Harvesting System Market, by Technology, 2016 – 2026 (USD Million)
      3. 6.7.3. The Middle-East and Africa Energy Harvesting System Market, by End-use system, 2016 – 2026
        1. 6.7.3.1. The Middle-East and Africa Energy Harvesting System Market, by End-use system, 2016 – 2026 (USD Million)
      4. 6.7.4. The Middle-East and Africa Energy Harvesting System Market, by Component, 2016 – 2026
        1. 6.7.4.1. The Middle-East and Africa Energy Harvesting System Market, by Component, 2016 – 2026 (USD Million)
      5. 6.7.5. The Middle-East and Africa Energy Harvesting System Market, by End-use Industry, 2016 – 2026
        1. 6.7.5.1. The Middle-East and Africa Energy Harvesting System Market, by End-use Industry, 2016 – 2026 (USD Million)
      6. 6.7.6. GCC Countries
        1. 6.7.6.1. GCC Countries Energy Harvesting System Market, 2016 – 2026 (USD Million)
      7. 6.7.7. South Africa
        1. 6.7.7.1. South Africa Energy Harvesting System Market, 2016 – 2026 (USD Million)
      8. 6.7.8. Rest of Middle-East Africa
        1. 6.7.8.1. Rest of Middle-East Africa Energy Harvesting System Market, 2016 – 2026 (USD Million)
  7. Chapter 7 Energy Harvesting System Market – Competitive Landscape
    1. 7.1. Competitor Market Share – Revenue
    2. 7.2. Market Concentration Rate Analysis, Top 3 and Top 5 Players
    3. 7.3. Strategic Developments
      1. 7.3.1. Acquisitions and Mergers
      2. 7.3.2. New Products
      3. 7.3.3. Research & Development Activities
  8. Chapter 8 Company Profiles
    1. 8.1. ABB
      1. 8.1.1. Company Overview
      2. 8.1.2. Product/Service Portfolio
      3. 8.1.3. ABB Sales, Revenue, and Gross Margin
      4. 8.1.4. ABB Revenue and Growth Rate
      5. 8.1.5. ABB Market Share
      6. 8.1.6. Recent Initiatives, Funding/VC Activities, and Technological Innovations
    2. 8.2. Bionic Power
      1. 8.2.1. Company Overview
      2. 8.2.2. Product/Service Portfolio
      3. 8.2.3. Bionic Power Sales, Revenue, and Gross Margin
      4. 8.2.4. Bionic Power Revenue and Growth Rate
      5. 8.2.5. Bionic Power Market Share
      6. 8.2.6. Recent Initiatives, Funding/VC Activities, and Technological Innovations
    3. 8.3. Convergence Wireless
      1. 8.3.1. Company Overview
      2. 8.3.2. Product/Service Portfolio
      3. 8.3.3. Convergence Wireless Sales, Revenue, and Gross Margin
      4. 8.3.4. Convergence Wireless Revenue and Growth Rate
      5. 8.3.5. Convergence Wireless Market Share
      6. 8.3.6. Recent Initiatives, Funding/VC Activities, and Technological Innovations
    4. 8.4. Cymbet
      1. 8.4.1. Company Overview
      2. 8.4.2. Product/Service Portfolio
      3. 8.4.3. Cymbet Sales, Revenue, and Gross Margin
      4. 8.4.4. Cymbet Revenue and Growth Rate
      5. 8.4.5. Cymbet Market Share
      6. 8.4.6. Recent Initiatives, Funding/VC Activities, and Technological Innovations
    5. 8.5. Cypress Semiconductor
      1. 8.5.1. Company Overview
      2. 8.5.2. Product/Service Portfolio
      3. 8.5.3. Cypress Semiconductor Sales, Revenue, and Gross Margin
      4. 8.5.4. Cypress Semiconductor Revenue and Growth Rate
      5. 8.5.5. Cypress Semiconductor Market Share
      6. 8.5.6. Recent Initiatives, Funding/VC Activities, and Technological Innovations
    6. 8.6. Enocean
      1. 8.6.1. Company Overview
      2. 8.6.2. Product/Service Portfolio
      3. 8.6.3. Enocean Sales, Revenue, and Gross Margin
      4. 8.6.4. Enocean Revenue and Growth Rate
      5. 8.6.5. Enocean Market Share
      6. 8.6.6. Recent Initiatives, Funding/VC Activities, and Technological Innovations
    7. 8.7. Fujitsu
      1. 8.7.1. Company Overview
      2. 8.7.2. Product/Service Portfolio
      3. 8.7.3. Fujitsu Sales, Revenue, and Gross Margin
      4. 8.7.4. Fujitsu Revenue and Growth Rate
      5. 8.7.5. Fujitsu Market Share
      6. 8.7.6. Recent Initiatives, Funding/VC Activities, and Technological Innovations
    8. 8.8. Greenpeak Technologies
      1. 8.8.1. Company Overview
      2. 8.8.2. Product/Service Portfolio
      3. 8.8.3. Greenpeak Technologies Sales, Revenue, and Gross Margin
      4. 8.8.4. Greenpeak Technologies Revenue and Growth Rate
      5. 8.8.5. Greenpeak Technologies Market Share
      6. 8.8.6. Recent Initiatives, Funding/VC Activities, and Technological Innovations
    9. 8.9. Honeywell
      1. 8.9.1. Company Overview
      2. 8.9.2. Product/Service Portfolio
      3. 8.9.3. Honeywell Sales, Revenue, and Gross Margin
      4. 8.9.4. Honeywell Revenue and Growth Rate
      5. 8.9.5. Honeywell Market Share
      6. 8.9.6. Recent Initiatives, Funding/VC Activities, and Technological Innovations
    10. 8.10. IXYS Corporation
      1. 8.10.1. Company Overview
      2. 8.10.2. Product/Service Portfolio
      3. 8.10.3. IXYS Corporation Sales, Revenue, and Gross Margin
      4. 8.10.4. IXYS Corporation Revenue and Growth Rate
      5. 8.10.5. IXYS Corporation Market Share
      6. 8.10.6. Recent Initiatives, Funding/VC Activities, and Technological Innovations
    11. 8.11. Laird
      1. 8.11.1. Company Overview
      2. 8.11.2. Product/Service Portfolio
      3. 8.11.3. Laird Sales, Revenue, and Gross Margin
      4. 8.11.4. Laird Revenue and Growth Rate
      5. 8.11.5. Laird Market Share
      6. 8.11.6. Recent Initiatives, Funding/VC Activities, and Technological Innovations
    12. 8.12. Linear Technology
      1. 8.12.1. Company Overview
      2. 8.12.2. Product/Service Portfolio
      3. 8.12.3. Linear Technology Sales, Revenue, and Gross Margin
      4. 8.12.4. Linear Technology Revenue and Growth Rate
      5. 8.12.5. Linear Technology Market Share
      6. 8.12.6. Recent Initiatives, Funding/VC Activities, and Technological Innovations
    13. 8.13. Lord Microstrain
      1. 8.13.1. Company Overview
      2. 8.13.2. Product/Service Portfolio
      3. 8.13.3. Lord Microstrain Sales, Revenue, and Gross Margin
      4. 8.13.4. Lord Microstrain Revenue and Growth Rate
      5. 8.13.5. Lord Microstrain Market Share
      6. 8.13.6. Recent Initiatives, Funding/VC Activities, and Technological Innovations
    14. 8.14. Microchip Technology
      1. 8.14.1. Company Overview
      2. 8.14.2. Product/Service Portfolio
      3. 8.14.3. Microchip Technology Sales, Revenue, and Gross Margin
      4. 8.14.4. Microchip Technology Revenue and Growth Rate
      5. 8.14.5. Microchip Technology Market Share
      6. 8.14.6. Recent Initiatives, Funding/VC Activities, and Technological Innovations
    15. 8.15. MIDE Technology
      1. 8.15.1. Company Overview
      2. 8.15.2. Product/Service Portfolio
      3. 8.15.3. MIDE Technology Sales, Revenue, and Gross Margin
      4. 8.15.4. MIDE Technology Revenue and Growth Rate
      5. 8.15.5. MIDE Technology Market Share
      6. 8.15.6. Recent Initiatives, Funding/VC Activities, and Technological Innovations
    16. 8.16. O-Flexx Technologies
      1. 8.16.1. Company Overview
      2. 8.16.2. Product/Service Portfolio
      3. 8.16.3. O-Flexx Technologies Sales, Revenue, and Gross Margin
      4. 8.16.4. O-Flexx Technologies Revenue and Growth Rate
      5. 8.16.5. O-Flexx Technologies Market Share
      6. 8.16.6. Recent Initiatives, Funding/VC Activities, and Technological Innovations
    17. 8.17. Powercast Corporation
      1. 8.17.1. Company Overview
      2. 8.17.2. Product/Service Portfolio
      3. 8.17.3. Powercast Corporation Sales, Revenue, and Gross Margin
      4. 8.17.4. Powercast Corporation Revenue and Growth Rate
      5. 8.17.5. Powercast Corporation Market Share
      6. 8.17.6. Recent Initiatives, Funding/VC Activities, and Technological Innovations
    18. 8.18. Stmicroelectronics
      1. 8.18.1. Company Overview
      2. 8.18.2. Product/Service Portfolio
      3. 8.18.3. Stmicroelectronics Sales, Revenue, and Gross Margin
      4. 8.18.4. Stmicroelectronics Revenue and Growth Rate
      5. 8.18.5. Stmicroelectronics Market Share
      6. 8.18.6. Recent Initiatives, Funding/VC Activities, and Technological Innovations
    19. 8.19. Texas Instruments
      1. 8.19.1. Company Overview
      2. 8.19.2. Product/Service Portfolio
      3. 8.19.3. Texas Instruments Sales, Revenue, and Gross Margin
      4. 8.19.4. Texas Instruments Revenue and Growth Rate
      5. 8.19.5. Texas Instruments Market Share
      6. 8.19.6. Recent Initiatives, Funding/VC Activities, and Technological Innovations
    20. 8.20. Voltree Power
      1. 8.20.1. Company Overview
      2. 8.20.2. Product/Service Portfolio
      3. 8.20.3. Voltree Power Sales, Revenue, and Gross Margin
      4. 8.20.4. Voltree Power Revenue and Growth Rate
      5. 8.20.5. Voltree Power Market Share
      6. 8.20.6. Recent Initiatives, Funding/VC Activities, and Technological Innovations
  9. Chapter 9 Energy Harvesting System — Industry Analysis
    1. 9.1. Introduction and Taxonomy
    2. 9.2. Energy Harvesting System Market – Key Trends
      1. 9.2.1. Market Drivers
      2. 9.2.2. Market Restraints
      3. 9.2.3. Market Opportunities
    3. 9.3. Value Chain Analysis
    4. 9.4. Key Mandates and Regulations
    5. 9.5. Technology Roadmap and Timeline
    6. 9.6. Energy Harvesting System Market – Attractiveness Analysis
      1. 9.6.1. By Technology
      2. 9.6.2. By End-use system
      3. 9.6.3. By Component
      4. 9.6.4. By End-use Industry
      5. 9.6.5. By Region
  10. Chapter 10 Industrial Chain, Sourcing Strategy, and Downstream Buyers
    1. 10.1. Energy Harvesting System Industrial Chain Analysis
    2. 10.2. Downstream Buyers
    3. 10.3. Distributors/Traders List
  11. Chapter 11 Marketing Strategy Analysis
    1. 11.1. Marketing Channel
    2. 11.2. Direct Marketing
    3. 11.3. Indirect Marketing
    4. 11.4. Marketing Channel Development Trends
    5. 11.5. Economic/Political Environmental Change
  12. Chapter 12 Report Conclusion & Key Insights
    1. 12.1. Key Insights from Primary Interviews & Surveys Respondents
    2. 12.2. Key Takeaways from Analysts, Consultants, and Industry Leaders
  13. Chapter 13 Research Approach & Methodology
    1. 13.1. Report Description
    2. 13.2. Research Scope
    3. 13.3. Research Methodology
      1. 13.3.1. Secondary Research
      2. 13.3.2. Primary Research
      3. 13.3.3. Statistical Models
        1. 13.3.3.1. Company Share Analysis Model
        2. 13.3.3.2. Revenue Based Modeling
      4. 13.3.4. Research Limitations

      List of Figures

      Fig.1	Product Picture of Energy Harvesting System
      Fig.2	Global Energy Harvesting System Market, 2016 – 2026 (USD Million)
      Fig.3	Global Energy Harvesting System Market Absolute Revenue Opportunity, 2016 – 2026 (USD Million)
      Fig.4	Global Energy Harvesting System Market Incremental Revenue Opportunity, 2020 – 2026 (USD Million)
      Fig.5	Global Energy Harvesting System Market Share, by Technology, 2020 & 2026 (USD Million)
      Fig.6	Global Light Energy Harvesting Energy Harvesting System Market, 2016 – 2026 (USD Million)
      Fig.7	Global Vibration Energy Harvesting Energy Harvesting System Market, 2016 – 2026 (USD Million)
      Fig.8	Global Radio Frequency Energy Harvesting Energy Harvesting System Market, 2016 – 2026 (USD Million)
      Fig.9	Global Thermal Energy Harvesting Energy Harvesting System Market, 2016 – 2026 (USD Million)
      Fig.10	Global Energy Harvesting System Market Share, by End-use system, 2020 & 2026 (USD Million)
      Fig.11	Global Wireless Switching System Energy Harvesting System Market, 2016 – 2026 (USD Million)
      Fig.12	Global Wireless HVAC System Energy Harvesting System Market, 2016 – 2026 (USD Million)
      Fig.13	Global Wireless Sensing and Telematics System Energy Harvesting System Market, 2016 – 2026 (USD Million)
      Fig.14	Global Tire Pressure Monitoring System Energy Harvesting System Market, 2016 – 2026 (USD Million)
      Fig.15	Global Asset Tracking System Energy Harvesting System Market, 2016 – 2026 (USD Million)
      Fig.16	Global Remote Health Monitoring System Energy Harvesting System Market, 2016 – 2026 (USD Million)
      Fig.17	Global Regenerative Energy Harvesting System Energy Harvesting System Market, 2016 – 2026 (USD Million)
      Fig.18	Global Energy Harvesting System Market Share, by Component, 2020 & 2026 (USD Million)
      Fig.19	Global Controller Energy Harvesting System Market, 2016 – 2026 (USD Million)
      Fig.20	Global Transistor Energy Harvesting System Market, 2016 – 2026 (USD Million)
      Fig.21	Global Capacitor Energy Harvesting System Market, 2016 – 2026 (USD Million)
      Fig.22	Global Battery Energy Harvesting System Market, 2016 – 2026 (USD Million)
      Fig.23	Global Energy Harvesting System Market Share, by End-use Industry, 2020 & 2026 (USD Million)
      Fig.24	Global Building And Home Automation Energy Harvesting System Market, 2016 – 2026 (USD Million)
      Fig.25	Global Consumer Electronics Energy Harvesting System Market, 2016 – 2026 (USD Million)
      Fig.26	Global Industrial Energy Harvesting System Market, 2016 – 2026 (USD Million)
      Fig.27	Global Transportation Energy Harvesting System Market, 2016 – 2026 (USD Million)
      Fig.28	Global Security Energy Harvesting System Market, 2016 – 2026 (USD Million)
      Fig.29	Global Others Energy Harvesting System Market, 2016 – 2026 (USD Million)
      Fig.30	Global Energy Harvesting System Market Share, by Region, 2020 & 2026 (USD Million)
      Fig.31	North America Energy Harvesting System Market, 2016 – 2026 (USD Million)
      Fig.32	U.S. Energy Harvesting System Market, 2016 – 2026 (USD Million)
      Fig.33	Canada Energy Harvesting System Market, 2016 – 2026 (USD Million)
      Fig.34	Europe Energy Harvesting System Market, 2016 – 2026 (USD Million)
      Fig.35	Germany Energy Harvesting System Market, 2016 – 2026 (USD Million)
      Fig.36	France Energy Harvesting System Market, 2016 – 2026 (USD Million)
      Fig.37	U.K. Energy Harvesting System Market, 2016 – 2026 (USD Million)
      Fig.38	Italy Energy Harvesting System Market, 2016 – 2026 (USD Million)
      Fig.39	Spain Energy Harvesting System Market, 2016 – 2026 (USD Million)
      Fig.40	Rest of Europe Energy Harvesting System Market, 2016 – 2026 (USD Million)
      Fig.41	Asia Pacific Energy Harvesting System Market, 2016 – 2026 (USD Million)
      Fig.42	China Energy Harvesting System Market, 2016 – 2026 (USD Million)
      Fig.43	Japan Energy Harvesting System Market, 2016 – 2026 (USD Million)
      Fig.44	India Energy Harvesting System Market, 2016 – 2026 (USD Million)
      Fig.45	South  Korea Energy Harvesting System Market, 2016 – 2026 (USD Million)
      Fig.46	South-East Asia Energy Harvesting System Market, 2016 – 2026 (USD Million)
      Fig.47	Rest of Asia Pacific Energy Harvesting System Market, 2016 – 2026 (USD Million)
      Fig.48	Latin America Energy Harvesting System Market, 2016 – 2026 (USD Million)
      Fig.49	Brazil Energy Harvesting System Market, 2016 – 2026 (USD Million)
      Fig.50	Mexico Energy Harvesting System Market, 2016 – 2026 (USD Million)
      Fig.51	Rest of Latin America Energy Harvesting System Market, 2016 – 2026 (USD Million)
      Fig.52	The Middle-East and Africa Energy Harvesting System Market, 2016 – 2026 (USD Million)
      Fig.53	GCC Countries Energy Harvesting System Market, 2016 – 2026 (USD Million)
      Fig.54	South Africa Energy Harvesting System Market, 2016 – 2026 (USD Million)
      Fig.55	Rest of Middle-East Africa Energy Harvesting System Market, 2016 – 2026 (USD Million)
      Fig.56	Competitor Market Share – Revenue
      Fig.57	ABB Revenue and Growth Rate
      Fig.58	ABB Market Share
      Fig.59	Bionic Power Revenue and Growth Rate
      Fig.60	Bionic Power Market Share
      Fig.61	Convergence Wireless Revenue and Growth Rate
      Fig.62	Convergence Wireless Market Share
      Fig.63	Cymbet Revenue and Growth Rate
      Fig.64	Cymbet Market Share
      Fig.65	Cypress Semiconductor Revenue and Growth Rate
      Fig.66	Cypress Semiconductor Market Share
      Fig.67	Enocean Revenue and Growth Rate
      Fig.68	Enocean Market Share
      Fig.69	Fujitsu Revenue and Growth Rate
      Fig.70	Fujitsu Market Share
      Fig.71	Greenpeak Technologies Revenue and Growth Rate
      Fig.72	Greenpeak Technologies Market Share
      Fig.73	Honeywell Revenue and Growth Rate
      Fig.74	Honeywell Market Share
      Fig.75	IXYS Corporation Revenue and Growth Rate
      Fig.76	IXYS Corporation Market Share
      Fig.77	Laird Revenue and Growth Rate
      Fig.78	Laird Market Share
      Fig.79	Linear Technology Revenue and Growth Rate
      Fig.80	Linear Technology Market Share
      Fig.81	Lord Microstrain Revenue and Growth Rate
      Fig.82	Lord Microstrain Market Share
      Fig.83	Microchip Technology Revenue and Growth Rate
      Fig.84	Microchip Technology Market Share
      Fig.85	MIDE Technology Revenue and Growth Rate
      Fig.86	MIDE Technology Market Share
      Fig.87	O-Flexx Technologies Revenue and Growth Rate
      Fig.88	O-Flexx Technologies Market Share
      Fig.89	Powercast Corporation Revenue and Growth Rate
      Fig.90	Powercast Corporation Market Share
      Fig.91	Stmicroelectronics Revenue and Growth Rate
      Fig.92	Stmicroelectronics Market Share
      Fig.93	Texas Instruments Revenue and Growth Rate
      Fig.94	Texas Instruments Market Share
      Fig.95	Voltree Power Revenue and Growth Rate
      Fig.96	Voltree Power Market Share
      Fig.97	Market Dynamics
      Fig.98	Global Energy Harvesting System – Value Chain Analysis
      Fig.99	Key Mandates and Regulations
      Fig.100	Technology Roadmap and Timeline
      Fig.101	Market Attractiveness Analysis – By Technology
      Fig.102	Market Attractiveness Analysis – By End-use system
      Fig.103	Market Attractiveness Analysis – By Component
      Fig.104	Market Attractiveness Analysis – By End-use Industry
      Fig.105	Market Attractiveness Analysis – By Region
      Fig.106	Energy Harvesting System Industrial Chain Analysis
      Fig.107	Market Channels
      Fig.108	Marketing Channel Development Trend
      Fig.109	Growth in World Gross Product, 2008-2018
      

      List of Tables

      	
      Table 1	Global Energy Harvesting System Market, 2020 & 2026 (USD Million)
      Table 2	Global Energy Harvesting System Market, by Technology, 2016 – 2026 (USD Million)
      Table 3	Global Energy Harvesting System Market, by End-use system, 2016 – 2026 (USD Million)
      Table 4	Global Energy Harvesting System Market, by Component, 2016 – 2026 (USD Million)
      Table 5	Global Energy Harvesting System Market, by End-use Industry, 2016 – 2026 (USD Million)
      Table 6	Global Energy Harvesting System Market, by Region, 2016 – 2026 (USD Million)
      Table 7	North America Energy Harvesting System Market, by Country, 2016 – 2026 (USD Million)
      Table 8	North America Energy Harvesting System Market, by Technology, 2016 – 2026 (USD Million)
      Table 9	North America Energy Harvesting System Market, by End-use system, 2016 – 2026 (USD Million)
      Table 10 North America Energy Harvesting System Market, by Component, 2016 – 2026 (USD Million)
      Table 11 North America Energy Harvesting System Market, by End-use Industry, 2016 – 2026 (USD Million)
      Table 12 Europe Energy Harvesting System Market, by Country, 2016 – 2026 (USD Million)
      Table 13 Europe Energy Harvesting System Market, by Technology, 2016 – 2026 (USD Million)
      Table 14 Europe Energy Harvesting System Market, by End-use system, 2016 – 2026 (USD Million)
      Table 15 Europe Energy Harvesting System Market, by Component, 2016 – 2026 (USD Million)
      Table 16 Europe Energy Harvesting System Market, by End-use Industry, 2016 – 2026 (USD Million)
      Table 17 Asia Pacific Energy Harvesting System Market, by Country, 2016 – 2026 (USD Million)
      Table 18 Asia Pacific Energy Harvesting System Market, by Technology, 2016 – 2026 (USD Million)
      Table 19 Asia Pacific Energy Harvesting System Market, by End-use system, 2016 – 2026 (USD Million)
      Table 20 Asia Pacific Energy Harvesting System Market, by Component, 2016 – 2026 (USD Million)
      Table 21 Asia Pacific Energy Harvesting System Market, by End-use Industry, 2016 – 2026 (USD Million)
      Table 22 Latin America Energy Harvesting System Market, by Country, 2016 – 2026 (USD Million)
      Table 23 Latin America Energy Harvesting System Market, by Technology, 2016 – 2026 (USD Million)
      Table 24 Latin America Energy Harvesting System Market, by End-use system, 2016 – 2026 (USD Million)
      Table 25 Latin America Energy Harvesting System Market, by Component, 2016 – 2026 (USD Million)
      Table 26 Latin America Energy Harvesting System Market, by End-use Industry, 2016 – 2026 (USD Million)
      Table 27 The Middle-East and Africa Energy Harvesting System Market, by Country, 2016 – 2026 (USD Million)
      Table 28 The Middle-East and Africa Energy Harvesting System Market, by Technology, 2016 – 2026 (USD Million)
      Table 29 The Middle-East and Africa Energy Harvesting System Market, by End-use system, 2016 – 2026 (USD Million)
      Table 30 The Middle-East and Africa Energy Harvesting System Market, by Component, 2016 – 2026 (USD Million)
      Table 31 The Middle-East and Africa Energy Harvesting System Market, by End-use Industry, 2016 – 2026 (USD Million)
      Table 32 Global Energy Harvesting System Market - Company Revenue Analysis, 2016 – 2020 (USD Million)
      Table 33 Global Energy Harvesting System Market - Company Revenue Share Analysis, 2016 – 2020 (%)
      Table 34 Acquisitions and Mergers
      Table 35 Market Drivers – Impact Analysis
      Table 36 Market Restraints
      Table 37 Market Opportunities
      Table 38 Major Buyers of Energy Harvesting System
      Table 39 Distributors/Traders of Energy Harvesting System by Region
      

Industry Major Market Players

  • Bionic Power
  • Convergence Wireless
  • Cymbet
  • Cypress Semiconductor
  • ABB
  • Enocean
  • Fujitsu
  • Greenpeak Technologies
  • Honeywell
  • IXYS Corporation
  • Laird
  • Linear Technology
  • Lord Microstrain
  • Microchip Technology
  • MIDE Technology
  • O-Flexx Technologies
  • Powercast Corporation
  • Stmicroelectronics
  • Texas Instruments
  • Voltree Power