Search Market Research Report

Discover Our Latest Reports
Discover Our Featured Reports
Discover Top Selling Reports

Electronic Grade Sulfuric acid Market Size, Share Global Analysis Report, 2020–2026

report img

Electronic Grade Sulfuric acid Market By Type (Parts per trillion (ppt), and Parts per billion (ppb)) and By Application (Semiconductors, PCB Panels, and Pharmaceuticals): Global Industry Outlook, Market Size, Business Intelligence, Consumer Preferences, Statistical Surveys, Comprehensive Analysis, Historical Developments, Current Trends, and Forecast 2020–2026

Industry Insights

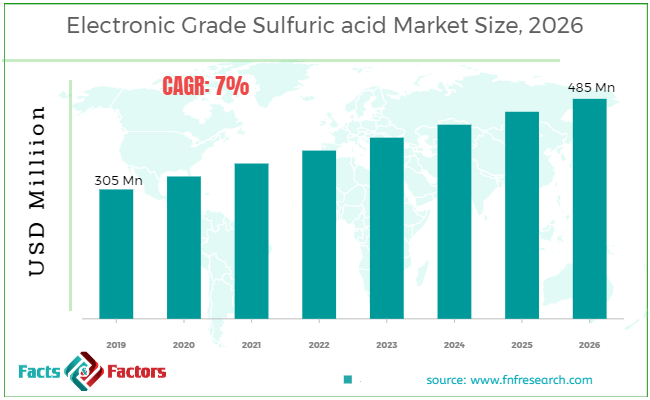
[165+ Pages PDF Report] Global Electronic Grade Sulfuric acid market is approximately USD 305 Million in 2019 and is anticipated to reach USD 485 million by 2026, at a CAGR of 7% during the forecast period.

Electronic Grade Sulfuric acid Market

To know more about this report | Request Free Sample Copy

This specialized and expertise-oriented industry research report scrutinizes the technical and commercial business outlook of the Electronic Grade Sulfuric acid industry. The report analyzes and declares the historical and current trends analysis of the Electronic Grade Sulfuric acid industry and subsequently recommends the projected trends anticipated to be observed in the Electronic Grade Sulfuric acid market during the upcoming years.

logoKey Insights from Primary Research

  • It was recognized through primary research that Electronic Grade Sulfuric acid market was valued at around USD 305 Billion in 2019.
  • Asia Pacific is expected to hold the largest market share of the Electronic Grade Sulfuric acid in the revenue, in 2019.
  • Based on application-based segmentation the “semiconductor” category, was the leading revenue-generating category in 2019.
  • Based on the type, the “parts per trillion” category, contributing to the largest revenue-generation.
  • According to our primary respondents, the Electronic Grade Sulfuric acid market is set to grow annually at a rate of around 7%.

logoKey Recommendations from Analysts:

  • Asia Pacific is estimated to lead the market in the forecast period. The rapid growth of electronics in the region, owing to smartphones, LED, and LCD is estimated to consume the electronic-grade sulfuric acid.
  • The growing investment in the electronics industry is estimated to propel the market in the forthcoming time.
  • Latin America and Middle East & Africa region is estimated to witness moderate growth.   
  • The constant demand from the semiconductor industry is estimated to create lucrative opportunities for electronic-grade sulfuric acid. 
  • The Asia Pacific region is estimated to follow by North America and Europe in the forecast period.

The Electronic Grade Sulfuric acid market report analyzes and notifies the industry statistics at the global as well as regional and country levels in order to acquire a thorough perspective of the entire Electronic Grade Sulfuric acid market. The historical and past insights are provided for FY 2016 to FY 2019 whereas projected trends are delivered for FY 2020 to FY 2026. The quantitative and numerical data is represented in terms of both volume (Kilo Tons) and value (USD Million) from FY 2016 – 2026.

The quantitative data is further underlined and reinforced by comprehensive qualitative data which comprises various across-the-board market dynamics. The rationales which directly or indirectly impact the Electronic Grade Sulfuric acid industry are exemplified through parameters such as growth drivers, restraints, challenges, and opportunities among other impacting factors.

Throughout our research report, we have encompassed all the proven models and tools of industry analysis and extensively illustrated all the key business strategies and business models adopted in the Electronic Grade Sulfuric acid industry. The report provides an all-inclusive and detailed competitive landscape prevalent in the Electronic Grade Sulfuric acid market.

The report utilizes established industry analysis tools and models such as Porter’s Five Forces framework to analyze and recognize critical business strategies adopted by various stakeholders involved in the entire value chain of the Electronic Grade Sulfuric acid industry. The Electronic Grade Sulfuric acid market report additionally employs SWOT analysis and PESTLE analysis models for further in-depth analysis.

The report study further includes an in-depth analysis of industry players' market shares and provides an overview of leading players' market position in the Electronic Grade Sulfuric acid sector. Key strategic developments in the Electronic Grade Sulfuric acid market competitive landscape such as acquisitions & mergers, inaugurations of different products and services, partnerships & joint ventures, MoU agreements, VC & funding activities, R&D activities, and geographic expansion among other noteworthy activities by key players of the Electronic Grade Sulfuric acid market are appropriately highlighted in the report.

logoReport Scope

Report Attribute

Details

Market Size in 2019

USD 305 Million

Projected Market Size in 2026

USD 485 Million

CAGR Growth Rate

7% CAGR

Base Year

2019

Forecast Years

2020-2026

Key Market Players

BASF SE, Moses Lake Industries, INEOS Group Holdings S.A., Reagent Chemicals, Trident Group, Chemtrade Logistics, PVS Chemicals, KMG Chemicals, The Linde Group, and Kanto Chemical Co.Inc., and Others

Key Segment

By Type, Application, and Region

Major Regions Covered

North America, Europe, Asia Pacific, Latin America, and the Middle East & Africa

Purchase Options

Request customized purchase options to meet your research needs. Explore purchase options

The Electronic Grade Sulfuric acid market research report delivers an acute valuation and taxonomy of the Electronic Grade Sulfuric acid industry by practically splitting the market on the basis of different types, applications, and regions. Through the analysis of the historical and projected trends, all the segments and sub-segments were evaluated through the bottom-up approach, and different market sizes have been projected for FY 2020 to FY 2026. The regional segmentation of the Electronic Grade Sulfuric acid industry includes the complete classification of all the major continents including North America, Latin America, Europe, Asia Pacific, and Middle East & Africa. Further, country-wise data for the Electronic Grade Sulfuric acid industry is provided for the leading economies of the world.

The Electronic Grade Sulfuric acid market is segmented based on type and application. On the basis of type segmentation, the market is classified into Parts per trillion (ppt), and Parts per billion (ppb). In terms of Application segmentation, the market is bifurcated into semiconductors, PCB panels, and pharmaceuticals.

logoTop Market Players

Some of the essential players operating in the Electronic Grade Sulfuric acid market, but not restricted to include are:

  • BASF SE
  • Moses Lake Industries
  • INEOS Group Holdings S.A.
  • Reagent Chemicals
  • Trident Group
  • Chemtrade Logistics
  • PVS Chemicals
  • KMG Chemicals
  • The Linde Group
  • Kanto Chemical Co.Inc.

The taxonomy of the Electronic Grade Sulfuric acid market by its scope and segmentation is as follows:

logoGlobal Electronic Grade Sulfuric Acid Market: by Type Segmentation Analysis (Customizable)

  • Parts per trillion (ppt)
  • Parts per billion (ppb)

logoGlobal Electronic Grade Sulfuric Acid Market: by Application Segmentation Analysis (Customizable)

  • Semiconductors
  • PCB Panels
  • Pharmaceuticals

logoGlobal Electronic Grade Sulfuric Acid market: Regional Segmentation Analysis (Customizable)

  • North America
    • The U.S.
    • Canada
  • Europe
    • Germany
    • The UK
    • France
    • Spain
    • Italy
    • Rest of Europe
  • Asia Pacific
    • China
    • Japan
    • India
    • South Korea
    • Southeast Asia
    • Rest of Asia Pacific
  • Latin America
    • Brazil
    • Mexico
    • Rest of Latin America
  • Middle East & Africa
    • GCC
    • South Africa
    • Rest of the Middle East & Africa

Table of Content

  1. CHAPTER 1. Executive Summary
  2. CHAPTER 2. Electronic Grade Sulfuric acid market – Grade Analysis
    1. 2.1. Global Electronic Grade Sulfuric acid Market – Grade Overview
    2. 2.2. Global Electronic Grade Sulfuric acid Market Share, by Grade, 2019 & 2026 (USD Million)
    3. 2.3. Global Electronic Grade Sulfuric acid Market share, by Grade, 2019 & 2026 (Kilo Tons)
    4. 2.4. Parts per trillion (ppt)
      1. 2.4.1. Global Parts per trillion (ppt) Electronic Grade Sulfuric acid Market, 2016-2026 (USD Million)
      2. 2.4.2. Global Parts per trillion (ppt) Electronic Grade Sulfuric acid Market, 2016-2026 (Kilo Tons)
    5. 2.5. Parts per billion (ppb)
      1. 2.5.1. Global Parts per billion (ppb) Electronic Grade Sulfuric acid Market, 2016-2026 (USD Million)
      2. 2.5.2. Global Parts per billion (ppb) Electronic Grade Sulfuric acid Market, 2016-2026 (Kilo Tons)
  3. CHAPTER 3. Electronic Grade Sulfuric acid market – Application Analysis
    1. 3.1. Global Electronic Grade Sulfuric acid Market – Application Overview
    2. 3.2. Global Electronic Grade Sulfuric acid Market Share, by Application, 2019 & 2026 (USD Million)
    3. 3.3. Global Electronic Grade Sulfuric acid Market share, by Application, 2019 & 2026 (Kilo Tons)
    4. 3.4. Semiconductors
      1. 3.4.1. Global Semiconductors Electronic Grade Sulfuric acid Market, 2016-2026 (USD Million)
      2. 3.4.2. Global Semiconductors Electronic Grade Sulfuric acid Market, 2016-2026 (Kilo Tons)
    5. 3.5. PCB Panels
      1. 3.5.1. Global PCB Panels Electronic Grade Sulfuric acid Market, 2016-2026 (USD Million)
      2. 3.5.2. Global PCB Panels Electronic Grade Sulfuric acid Market, 2016-2026 (Kilo Tons)
    6. 3.6. Pharmaceuticals
      1. 3.6.1. Global Pharmaceuticals Electronic Grade Sulfuric acid Market, 2016-2026 (USD Million)
      2. 3.6.2. Global Pharmaceuticals Electronic Grade Sulfuric acid Market, 2016-2026 (Kilo Tons)
  4. CHAPTER 4. Electronic Grade Sulfuric acid market – Regional Analysis
    1. 4.1. Global Electronic Grade Sulfuric acid Market Regional Overview
    2. 4.2. Global Electronic Grade Sulfuric acid Market Share, by Region, 2019 & 2026 (Value)
    3. 4.3. Global Electronic Grade Sulfuric acid Market Share, by Region, 2019 & 2026 (Volume)
    4. 4.4. North America
      1. 4.4.1. North America Electronic Grade Sulfuric acid Market size and forecast, 2016-2026
      2. 4.4.2. North America Electronic Grade Sulfuric acid Market, by Country, 2019 - 2026 (USD Million)
      3. 4.4.3. North America Market size and forecast, 2016-2026 (Kilo Tons)
      4. 4.4.4. North America Electronic Grade Sulfuric acid Market, by Country, 2019 - 2026 (Kilo Tons)
      5. 4.4.5. North America Electronic Grade Sulfuric acid Market, by Grade, 2016-2026
        1. 4.4.5.1. North America Electronic Grade Sulfuric acid Market, by Grade, 2016-2026 (USD Million)
        2. 4.4.5.2. North America Electronic Grade Sulfuric acid Market, by Grade, 2016-2026 (Kilo Tons)
      6. 4.4.6. North America Electronic Grade Sulfuric acid Market, by Application, 2016-2026
        1. 4.4.6.1. North America Electronic Grade Sulfuric acid Market, by Application, 2016-2026 (USD Million)
        2. 4.4.6.2. North America Electronic Grade Sulfuric acid Market, by Application, 2016-2026 (Kilo Tons)
      7. 4.4.7. U.S.
        1. 4.4.7.1. U.S. Market size and forecast, 2016-2026 (USD Million)
        2. 4.4.7.2. U.S. Market size and forecast, 2016-2026 (Kilo Tons)
      8. 4.4.8. Canada
        1. 4.4.8.1. Canada Market size and forecast, 2016-2026 (USD Million)
        2. 4.4.8.2. Canada Market size and forecast, 2016-2026 (Kilo Tons)
    5. 4.5. Europe
      1. 4.5.1. Europe Electronic Grade Sulfuric acid Market size and forecast, 2016-2026
      2. 4.5.2. Europe Electronic Grade Sulfuric acid Market, by Country, 2019 - 2026 (USD Million)
      3. 4.5.3. Europe Market size and forecast, 2016-2026 (Kilo Tons)
      4. 4.5.4. Europe Electronic Grade Sulfuric acid Market, by Country, 2019 - 2026 (Kilo Tons)
      5. 4.5.5. Europe Electronic Grade Sulfuric acid Market, by Grade, 2016-2026
        1. 4.5.5.1. Europe Electronic Grade Sulfuric acid Market, by Grade, 2016-2026 (USD Million)
        2. 4.5.5.2. Europe Electronic Grade Sulfuric acid Market, by Grade, 2016-2026 (Kilo Tons)
      6. 4.5.6. Europe Electronic Grade Sulfuric acid Market, by Application, 2016-2026
        1. 4.5.6.1. Europe Electronic Grade Sulfuric acid Market, by Application, 2016-2026 (USD Million)
        2. 4.5.6.2. Europe Electronic Grade Sulfuric acid Market, by Application, 2016-2026 (Kilo Tons)
      7. 4.5.7. Germany
        1. 4.5.7.1. Germany Market size and forecast, 2016-2026 (USD Million)
        2. 4.5.7.2. Germany Market size and forecast, 2016-2026 (Kilo Tons)
      8. 4.5.8. France
        1. 4.5.8.1. France Market size and forecast, 2016-2026 (USD Million)
        2. 4.5.8.2. France Market size and forecast, 2016-2026 (Kilo Tons)
      9. 4.5.9. U.K.
        1. 4.5.9.1. U.K. Market size and forecast, 2016-2026 (USD Million)
        2. 4.5.9.2. U.K. Market size and forecast, 2016-2026 (Kilo Tons)
      10. 4.5.10. Italy
        1. 4.5.10.1. Italy Market size and forecast, 2016-2026 (USD Million)
        2. 4.5.10.2. Italy Market size and forecast, 2016-2026 (Kilo Tons)
      11. 4.5.11. Spain
        1. 4.5.11.1. Spain Market size and forecast, 2016-2026 (USD Million)
        2. 4.5.11.2. Spain Market size and forecast, 2016-2026 (Kilo Tons)
      12. 4.5.12. Rest of Europe
        1. 4.5.12.1. Rest of Europe Market size and forecast, 2016-2026 (USD Million)
        2. 4.5.12.2. Rest of Europe Market size and forecast, 2016-2026 (Kilo Tons)
    6. 4.6. Asia Pacific
      1. 4.6.1. Asia Pacific Electronic Grade Sulfuric acid Market size and forecast, 2016-2026
      2. 4.6.2. Asia Pacific Electronic Grade Sulfuric acid Market, by Country, 2019 - 2026 (USD Million)
      3. 4.6.3. Asia Pacific Market size and forecast, 2016-2026 (Kilo Tons)
      4. 4.6.4. Asia Pacific Electronic Grade Sulfuric acid Market, by Country, 2019 - 2026 (Kilo Tons)
      5. 4.6.5. Asia Pacific Electronic Grade Sulfuric acid Market, by Grade, 2016-2026
        1. 4.6.5.1. Asia Pacific Electronic Grade Sulfuric acid Market, by Grade, 2016-2026 (USD Million)
        2. 4.6.5.2. Asia Pacific Electronic Grade Sulfuric acid Market, by Grade, 2016-2026 (Kilo Tons)
      6. 4.6.6. Asia Pacific Electronic Grade Sulfuric acid Market, by Application, 2016-2026
        1. 4.6.6.1. Asia Pacific Electronic Grade Sulfuric acid Market, by Application, 2016-2026 (USD Million)
        2. 4.6.6.2. Asia Pacific Electronic Grade Sulfuric acid Market, by Application, 2016-2026 (Kilo Tons)
      7. 4.6.7. China
        1. 4.6.7.1. China Market size and forecast, 2016-2026 (USD Million)
        2. 4.6.7.2. China Market size and forecast, 2016-2026 (Kilo Tons)
      8. 4.6.8. Japan
        1. 4.6.8.1. Japan Market size and forecast, 2016-2026 (USD Million)
        2. 4.6.8.2. Japan Market size and forecast, 2016-2026 (Kilo Tons)
      9. 4.6.9. India
        1. 4.6.9.1. India Market size and forecast, 2016-2026 (USD Million)
        2. 4.6.9.2. India Market size and forecast, 2016-2026 (Kilo Tons)
      10. 4.6.10. South Korea
        1. 4.6.10.1. South Korea Market size and forecast, 2016-2026 (USD Million)
        2. 4.6.10.2. South Korea Market size and forecast, 2016-2026 (Kilo Tons)
      11. 4.6.11. South-East Asia
        1. 4.6.11.1. South-East Asia Market size and forecast, 2016-2026 (USD Million)
        2. 4.6.11.2. South-East Asia Market size and forecast, 2016-2026 (Kilo Tons)
      12. 4.6.12. Rest of Asia Pacific
        1. 4.6.12.1. Rest of Asia Pacific Market size and forecast, 2016-2026 (USD Million)
        2. 4.6.12.2. Rest of Asia Pacific Market size and forecast, 2016-2026 (Kilo Tons)
    7. 4.7. Latin America
      1. 4.7.1. Latin America Electronic Grade Sulfuric acid Market size and forecast, 2016-2026
      2. 4.7.2. Latin America Electronic Grade Sulfuric acid Market, by Country, 2019 - 2026 (USD Million)
      3. 4.7.3. Latin America Market size and forecast, 2016-2026 (Kilo Tons)
      4. 4.7.4. Latin America Electronic Grade Sulfuric acid Market, by Country, 2019 - 2026 (Kilo Tons)
      5. 4.7.5. Latin America Electronic Grade Sulfuric acid Market, by Grade, 2016-2026
        1. 4.7.5.1. Latin America Electronic Grade Sulfuric acid Market, by Grade, 2016-2026 (USD Million)
        2. 4.7.5.2. Latin America Electronic Grade Sulfuric acid Market, by Grade, 2016-2026 (Kilo Tons)
      6. 4.7.6. Latin America Electronic Grade Sulfuric acid Market, by Application, 2016-2026
        1. 4.7.6.1. Latin America Electronic Grade Sulfuric acid Market, by Application, 2016-2026 (USD Million)
        2. 4.7.6.2. Latin America Electronic Grade Sulfuric acid Market, by Application, 2016-2026 (Kilo Tons)
      7. 4.7.7. Brazil
        1. 4.7.7.1. Brazil Market size and forecast, 2016-2026 (USD Million)
        2. 4.7.7.2. Brazil Market size and forecast, 2016-2026 (Kilo Tons)
      8. 4.7.8. Mexico
        1. 4.7.8.1. Mexico Market size and forecast, 2016-2026 (USD Million)
        2. 4.7.8.2. Mexico Market size and forecast, 2016-2026 (Kilo Tons)
      9. 4.7.9. Rest of Latin America
        1. 4.7.9.1. Rest of Latin America Market size and forecast, 2016-2026 (USD Million)
        2. 4.7.9.2. Rest of Latin America Market size and forecast, 2016-2026 (Kilo Tons)
    8. 4.8. The Middle-East and Africa
      1. 4.8.1. The Middle-East and Africa Electronic Grade Sulfuric acid Market size and forecast, 2016-2026
      2. 4.8.2. The Middle-East and Africa Electronic Grade Sulfuric acid Market, by Country, 2019 - 2026 (USD Million)
      3. 4.8.3. The Middle-East and Africa Market size and forecast, 2016-2026 (Kilo Tons)
      4. 4.8.4. The Middle-East and Africa Electronic Grade Sulfuric acid Market, by Country, 2019 - 2026 (Kilo Tons)
      5. 4.8.5. The Middle-East and Africa Electronic Grade Sulfuric acid Market, by Grade, 2016-2026
        1. 4.8.5.1. The Middle-East and Africa Electronic Grade Sulfuric acid Market, by Grade, 2016-2026 (USD Million)
        2. 4.8.5.2. The Middle-East and Africa Electronic Grade Sulfuric acid Market, by Grade, 2016-2026 (Kilo Tons)
      6. 4.8.6. The Middle-East and Africa Electronic Grade Sulfuric acid Market, by Application, 2016-2026
        1. 4.8.6.1. The Middle-East and Africa Electronic Grade Sulfuric acid Market, by Application, 2016-2026 (USD Million)
        2. 4.8.6.2. The Middle-East and Africa Electronic Grade Sulfuric acid Market, by Application, 2016-2026 (Kilo Tons)
      7. 4.8.7. GCC Countries
        1. 4.8.7.1. GCC Countries Market size and forecast, 2016-2026 (USD Million)
        2. 4.8.7.2. GCC Countries Market size and forecast, 2016-2026 (Kilo Tons)
      8. 4.8.8. South Africa
        1. 4.8.8.1. South Africa Market size and forecast, 2016-2026 (USD Million)
        2. 4.8.8.2. South Africa Market size and forecast, 2016-2026 (Kilo Tons)
      9. 4.8.9. Rest of Middle-East Africa
        1. 4.8.9.1. Rest of Middle-East Africa Market size and forecast, 2016-2026 (USD Million)
        2. 4.8.9.2. Rest of Middle-East Africa Market size and forecast, 2016-2026 (Kilo Tons)
  5. CHAPTER 5. Electronic Grade Sulfuric acid Production, Consumption, Export, Import by Regions
    1. 5.1. Global Electronic Grade Sulfuric acid production and revenue, 2015-2026 (USD Million) (Kilo Tons)
    2. 5.2. Global Import and Export Analysis, by Region
  6. CHAPTER 6. Electronic Grade Sulfuric acid market – Competitive Landscape
    1. 6.1. Competitor Market Share – Revenue
    2. 6.2. Market Concentration Rate Analysis, Top 3 and Top 5 Players
    3. 6.3. Competitor Market Share – Volume
    4. 6.4. Strategic Development
      1. 6.4.1. Acquisitions and Mergers
      2. 6.4.2. New Products
      3. 6.4.3. Research & Development Activities
  7. CHAPTER 7. Company Profiles
    1. 7.1. BASF SE
      1. 7.1.1. Company Overview
      2. 7.1.2. BASF SE Sales, Revenue, Price, and Gross Margin
      3. 7.1.3. Product portfolio
      4. 7.1.4. Recent initiatives
    2. 7.2. Moses Lake Industries
      1. 7.2.1. Company Overview
      2. 7.2.2. Moses Lake Industries Sales, Revenue, Price, and Gross Margin
      3. 7.2.3. Product portfolio
      4. 7.2.4. Recent initiatives
    3. 7.3. INEOS Group Holdings S.A.
      1. 7.3.1. Company Overview
      2. 7.3.2. INEOS Group Holdings S.A. Sales, Revenue, Price, and Gross Margin
      3. 7.3.3. Product portfolio
      4. 7.3.4. Recent initiatives
    4. 7.4. Reagent Chemicals
      1. 7.4.1. Company Overview
      2. 7.4.2. Reagent Chemicals Sales, Revenue, Price, and Gross Margin
      3. 7.4.3. Product portfolio
      4. 7.4.4. Recent initiatives
    5. 7.5. Trident Group
      1. 7.5.1. Company Overview
      2. 7.5.2. Trident Group Sales, Revenue, Price, and Gross Margin
      3. 7.5.3. Product portfolio
      4. 7.5.4. Recent initiatives
    6. 7.6. Chemtrade Logistics
      1. 7.6.1. Company Overview
      2. 7.6.2. Chemtrade Logistics Sales, Revenue, Price, and Gross Margin
      3. 7.6.3. Product portfolio
      4. 7.6.4. Recent initiatives
    7. 7.7. PVS Chemicals
      1. 7.7.1. Company Overview
      2. 7.7.2. PVS Chemicals Sales, Revenue, Price, and Gross Margin
      3. 7.7.3. Product portfolio
      4. 7.7.4. Recent initiatives
    8. 7.8. KMG Chemicals
      1. 7.8.1. Company Overview
      2. 7.8.2. KMG Chemicals Sales, Revenue, Price, and Gross Margin
      3. 7.8.3. Product portfolio
      4. 7.8.4. Recent initiatives
    9. 7.9. The Linde Group
      1. 7.9.1. Company Overview
      2. 7.9.2. The Linde Group Sales, Revenue, Price, and Gross Margin
      3. 7.9.3. Product portfolio
      4. 7.9.4. Recent initiatives
    10. 7.10. Kanto Chemical Co.Inc.
      1. 7.10.1. Company Overview
      2. 7.10.2. Kanto Chemical Co.Inc. Sales, Revenue, Price, and Gross Margin
      3. 7.10.3. Product portfolio
      4. 7.10.4. Recent initiatives
  8. CHAPTER 8. Electronic Grade Sulfuric acid — Industry Analysis
    1. 8.1. Introduction and Taxonomy
    2. 8.2. Electronic Grade Sulfuric acid Market – Key Trends
      1. 8.2.1. Market Drivers
      2. 8.2.2. Market Restraints
      3. 8.2.3. Market Opportunities
    3. 8.3. Value Chain Analysis
    4. 8.4. Key Mandates and Regulations
    5. 8.5. Technology Roadmap and Timeline
    6. 8.6. Electronic Grade Sulfuric acid market – Attractiveness Analysis
      1. 8.6.1. By Grade
      2. 8.6.2. By Application
      3. 8.6.3. By Region
  9. CHAPTER 9. Raw Material analysis
    1. 9.1. Electronic Grade Sulfuric acid Key Raw Material Analysis
      1. 9.1.1. Key Raw Materials
      2. 9.1.2. Price Trend of Key Raw Materials
    2. 9.2. Key Suppliers of Raw Materials
    3. 9.3. Proportion of Manufacturing Cost Structure
      1. 9.3.1. Raw Materials
      2. 9.3.2. Labor Cost
    4. 9.4. Manufacturing Expenses Analysis of Electronic Grade Sulfuric acid
  10. CHAPTER 10. Industrial Chain, Sourcing Strategy and Downstream Buyers
    1. 10.1. Electronic Grade Sulfuric acid Industrial Chain Analysis
    2. 10.2. Upstream Raw Materials Sourcing
      1. 10.2.1. Risk Mitigation:
      2. 10.2.2. Supplier Relationships:
      3. 10.2.3. Business Processes:
      4. 10.2.4. Securing the Product:
    3. 10.3. Raw Materials Sources of Electronic Grade Sulfuric acid Major Manufacturers in 2016
    4. 10.4. Downstream Buyers
    5. 10.5. Distributors/Traders List
  11. CHAPTER 11. Marketing Strategy Analysis, Distributors
    1. 11.1. Marketing Channel
    2. 11.2. Direct Marketing
    3. 11.3. Indirect Marketing
    4. 11.4. Marketing Channel Development Trend
    5. 11.5. Economic/Political Environmental Change
  12. CHAPTER 12. Report Conclusion
  13. CHAPTER 13. Research Approach & Methodology
    1. 13.1. Report Description
    2. 13.2. Research Scope
    3. 13.3. Research Methodology
      1. 13.3.1. Secondary Research
      2. 13.3.2. Primary Research
      3. 13.3.3. Models
        1. 13.3.3.1. Company Share Analysis Model
        2. 13.3.3.2. Revenue Based Modeling
        3. 13.3.3.3. Research Limitations

        List of Figures

        FIG. 1 Global Electronic Grade Sulfuric acid Market, 2016-2026 (USD Million)
        FIG. 2 Global Electronic Grade Sulfuric acid Market Share, by Grade, 2019 & 2026 (USD Million)
        FIG. 3 Global Electronic Grade Sulfuric acid Market share, by Grade, 2019 & 2026 (Kilo Tons)
        FIG. 4 Global  Parts per trillion (ppt) Electronic Grade Sulfuric acid Market, 2016-2026 (USD Million)
        FIG. 5 Global  Parts per trillion (ppt) Electronic Grade Sulfuric acid  Market, 2016-2026 (Kilo Tons)
        FIG. 6 Global  Parts per billion (ppb) Electronic Grade Sulfuric acid Market, 2016-2026 (USD Million)
        FIG. 7 Global  Parts per billion (ppb) Electronic Grade Sulfuric acid  Market, 2016-2026 (Kilo Tons)
        FIG. 8 Global Electronic Grade Sulfuric acid Market Share, by Application, 2019 & 2026 (USD Million)
        FIG. 9 Global Electronic Grade Sulfuric acid Market share, by Application, 2019 & 2026 (Kilo Tons)
        FIG. 10 Global Semiconductors Electronic Grade Sulfuric acid Market, 2016-2026 (USD Million)
        FIG. 11 Global Semiconductors Electronic Grade Sulfuric acid  Market, 2016-2026 (Kilo Tons)
        FIG. 12 Global PCB Panels Electronic Grade Sulfuric acid Market, 2016-2026 (USD Million)
        FIG. 13 Global PCB Panels Electronic Grade Sulfuric acid  Market, 2016-2026 (Kilo Tons)
        FIG. 14 Global Pharmaceuticals Electronic Grade Sulfuric acid Market, 2016-2026 (USD Million)
        FIG. 15 Global Pharmaceuticals Electronic Grade Sulfuric acid  Market, 2016-2026 (Kilo Tons)
        FIG. 16 Global Electronic Grade Sulfuric acid Market Share, by Region, 2019 & 2026
        FIG. 17 Global Electronic Grade Sulfuric acid Market Share, by Region, 2019 & 2026
        FIG. 18 North America Electronic Grade Sulfuric acid Market, 2016-2026
        FIG. 19 North America Electronic Grade Sulfuric acid  Market, 2016-2026 (Kilo Tons)
        FIG. 20 U.S. Electronic Grade Sulfuric acid Market, 2016-2026
        FIG. 21 U.S. Electronic Grade Sulfuric acid  Market, 2016-2026 (Kilo Tons)
        FIG. 22 Canada Electronic Grade Sulfuric acid Market, 2016-2026
        FIG. 23 Canada Electronic Grade Sulfuric acid  Market, 2016-2026 (Kilo Tons)
        FIG. 24 Europe Electronic Grade Sulfuric acid Market, 2016-2026
        FIG. 25 Europe Electronic Grade Sulfuric acid  Market, 2016-2026 (Kilo Tons)
        FIG. 26 Germany Electronic Grade Sulfuric acid Market, 2016-2026
        FIG. 27 Germany Electronic Grade Sulfuric acid  Market, 2016-2026 (Kilo Tons)
        FIG. 28 France Electronic Grade Sulfuric acid Market, 2016-2026
        FIG. 29 France Electronic Grade Sulfuric acid  Market, 2016-2026 (Kilo Tons)
        FIG. 30 U.K. Electronic Grade Sulfuric acid Market, 2016-2026
        FIG. 31 U.K. Electronic Grade Sulfuric acid  Market, 2016-2026 (Kilo Tons)
        FIG. 32 Italy Electronic Grade Sulfuric acid Market, 2016-2026
        FIG. 33 Italy Electronic Grade Sulfuric acid  Market, 2016-2026 (Kilo Tons)
        FIG. 34 Spain Electronic Grade Sulfuric acid Market, 2016-2026
        FIG. 35 Spain Electronic Grade Sulfuric acid  Market, 2016-2026 (Kilo Tons)
        FIG. 36 Rest of Europe Electronic Grade Sulfuric acid Market, 2016-2026
        FIG. 37 Rest of Europe Electronic Grade Sulfuric acid  Market, 2016-2026 (Kilo Tons)
        FIG. 38 Asia Pacific Electronic Grade Sulfuric acid Market, 2016-2026
        FIG. 39 Asia Pacific Electronic Grade Sulfuric acid  Market, 2016-2026 (Kilo Tons)
        FIG. 40 China Electronic Grade Sulfuric acid Market, 2016-2026
        FIG. 41 China Electronic Grade Sulfuric acid  Market, 2016-2026 (Kilo Tons)
        FIG. 42 Japan Electronic Grade Sulfuric acid Market, 2016-2026
        FIG. 43 Japan Electronic Grade Sulfuric acid  Market, 2016-2026 (Kilo Tons)
        FIG. 44 India Electronic Grade Sulfuric acid Market, 2016-2026
        FIG. 45 India Electronic Grade Sulfuric acid  Market, 2016-2026 (Kilo Tons)
        FIG. 46 South  Korea Electronic Grade Sulfuric acid Market, 2016-2026
        FIG. 47 South  Korea Electronic Grade Sulfuric acid  Market, 2016-2026 (Kilo Tons)
        FIG. 48 South-East Asia Electronic Grade Sulfuric acid Market, 2016-2026
        FIG. 49 South-East Asia Electronic Grade Sulfuric acid  Market, 2016-2026 (Kilo Tons)
        FIG. 50 Rest of Asia Pacific Electronic Grade Sulfuric acid Market, 2016-2026
        FIG. 51 Rest of Asia Pacific Electronic Grade Sulfuric acid  Market, 2016-2026 (Kilo Tons)
        FIG. 52 Latin America Electronic Grade Sulfuric acid Market, 2016-2026
        FIG. 53 Latin America Electronic Grade Sulfuric acid  Market, 2016-2026 (Kilo Tons)
        FIG. 54 Brazil Electronic Grade Sulfuric acid Market, 2016-2026
        FIG. 55 Brazil Electronic Grade Sulfuric acid  Market, 2016-2026 (Kilo Tons)
        FIG. 56 Mexico Electronic Grade Sulfuric acid Market, 2016-2026
        FIG. 57 Mexico Electronic Grade Sulfuric acid  Market, 2016-2026 (Kilo Tons)
        FIG. 58 Rest of Latin America Electronic Grade Sulfuric acid Market, 2016-2026
        FIG. 59 Rest of Latin America Electronic Grade Sulfuric acid  Market, 2016-2026 (Kilo Tons)
        FIG. 60 The Middle-East and Africa Electronic Grade Sulfuric acid Market, 2016-2026
        FIG. 61 The Middle-East and Africa Electronic Grade Sulfuric acid  Market, 2016-2026 (Kilo Tons)
        FIG. 62 GCC Countries Electronic Grade Sulfuric acid Market, 2016-2026
        FIG. 63 GCC Countries Electronic Grade Sulfuric acid  Market, 2016-2026 (Kilo Tons)
        FIG. 64 South Africa Electronic Grade Sulfuric acid Market, 2016-2026
        FIG. 65 South Africa Electronic Grade Sulfuric acid  Market, 2016-2026 (Kilo Tons)
        FIG. 66 Rest of Middle-East Africa Electronic Grade Sulfuric acid Market, 2016-2026
        FIG. 67 Rest of Middle-East Africa Electronic Grade Sulfuric acid  Market, 2016-2026 (Kilo Tons)
        FIG. 68 Global Electronic Grade Sulfuric acid production and revenue, 2015-2026 (USD Million) (Kilo Tons)
        FIG. 69 North America Electronic Grade Sulfuric acid production and revenue, 2015-2026 (USD Million) (Kilo Tons)
        FIG. 70 Europe Electronic Grade Sulfuric acid production and revenue, 2015-2026 (USD Million) (Kilo Tons)
        FIG. 71 Asia Pacific Electronic Grade Sulfuric acid production and revenue, 2015-2026 (USD Million) (Kilo Tons)
        FIG. 72 Latin America Electronic Grade Sulfuric acid production and revenue, 2015-2026 (USD Million) (Kilo Tons)
        FIG. 73 Middle East and Africa Electronic Grade Sulfuric acid production and revenue, 2015-2026 (USD Million) (Kilo Tons)
        FIG. 74 Competitor Market Share – Revenue
        FIG. 75 Competitor Market Share – Volume
        FIG. 76 BASF SE Revenue and Growth Rate
        FIG. 77 BASF SE Market Share
        FIG. 78 Moses Lake Industries Revenue and Growth Rate
        FIG. 79 Moses Lake Industries Market Share
        FIG. 80 INEOS Group Holdings S.A. Revenue and Growth Rate
        FIG. 81 INEOS Group Holdings S.A. Market Share
        FIG. 82 Reagent Chemicals Revenue and Growth Rate
        FIG. 83 Reagent Chemicals Market Share
        FIG. 84 Trident Group Revenue and Growth Rate
        FIG. 85 Trident Group Market Share
        FIG. 86 Chemtrade Logistics Revenue and Growth Rate
        FIG. 87 Chemtrade Logistics Market Share
        FIG. 88 PVS Chemicals Revenue and Growth Rate
        FIG. 89 PVS Chemicals Market Share
        FIG. 90 KMG Chemicals Revenue and Growth Rate
        FIG. 91 KMG Chemicals Market Share
        FIG. 92 The Linde Group Revenue and Growth Rate
        FIG. 93 The Linde Group Market Share
        FIG. 94 Kanto Chemical Co.Inc. Revenue and Growth Rate
        FIG. 95 Kanto Chemical Co.Inc. Market Share
        FIG. 96 Market Dynamics
        FIG. 97 Global Electronic Grade Sulfuric acid – Value Chain Analysis
        FIG. 98 Key Mandates and Regulations
        FIG. 99 Technology Roadmap and Timeline
        FIG. 100 Market Attractiveness Analysis – By Grade
        FIG. 101 Market Attractiveness Analysis – By Application
        FIG. 102 Market Attractiveness Analysis – By Region
        FIG. 103 Manufacturing Cost Structure of Electronic Grade Sulfuric acid
        FIG. 104 Electronic Grade Sulfuric acid Industrial Chain Analysis
        FIG. 105 Market Channel
        FIG. 106 Marketing Channel Development Trend
        FIG. 107 Growth in World Gross Product, 2008-2019

        List of Tables

        TABLE 1 Global Electronic Grade Sulfuric acid market, 2019 & 2026 (USD Million)
        TABLE 2 Global Electronic Grade Sulfuric acid market, by Grade, 2016-2026 (USD Million)
        TABLE 3 Global Electronic Grade Sulfuric acid market, by Grade, 2016-2026 (Kilo Tons)
        TABLE 4 Global Electronic Grade Sulfuric acid market, by Application, 2016-2026 (USD Million)
        TABLE 5 Global Electronic Grade Sulfuric acid market, by Application, 2016-2026 (Kilo Tons)
        TABLE 6 Global Electronic Grade Sulfuric acid market, by region, 2016-2026 (USD Million)
        TABLE 7 Global Electronic Grade Sulfuric acid market, by region, 2016-2026 (Kilo Tons)
        TABLE 8 North America Electronic Grade Sulfuric acid Market, by Grade, 2016-2026 (USD Million)
        TABLE 9 North America Electronic Grade Sulfuric acid Market, by Grade, 2016-2026 (Kilo Tons)
        TABLE 10 North America Electronic Grade Sulfuric acid Market, by Application, 2016-2026 (USD Million)
        TABLE 11 North America Electronic Grade Sulfuric acid Market, by Application, 2016-2026 (Kilo Tons)
        TABLE 12 Europe Electronic Grade Sulfuric acid Market, by Grade, 2016-2026 (USD Million)
        TABLE 13 Europe Electronic Grade Sulfuric acid Market, by Grade, 2016-2026 (Kilo Tons)
        TABLE 14 Europe Electronic Grade Sulfuric acid Market, by Application, 2016-2026 (USD Million)
        TABLE 15 Europe Electronic Grade Sulfuric acid Market, by Application, 2016-2026 (Kilo Tons)
        TABLE 16 Asia Pacific Electronic Grade Sulfuric acid Market, by Grade, 2016-2026 (USD Million)
        TABLE 17 Asia Pacific Electronic Grade Sulfuric acid Market, by Grade, 2016-2026 (Kilo Tons)
        TABLE 18 Asia Pacific Electronic Grade Sulfuric acid Market, by Application, 2016-2026 (USD Million)
        TABLE 19 Asia Pacific Electronic Grade Sulfuric acid Market, by Application, 2016-2026 (Kilo Tons)
        TABLE 20 Latin America Electronic Grade Sulfuric acid Market, by Grade, 2016-2026 (USD Million)
        TABLE 21 Latin America Electronic Grade Sulfuric acid Market, by Grade, 2016-2026 (Kilo Tons)
        TABLE 22 Latin America Electronic Grade Sulfuric acid Market, by Application, 2016-2026 (USD Million)
        TABLE 23 Latin America Electronic Grade Sulfuric acid Market, by Application, 2016-2026 (Kilo Tons)
        TABLE 24 The Middle-East and Africa Electronic Grade Sulfuric acid Market, by Grade, 2016-2026 (USD Million)
        TABLE 25 The Middle-East and Africa Electronic Grade Sulfuric acid Market, by Grade, 2016-2026 (Kilo Tons)
        TABLE 26 The Middle-East and Africa Electronic Grade Sulfuric acid Market, by Application, 2016-2026 (USD Million)
        TABLE 27 The Middle-East and Africa Electronic Grade Sulfuric acid Market, by Application, 2016-2026 (Kilo Tons)
        TABLE 28 North America Electronic Grade Sulfuric acid Production, Consumption, Export, Import, 2016-2019
        TABLE 29 Europe Electronic Grade Sulfuric acid Production, Consumption, Export, Import, 2016-2019
        TABLE 30 Asia Pacific Electronic Grade Sulfuric acid Production, Consumption, Export, Import, 2016-2019
        TABLE 31 Latin America Electronic Grade Sulfuric acid Production, Consumption, Export, Import, 2016-2019
        TABLE 32 Middle East & Africa Electronic Grade Sulfuric acid Production, Consumption, Export, Import, 2016-2019
        TABLE 33 Global Electronic Grade Sulfuric acid Market - Company Revenue Analysis 2016-2019 (USD Million)
        TABLE 34 Global Electronic Grade Sulfuric acid Market - Company Revenue Share Analysis 2016-2019(%)
        TABLE 35 Global Electronic Grade Sulfuric acid Market - Company Volume Analysis 2016-2019 (Kilo Tons)
        TABLE 36 Global Electronic Grade Sulfuric acid Market - Company Volume Share Analysis 2016-2019(%)
        TABLE 37 Acquisitions and Mergers
        TABLE 38 New Product/Service Launch
        TABLE 39 Research & Development Activities
        TABLE 40 Market Drivers
        TABLE 41 Market Restraints
        TABLE 42 Market Opportunities
        TABLE 43 Production Base and Market Concentration Rate of Raw Material
        TABLE 44 Key Suppliers of Raw Materials
        TABLE 45 Raw Materials Sources of Electronic Grade Sulfuric acid Major Manufacturers in 2016
        TABLE 46 Major Buyers of Electronic Grade Sulfuric acid
        TABLE 47 Distributors/Traders of Electronic Grade Sulfuric acid by Region
        

Industry Major Market Players

  • BASF SE
  • Moses Lake Industries
  • INEOS Group Holdings S.A.
  • Reagent Chemicals
  • Trident Group
  • Chemtrade Logistics
  • PVS Chemicals
  • KMG Chemicals
  • The Linde Group
  • Kanto Chemical Co.Inc.