Search Market Research Report

Discover Our Latest Reports
Discover Our Featured Reports
Discover Top Selling Reports

E-Tourism Market Size, Share Global Analysis Report, 2021 – 2026

report img

E-Tourism Market By Type (Computer Reservation System, Property Management Systems, Social Networks, & Global Distribution Systems), By Application (Hospitality Industry and Aerospace & Medical Industry), and By Regions – Global & Regional Industry Perspective, Comprehensive Analysis, and Forecast 2021 – 2026

Industry Insights

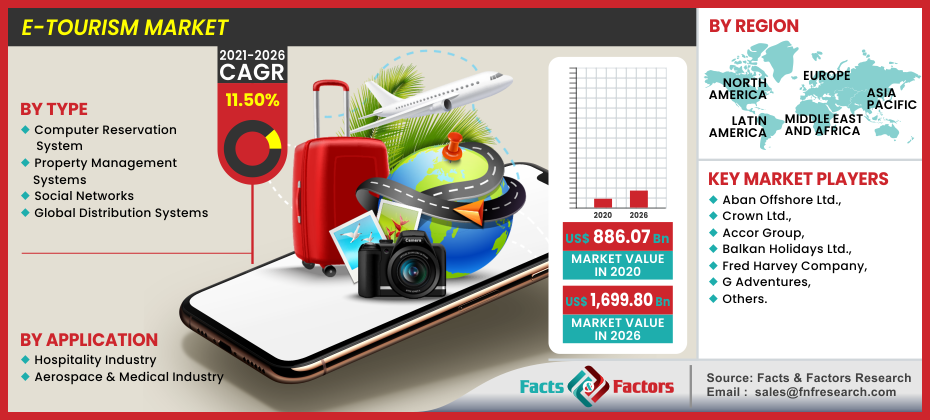
[196+ Pages Report] According to Facts and Factors' newest study, the global E-tourism market was valued at over USD 886.07 billion in 2020, and is predicted to reach USD 1,699.80 billion by the end of 2026, rising at an extraordinary CAGR of nearly 11.50% between 2021 and 2026.

logoMarket Overview

E-tourism is the package that refers to the use of technological and virtual communication for integrating the tourism sector. E-tourism involves the digitization processes that are involved in the traditional tourism market for better functionality and usability for quicker solutions in sectors of the value chain that deal with the logistics of the following. It involves procurement and booking of flights, hotels, reservations, car renting services, and other forms of travel that are required. The E-tourism industry relies heavily on internet-based services for all forms of support that make the consumers travel more leisurely and comfortably on. Furthermore, they provide a smooth form of communication between all chains involved in the process.

logoIndustry Growth Factors

The major factor associated with the steadiness in the growth of the e-tourism sector can be contributed to the comfort that comes associated with a well-implemented system. Electronic communications allows for a far greater reach across consumers in untapped markets. Furthermore, with growing connectivity services and greater advancements in technology in the smartphone sector, the growth of the e-tourism market seems to be capped at a stable rate for the forecast. Furthermore, complete access to all the latest travel guides and access points to relevant locations help consumers plan their routes in a well-advanced manner. This takes away the major physical exertion consumers feel during travel plans. These factors further propel the growth of the e-tourism market to a great extent.

The heavy dependency on technological framework might restrain the growth of the e-tourism market to a certain extent. Additionally, the lack of compatible computers or smartphones on consumers for easy access will also hamper the growth of the market during the forecast period. Furthermore, with an increase in phishing attacks and misleading information being posted all across the internet, consumers are bound to fall for these pitfalls which takes away some share of the consumer base from the e-tourism market.
E-Tourism Market

To know more about this report | Request Free Sample Copy

logoSegmentation Analysis

The global e-tourism market can be segmented on the basis of type, applications, and regions.

On the basis of type, the global e-tourism market can be divided on the basis of computer reservation systems, property management systems, social networks, and global distribution systems. On the basis of applications, the global e-tourism market can be divided into the hospitality industry and the aerospace & medical industry. The hospitality industry is expected to witness the highest market share during the forecast period owing to an increase in demand from consumers for international and inter-region travel.

logoReport Scope

Report Attribute

Details

Market Size in 2020

USD 886.07 Billion

Projected Market Size in 2026

USD 1,699.80 Billion

CAGR Growth Rate

11.50% CAGR

Base Year

2020

Forecast Years

2021-2026

Key Market Players

Aban Offshore Ltd., Crown Ltd., Accor Group, Balkan Holidays Ltd., Fred Harvey Company, and G Adventures, among others.

Key Segment

By Type, Application, and Region

Major Regions Covered

North America, Europe, Asia Pacific, Latin America, and the Middle East & Africa

Purchase Options

Request customized purchase options to meet your research needs.Explore purchase options

logo Regional Analysis

North America is expected to recoup the largest market share during the forecast period. Factors pertaining to technological advancements with improved access systems for consumers will drive the market in the region. Additionally, the region possesses some of the most aesthetic visual creations in the world which makes them a constant hotspot for global tourist hoarding. Additionally, the region of Asia-Pacific is expected to witness the highest growth CAGR during the forecast period. Countries in the region that account for the largest contribution in the region are Japan, India, and China.

logo Competitive Players

The major participants in the global e-tourism market are :

  • Aban Offshore Ltd.
  • Crown Ltd.
  • Accor Group
  • Balkan Holidays Ltd.
  • Fred Harvey Company
  • G Adventures

logo By Type Segment Analysis

  • Computer Reservation System
  • Property Management Systems
  • Social Networks
  • Global Distribution Systems

logo By Application Segment Analysis

  • Hospitality Industry
  • Aerospace & Medical Industry

logo By Regional Segment Analysis

  • North America
    • U.S.
    • Canada
  • Europe
    • UK
    • France
    • Germany
    • Italy
    • Spain
    • Rest of Europe
  • Asia Pacific
    • China
    • Japan
    • India
    • South Korea
    • Southeast Asia
    • Rest of Asia Pacific
  • Latin America
    • Brazil
    • Mexico
    • Rest of Latin America
  • Middle East and Africa
    • GCC Countries
    • South Africa
    • Rest of MEA

Table of Content

  1. Chapter 1 Executive Summary
    1. 1.1. Introduction of E-Tourism
    2. 1.2. Global E-Tourism Market, 2020 & 2026 (USD Million)
    3. 1.3. Global E-Tourism Market, 2016 – 2026 (USD Million)
    4. 1.4. Global E-Tourism Market Absolute Revenue Opportunity, 2016 – 2026 (USD Million)
    5. 1.5. Global E-Tourism Market Incremental Revenue Opportunity, 2016 – 2026 (USD Million)
  2. Chapter 2 E-Tourism Market – Types Analysis
    1. 2.1. Global E-Tourism Market – Types Overview
    2. 2.2. Global E-Tourism Market Share, by Types, 2020 & 2026 (USD Million)
    3. 2.3. Global E-Tourism Market share, by Types, 2020 & 2026
    4. 2.4. Computer Reservation System
      1. 2.4.1. Global Computer Reservation System E-Tourism Market, 2016 – 2026 (USD Million)
      2. 2.4.2. Global Computer Reservation System E-Tourism Market, 2016 – 2026
    5. 2.5. Property Management Systems
      1. 2.5.1. Global Property Management Systems E-Tourism Market, 2016 – 2026 (USD Million)
      2. 2.5.2. Global Property Management Systems E-Tourism Market, 2016 – 2026
    6. 2.6. Social Networks
      1. 2.6.1. Global Social Networks E-Tourism Market, 2016 – 2026 (USD Million)
      2. 2.6.2. Global Social Networks E-Tourism Market, 2016 – 2026
    7. 2.7. Global Distribution Systems
      1. 2.7.1. Global Global Distribution Systems E-Tourism Market, 2016 – 2026 (USD Million)
      2. 2.7.2. Global Global Distribution Systems E-Tourism Market, 2016 – 2026
  3. Chapter 3 E-Tourism Market – Application Analysis
    1. 3.1. Global E-Tourism Market – Application Overview
    2. 3.2. Global E-Tourism Market Share, by Application, 2020 & 2026 (USD Million)
    3. 3.3. Global E-Tourism Market share, by Application, 2020 & 2026
    4. 3.4. Hospitality Industry
      1. 3.4.1. Global Hospitality Industry E-Tourism Market, 2016 – 2026 (USD Million)
      2. 3.4.2. Global Hospitality Industry E-Tourism Market, 2016 – 2026
    5. 3.5. Aerospace & Medical Industry
      1. 3.5.1. Global Aerospace & Medical Industry E-Tourism Market, 2016 – 2026 (USD Million)
      2. 3.5.2. Global Aerospace & Medical Industry E-Tourism Market, 2016 – 2026
  4. Chapter 4 E-Tourism Market – Regional Analysis
    1. 4.1. Global E-Tourism Market Regional Overview
    2. 4.2. Global E-Tourism Market Share, by Region, 2020 & 2026 (USD Million)
    3. 4.3. Global E-Tourism Market Share, by Region, 2020 & 2026
    4. 4.4. North America
      1. 4.4.1. North America E-Tourism Market, 2016 – 2026 (USD Million)
        1. 4.4.1.1. North America E-Tourism Market, by Country, 2016 – 2026 (USD Million)
      2. 4.4.2. North America Market, 2016 – 2026
        1. 4.4.2.1. North America E-Tourism Market, by Country, 2016 – 2026
      3. 4.4.3. North America E-Tourism Market, by Types, 2016 – 2026
        1. 4.4.3.1. North America E-Tourism Market, by Types, 2016 – 2026 (USD Million)
        2. 4.4.3.2. North America E-Tourism Market, by Types, 2016 – 2026
      4. 4.4.4. North America E-Tourism Market, by Application, 2016 – 2026
        1. 4.4.4.1. North America E-Tourism Market, by Application, 2016 – 2026 (USD Million)
        2. 4.4.4.2. North America E-Tourism Market, by Application, 2016 – 2026
      5. 4.4.5. U.S.
        1. 4.4.5.1. U.S. E-Tourism Market, 2016 – 2026 (USD Million)
        2. 4.4.5.2. U.S. E-Tourism Market, 2016 – 2026
      6. 4.4.6. Canada
        1. 4.4.6.1. Canada E-Tourism Market, 2016 – 2026 (USD Million)
        2. 4.4.6.2. Canada E-Tourism Market, 2016 – 2026
    5. 4.5. Europe
      1. 4.5.1. Europe E-Tourism Market, 2016 – 2026 (USD Million)
        1. 4.5.1.1. Europe E-Tourism Market, by Country, 2016 – 2026 (USD Million)
      2. 4.5.2. Europe Market, 2016 – 2026
        1. 4.5.2.1. Europe E-Tourism Market, by Country, 2016 – 2026
      3. 4.5.3. Europe E-Tourism Market, by Types, 2016 – 2026
        1. 4.5.3.1. Europe E-Tourism Market, by Types, 2016 – 2026 (USD Million)
        2. 4.5.3.2. Europe E-Tourism Market, by Types, 2016 – 2026
      4. 4.5.4. Europe E-Tourism Market, by Application, 2016 – 2026
        1. 4.5.4.1. Europe E-Tourism Market, by Application, 2016 – 2026 (USD Million)
        2. 4.5.4.2. Europe E-Tourism Market, by Application, 2016 – 2026
      5. 4.5.5. Germany
        1. 4.5.5.1. Germany E-Tourism Market, 2016 – 2026 (USD Million)
        2. 4.5.5.2. Germany E-Tourism Market, 2016 – 2026
      6. 4.5.6. France
        1. 4.5.6.1. France E-Tourism Market, 2016 – 2026 (USD Million)
        2. 4.5.6.2. France E-Tourism Market, 2016 – 2026
      7. 4.5.7. U.K.
        1. 4.5.7.1. U.K. E-Tourism Market, 2016 – 2026 (USD Million)
        2. 4.5.7.2. U.K. E-Tourism Market, 2016 – 2026
      8. 4.5.8. Italy
        1. 4.5.8.1. Italy E-Tourism Market, 2016 – 2026 (USD Million)
        2. 4.5.8.2. Italy E-Tourism Market, 2016 – 2026
      9. 4.5.9. Spain
        1. 4.5.9.1. Spain E-Tourism Market, 2016 – 2026 (USD Million)
        2. 4.5.9.2. Spain E-Tourism Market, 2016 – 2026
      10. 4.5.10. Rest of Europe
        1. 4.5.10.1. Rest of Europe E-Tourism Market, 2016 – 2026 (USD Million)
        2. 4.5.10.2. Rest of Europe E-Tourism Market, 2016 – 2026
    6. 4.6. Asia Pacific
      1. 4.6.1. Asia Pacific E-Tourism Market, 2016 – 2026 (USD Million)
        1. 4.6.1.1. Asia Pacific E-Tourism Market, by Country, 2016 – 2026 (USD Million)
      2. 4.6.2. Asia Pacific Market, 2016 – 2026
        1. 4.6.2.1. Asia Pacific E-Tourism Market, by Country, 2016 – 2026
      3. 4.6.3. Asia Pacific E-Tourism Market, by Types, 2016 – 2026
        1. 4.6.3.1. Asia Pacific E-Tourism Market, by Types, 2016 – 2026 (USD Million)
        2. 4.6.3.2. Asia Pacific E-Tourism Market, by Types, 2016 – 2026
      4. 4.6.4. Asia Pacific E-Tourism Market, by Application, 2016 – 2026
        1. 4.6.4.1. Asia Pacific E-Tourism Market, by Application, 2016 – 2026 (USD Million)
        2. 4.6.4.2. Asia Pacific E-Tourism Market, by Application, 2016 – 2026
      5. 4.6.5. China
        1. 4.6.5.1. China E-Tourism Market, 2016 – 2026 (USD Million)
        2. 4.6.5.2. China E-Tourism Market, 2016 – 2026
      6. 4.6.6. Japan
        1. 4.6.6.1. Japan E-Tourism Market, 2016 – 2026 (USD Million)
        2. 4.6.6.2. Japan E-Tourism Market, 2016 – 2026
      7. 4.6.7. India
        1. 4.6.7.1. India E-Tourism Market, 2016 – 2026 (USD Million)
        2. 4.6.7.2. India E-Tourism Market, 2016 – 2026
      8. 4.6.8. South Korea
        1. 4.6.8.1. South Korea E-Tourism Market, 2016 – 2026 (USD Million)
        2. 4.6.8.2. South Korea E-Tourism Market, 2016 – 2026
      9. 4.6.9. South-East Asia
        1. 4.6.9.1. South-East Asia E-Tourism Market, 2016 – 2026 (USD Million)
        2. 4.6.9.2. South-East Asia E-Tourism Market, 2016 – 2026
      10. 4.6.10. Rest of Asia Pacific
        1. 4.6.10.1. Rest of Asia Pacific E-Tourism Market, 2016 – 2026 (USD Million)
        2. 4.6.10.2. Rest of Asia Pacific E-Tourism Market, 2016 – 2026
    7. 4.7. Latin America
      1. 4.7.1. Latin America E-Tourism Market, 2016 – 2026 (USD Million)
        1. 4.7.1.1. Latin America E-Tourism Market, by Country, 2016 – 2026 (USD Million)
      2. 4.7.2. Latin America Market, 2016 – 2026
        1. 4.7.2.1. Latin America E-Tourism Market, by Country, 2016 – 2026
      3. 4.7.3. Latin America E-Tourism Market, by Types, 2016 – 2026
        1. 4.7.3.1. Latin America E-Tourism Market, by Types, 2016 – 2026 (USD Million)
        2. 4.7.3.2. Latin America E-Tourism Market, by Types, 2016 – 2026
      4. 4.7.4. Latin America E-Tourism Market, by Application, 2016 – 2026
        1. 4.7.4.1. Latin America E-Tourism Market, by Application, 2016 – 2026 (USD Million)
        2. 4.7.4.2. Latin America E-Tourism Market, by Application, 2016 – 2026
      5. 4.7.5. Brazil
        1. 4.7.5.1. Brazil E-Tourism Market, 2016 – 2026 (USD Million)
        2. 4.7.5.2. Brazil E-Tourism Market, 2016 – 2026
      6. 4.7.6. Mexico
        1. 4.7.6.1. Mexico E-Tourism Market, 2016 – 2026 (USD Million)
        2. 4.7.6.2. Mexico E-Tourism Market, 2016 – 2026
      7. 4.7.7. Rest of Latin America
        1. 4.7.7.1. Rest of Latin America E-Tourism Market, 2016 – 2026 (USD Million)
        2. 4.7.7.2. Rest of Latin America E-Tourism Market, 2016 – 2026
    8. 4.8. The Middle-East and Africa
      1. 4.8.1. The Middle-East and Africa E-Tourism Market, 2016 – 2026 (USD Million)
        1. 4.8.1.1. The Middle-East and Africa E-Tourism Market, by Country, 2016 – 2026 (USD Million)
      2. 4.8.2. The Middle-East and Africa Market, 2016 – 2026
        1. 4.8.2.1. The Middle-East and Africa E-Tourism Market, by Country, 2016 – 2026
      3. 4.8.3. The Middle-East and Africa E-Tourism Market, by Types, 2016 – 2026
        1. 4.8.3.1. The Middle-East and Africa E-Tourism Market, by Types, 2016 – 2026 (USD Million)
        2. 4.8.3.2. The Middle-East and Africa E-Tourism Market, by Types, 2016 – 2026
      4. 4.8.4. The Middle-East and Africa E-Tourism Market, by Application, 2016 – 2026
        1. 4.8.4.1. The Middle-East and Africa E-Tourism Market, by Application, 2016 – 2026 (USD Million)
        2. 4.8.4.2. The Middle-East and Africa E-Tourism Market, by Application, 2016 – 2026
      5. 4.8.5. GCC Countries
        1. 4.8.5.1. GCC Countries E-Tourism Market, 2016 – 2026 (USD Million)
        2. 4.8.5.2. GCC Countries E-Tourism Market, 2016 – 2026
      6. 4.8.6. South Africa
        1. 4.8.6.1. South Africa E-Tourism Market, 2016 – 2026 (USD Million)
        2. 4.8.6.2. South Africa E-Tourism Market, 2016 – 2026
      7. 4.8.7. Rest of Middle-East Africa
        1. 4.8.7.1. Rest of Middle-East Africa E-Tourism Market, 2016 – 2026 (USD Million)
        2. 4.8.7.2. Rest of Middle-East Africa E-Tourism Market, 2016 – 2026
  5. Chapter 5 E-Tourism Production, Consumption, Export, Import by Regions
    1. 5.1. Global E-Tourism Production and Consumption, 2016 – 2026
    2. 5.2. Global Import and Export Analysis, by Region
  6. Chapter 6 E-Tourism Market – Competitive Landscape
    1. 6.1. Competitor Market Share – Revenue
    2. 6.2. Market Concentration Rate Analysis, Top 3 and Top 5 Players
    3. 6.3. Competitor Market Share – Volume
    4. 6.4. Strategic Developments
      1. 6.4.1. Acquisitions and Mergers
      2. 6.4.2. New Products
      3. 6.4.3. Research & Development Activities
  7. Chapter 7 Company Profiles
    1. 7.1. Aban Offshore Ltd
      1. 7.1.1. Company Overview
      2. 7.1.2. Product/Service Portfolio
      3. 7.1.3. Aban Offshore Ltd Sales, Revenue, Price, and Gross Margin
      4. 7.1.4. Aban Offshore Ltd Revenue and Growth Rate
      5. 7.1.5. Aban Offshore Ltd Market Share
      6. 7.1.6. Recent Initiatives, Funding/VC Activities, and Technological Innovations
    2. 7.2. Crown Ltd
      1. 7.2.1. Company Overview
      2. 7.2.2. Product/Service Portfolio
      3. 7.2.3. Crown Ltd Sales, Revenue, Price, and Gross Margin
      4. 7.2.4. Crown Ltd Revenue and Growth Rate
      5. 7.2.5. Crown Ltd Market Share
      6. 7.2.6. Recent Initiatives, Funding/VC Activities, and Technological Innovations
    3. 7.3. Accor Group
      1. 7.3.1. Company Overview
      2. 7.3.2. Product/Service Portfolio
      3. 7.3.3. Accor Group Sales, Revenue, Price, and Gross Margin
      4. 7.3.4. Accor Group Revenue and Growth Rate
      5. 7.3.5. Accor Group Market Share
      6. 7.3.6. Recent Initiatives, Funding/VC Activities, and Technological Innovations
    4. 7.4. Balkan Holidays Ltd
      1. 7.4.1. Company Overview
      2. 7.4.2. Product/Service Portfolio
      3. 7.4.3. Balkan Holidays Ltd Sales, Revenue, Price, and Gross Margin
      4. 7.4.4. Balkan Holidays Ltd Revenue and Growth Rate
      5. 7.4.5. Balkan Holidays Ltd Market Share
      6. 7.4.6. Recent Initiatives, Funding/VC Activities, and Technological Innovations
    5. 7.5. Fred Harvey Company
      1. 7.5.1. Company Overview
      2. 7.5.2. Product/Service Portfolio
      3. 7.5.3. Fred Harvey Company Sales, Revenue, Price, and Gross Margin
      4. 7.5.4. Fred Harvey Company Revenue and Growth Rate
      5. 7.5.5. Fred Harvey Company Market Share
      6. 7.5.6. Recent Initiatives, Funding/VC Activities, and Technological Innovations
    6. 7.6. G Adventures
      1. 7.6.1. Company Overview
      2. 7.6.2. Product/Service Portfolio
      3. 7.6.3. G Adventures Sales, Revenue, Price, and Gross Margin
      4. 7.6.4. G Adventures Revenue and Growth Rate
      5. 7.6.5. G Adventures Market Share
      6. 7.6.6. Recent Initiatives, Funding/VC Activities, and Technological Innovations
  8. Chapter 8 E-Tourism — Industry Analysis
    1. 8.1. Introduction and Taxonomy
    2. 8.2. E-Tourism Market – Key Trends
      1. 8.2.1. Market Drivers
      2. 8.2.2. Market Restraints
      3. 8.2.3. Market Opportunities
    3. 8.3. Value Chain Analysis
    4. 8.4. Key Mandates and Regulations
    5. 8.5. Technology Roadmap and Timeline
    6. 8.6. E-Tourism Market – Attractiveness Analysis
      1. 8.6.1. By Types
      2. 8.6.2. By Application
      3. 8.6.3. By Region
  9. Chapter 9 Raw Material Analysis
    1. 9.1. E-Tourism Key Raw Material Analysis
      1. 9.1.1. Key Raw Materials
      2. 9.1.2. Price Trend of Key Raw Materials
    2. 9.2. Key Suppliers of Raw Materials
    3. 9.3. Proportion of Manufacturing Cost Structure
      1. 9.3.1. Raw Materials Cost
      2. 9.3.2. Labor Cost
      3. 9.3.3. Manufacturing Expenses
      4. 9.3.4. Miscellaneous Expenses
    4. 9.4. Manufacturing Cost Analysis of E-Tourism
  10. Chapter 10 Industrial Chain, Sourcing Strategy, and Downstream Buyers
    1. 10.1. E-Tourism Industrial Chain Analysis
    2. 10.2. Upstream Raw Materials Sourcing
      1. 10.2.1. Risk Mitigation:
      2. 10.2.2. Supplier Relationships:
      3. 10.2.3. Business Processes:
      4. 10.2.4. Securing the Product:
    3. 10.3. Raw Materials Sources of E-Tourism Major Manufacturers
    4. 10.4. Downstream Buyers
    5. 10.5. Distributors/Traders List
  11. Chapter 11 Marketing Strategy Analysis, Distributors
    1. 11.1. Marketing Channel
    2. 11.2. Direct Marketing
    3. 11.3. Indirect Marketing
    4. 11.4. Marketing Channel Development Trends
    5. 11.5. Economic/Political Environmental Change
  12. Chapter 12 Report Conclusion & Key Insights
    1. 12.1. Key Insights from Primary Interviews & Surveys Respondents
    2. 12.2. Key Takeaways from Analysts, Consultants, and Industry Leaders
  13. Chapter 13 Research Approach & Methodology
    1. 13.1. Report Description
    2. 13.2. Research Scope
    3. 13.3. Research Methodology
      1. 13.3.1. Secondary Research
      2. 13.3.2. Primary Research
      3. 13.3.3. Statistical Models
        1. 13.3.3.1. Company Share Analysis Model
        2. 13.3.3.2. Revenue Based Modeling
      4. 13.3.4. Research Limitations

      List of Figures

      Fig.1	Product Picture of E-Tourism
      Fig.2	Global E-Tourism Market, 2016 – 2026 (USD Million)
      Fig.3	Global E-Tourism Market, 2016 – 2026  
      Fig.4	Global E-Tourism Market Absolute Revenue Opportunity, 2016 – 2026 (USD Million)
      Fig.5	Global E-Tourism Market Incremental Revenue Opportunity, 2016 – 2026 (USD Million)
      Fig.6	Global E-Tourism Market Share, by Types, 2020 & 2026 (USD Million)
      Fig.7	Global E-Tourism Market Share, by Types, 2020 & 2026  
      Fig.8	Global Computer Reservation System E-Tourism Market, 2016 – 2026 (USD Million)
      Fig.9	Global Computer Reservation System E-Tourism Market, 2016 – 2026  
      Fig.10	Global Property Management Systems E-Tourism Market, 2016 – 2026 (USD Million)
      Fig.11	Global Property Management Systems E-Tourism Market, 2016 – 2026  
      Fig.12	Global Social Networks E-Tourism Market, 2016 – 2026 (USD Million)
      Fig.13	Global Social Networks E-Tourism Market, 2016 – 2026  
      Fig.14	Global Global Distribution Systems E-Tourism Market, 2016 – 2026 (USD Million)
      Fig.15	Global Global Distribution Systems E-Tourism Market, 2016 – 2026  
      Fig.16	Global E-Tourism Market Share, by Application, 2020 & 2026 (USD Million)
      Fig.17	Global E-Tourism Market Share, by Application, 2020 & 2026  
      Fig.18	Global Hospitality Industry E-Tourism Market, 2016 – 2026 (USD Million)
      Fig.19	Global Hospitality Industry E-Tourism Market, 2016 – 2026  
      Fig.20	Global Aerospace & Medical Industry E-Tourism Market, 2016 – 2026 (USD Million)
      Fig.21	Global Aerospace & Medical Industry E-Tourism Market, 2016 – 2026  
      Fig.22	Global E-Tourism Market Share, by Region, 2020 & 2026 (USD Million)
      Fig.23	Global E-Tourism Market Share, by Region, 2020 & 2026  
      Fig.24	North America E-Tourism Market, 2016 – 2026 (USD Million)
      Fig.25	North America E-Tourism Market, 2016 – 2026  
      Fig.26	U.S. E-Tourism Market, 2016 – 2026 (USD Million)
      Fig.27	U.S. E-Tourism  Market, 2016 – 2026  
      Fig.28	Canada E-Tourism Market, 2016 – 2026 (USD Million)
      Fig.29	Canada E-Tourism  Market, 2016 – 2026  
      Fig.30	Europe E-Tourism Market, 2016 – 2026 (USD Million)
      Fig.31	Europe E-Tourism Market, 2016 – 2026  
      Fig.32	Germany E-Tourism Market, 2016 – 2026 (USD Million)
      Fig.33	Germany E-Tourism  Market, 2016 – 2026  
      Fig.34	France E-Tourism Market, 2016 – 2026 (USD Million)
      Fig.35	France E-Tourism  Market, 2016 – 2026  
      Fig.36	U.K. E-Tourism Market, 2016 – 2026 (USD Million)
      Fig.37	U.K. E-Tourism  Market, 2016 – 2026  
      Fig.38	Italy E-Tourism Market, 2016 – 2026 (USD Million)
      Fig.39	Italy E-Tourism  Market, 2016 – 2026  
      Fig.40	Spain E-Tourism Market, 2016 – 2026 (USD Million)
      Fig.41	Spain E-Tourism  Market, 2016 – 2026  
      Fig.42	Rest of Europe E-Tourism Market, 2016 – 2026 (USD Million)
      Fig.43	Rest of Europe E-Tourism  Market, 2016 – 2026  
      Fig.44	Asia Pacific E-Tourism Market, 2016 – 2026 (USD Million)
      Fig.45	Asia Pacific E-Tourism Market, 2016 – 2026  
      Fig.46	China E-Tourism Market, 2016 – 2026 (USD Million)
      Fig.47	China E-Tourism  Market, 2016 – 2026  
      Fig.48	Japan E-Tourism Market, 2016 – 2026 (USD Million)
      Fig.49	Japan E-Tourism  Market, 2016 – 2026  
      Fig.50	India E-Tourism Market, 2016 – 2026 (USD Million)
      Fig.51	India E-Tourism  Market, 2016 – 2026  
      Fig.52	South  Korea E-Tourism Market, 2016 – 2026 (USD Million)
      Fig.53	South  Korea E-Tourism  Market, 2016 – 2026  
      Fig.54	South-East Asia E-Tourism Market, 2016 – 2026 (USD Million)
      Fig.55	South-East Asia E-Tourism  Market, 2016 – 2026  
      Fig.56	Rest of Asia Pacific E-Tourism Market, 2016 – 2026 (USD Million)
      Fig.57	Rest of Asia Pacific E-Tourism  Market, 2016 – 2026  
      Fig.58	Latin America E-Tourism Market, 2016 – 2026 (USD Million)
      Fig.59	Latin America E-Tourism Market, 2016 – 2026  
      Fig.60	Brazil E-Tourism Market, 2016 – 2026 (USD Million)
      Fig.61	Brazil E-Tourism  Market, 2016 – 2026  
      Fig.62	Mexico E-Tourism Market, 2016 – 2026 (USD Million)
      Fig.63	Mexico E-Tourism  Market, 2016 – 2026  
      Fig.64	Rest of Latin America E-Tourism Market, 2016 – 2026 (USD Million)
      Fig.65	Rest of Latin America E-Tourism  Market, 2016 – 2026  
      Fig.66	The Middle-East and Africa E-Tourism Market, 2016 – 2026 (USD Million)
      Fig.67	The Middle-East and Africa E-Tourism Market, 2016 – 2026  
      Fig.68	GCC Countries E-Tourism Market, 2016 – 2026 (USD Million)
      Fig.69	GCC Countries E-Tourism  Market, 2016 – 2026  
      Fig.70	South Africa E-Tourism Market, 2016 – 2026 (USD Million)
      Fig.71	South Africa E-Tourism  Market, 2016 – 2026  
      Fig.72	Rest of Middle-East Africa E-Tourism Market, 2016 – 2026 (USD Million)
      Fig.73	Rest of Middle-East Africa E-Tourism  Market, 2016 – 2026  
      Fig.74	Global E-Tourism Production and Consumption, 2016 – 2026  
      Fig.75	North America E-Tourism Production and Consumption, 2016 – 2026 (USD Million)  
      Fig.76	Europe E-Tourism Production and Consumption, 2016 – 2026 (USD Million)  
      Fig.77	Asia Pacific E-Tourism Production and Consumption, 2016 – 2026 (USD Million)  
      Fig.78	Latin America E-Tourism Production and Consumption, 2016 – 2026 (USD Million)  
      Fig.79	The Middle-East and Africa E-Tourism Production and Consumption, 2016 – 2026 (USD Million)  
      Fig.80	Competitor Market Share – Revenue
      Fig.81	Competitor Market Share – Volume
      Fig.82	Aban Offshore Ltd Revenue and Growth Rate
      Fig.83	Aban Offshore Ltd Market Share
      Fig.84	Crown Ltd Revenue and Growth Rate
      Fig.85	Crown Ltd Market Share
      Fig.86	Accor Group Revenue and Growth Rate
      Fig.87	Accor Group Market Share
      Fig.88	Balkan Holidays Ltd Revenue and Growth Rate
      Fig.89	Balkan Holidays Ltd Market Share
      Fig.90	Fred Harvey Company Revenue and Growth Rate
      Fig.91	Fred Harvey Company Market Share
      Fig.92	G Adventures Revenue and Growth Rate
      Fig.93	G Adventures Market Share
      Fig.94	Market Dynamics
      Fig.95	Global E-Tourism – Value Chain Analysis
      Fig.96	Key Mandates and Regulations
      Fig.97	Technology Roadmap and Timeline
      Fig.98	Market Attractiveness Analysis – By Types
      Fig.99	Market Attractiveness Analysis – By Application
      Fig.100	Market Attractiveness Analysis – By Region
      Fig.101	Manufacturing Cost Structure of E-Tourism
      Fig.102	E-Tourism Industrial Chain Analysis
      Fig.103	Market Channels
      Fig.104	Marketing Channel Development Trend
      Fig.105	Growth in World Gross Product, 2008-2018
      

      List of Tables

      Table 1	Global E-Tourism Market, 2020 & 2026 (USD Million)
      Table 2	Global E-Tourism Market, by Types, 2016 – 2026 (USD Million)
      Table 3	Global E-Tourism Market, by Types, 2016 – 2026  
      Table 4	Global E-Tourism Market, by Application, 2016 – 2026 (USD Million)
      Table 5	Global E-Tourism Market, by Application, 2016 – 2026  
      Table 6	Global E-Tourism Market, by Region, 2016 – 2026 (USD Million)
      Table 7	Global E-Tourism Market, by Region, 2016 – 2026  
      Table 8	North America E-Tourism Market, by Country, 2016 – 2026 (USD Million)
      Table 9	North America E-Tourism Market, by Country, 2016 – 2026  
      Table 10 North America E-Tourism Market, by Types, 2016 – 2026 (USD Million)
      Table 11 North America E-Tourism Market, by Types, 2016 – 2026  
      Table 12 North America E-Tourism Market, by Application, 2016 – 2026 (USD Million)
      Table 13 North America E-Tourism Market, by Application, 2016 – 2026  
      Table 14 Europe E-Tourism Market, by Country, 2016 – 2026 (USD Million)
      Table 15 Europe E-Tourism Market, by Country, 2016 – 2026  
      Table 16 Europe E-Tourism Market, by Types, 2016 – 2026 (USD Million)
      Table 17 Europe E-Tourism Market, by Types, 2016 – 2026  
      Table 18 Europe E-Tourism Market, by Application, 2016 – 2026 (USD Million)
      Table 19 Europe E-Tourism Market, by Application, 2016 – 2026  
      Table 20 Asia Pacific E-Tourism Market, by Country, 2016 – 2026 (USD Million)
      Table 21 Asia Pacific E-Tourism Market, by Country, 2016 – 2026  
      Table 22 Asia Pacific E-Tourism Market, by Types, 2016 – 2026 (USD Million)
      Table 23 Asia Pacific E-Tourism Market, by Types, 2016 – 2026  
      Table 24 Asia Pacific E-Tourism Market, by Application, 2016 – 2026 (USD Million)
      Table 25 Asia Pacific E-Tourism Market, by Application, 2016 – 2026  
      Table 26 Latin America E-Tourism Market, by Country, 2016 – 2026 (USD Million)
      Table 27 Latin America E-Tourism Market, by Country, 2016 – 2026  
      Table 28 Latin America E-Tourism Market, by Types, 2016 – 2026 (USD Million)
      Table 29 Latin America E-Tourism Market, by Types, 2016 – 2026  
      Table 30 Latin America E-Tourism Market, by Application, 2016 – 2026 (USD Million)
      Table 31 Latin America E-Tourism Market, by Application, 2016 – 2026  
      Table 32 The Middle-East and Africa E-Tourism Market, by Country, 2016 – 2026 (USD Million)
      Table 33 The Middle-East and Africa E-Tourism Market, by Country, 2016 – 2026  
      Table 34 The Middle-East and Africa E-Tourism Market, by Types, 2016 – 2026 (USD Million)
      Table 35 The Middle-East and Africa E-Tourism Market, by Types, 2016 – 2026  
      Table 36 The Middle-East and Africa E-Tourism Market, by Application, 2016 – 2026 (USD Million)
      Table 37 The Middle-East and Africa E-Tourism Market, by Application, 2016 – 2026  
      Table 38 North America E-Tourism Production, Consumption, Export, Import, 2016 – 2020
      Table 39 Europe E-Tourism Production, Consumption, Export, Import, 2016 – 2020
      Table 40 Asia Pacific E-Tourism Production, Consumption, Export, Import, 2016 – 2020
      Table 41 Latin America E-Tourism Production, Consumption, Export, Import, 2016 – 2020
      Table 42 The Middle-East and Africa E-Tourism Production, Consumption, Export, Import, 2016 – 2020
      Table 43 Global E-Tourism Market - Company Revenue Analysis, 2016 – 2019 (USD Million)
      Table 44 Global E-Tourism Market - Company Revenue Share Analysis, 2016 – 2019 (%)
      Table 45 Global E-Tourism Market - Company Volume Analysis, 2016 – 2020  
      Table 46 Global E-Tourism Market - Company Volume Share Analysis, 2016 – 2020 (%)
      Table 47 Acquisitions and Mergers
      Table 48 Market Drivers – Impact Analysis
      Table 49 Market Restraints
      Table 50 Market Opportunities
      Table 51 Production Base and Market Concentration Rate of Raw Material
      Table 52 Key Suppliers of Raw Materials
      Table 53 Raw Materials Sources of E-Tourism Major Manufacturers
      Table 54 Major Buyers of E-Tourism
      Table 55 Distributors/Traders of E-Tourism by Region
      

Industry Major Market Players

  • Aban Offshore Ltd.
  • Crown Ltd.
  • Accor Group
  • Balkan Holidays Ltd.
  • Fred Harvey Company
  • G Adventures