Search Market Research Report

Discover Our Latest Reports
Discover Our Featured Reports
Discover Top Selling Reports

E-Paper Display Market Size, Share Global Analysis Report, 2021 – 2026

report img

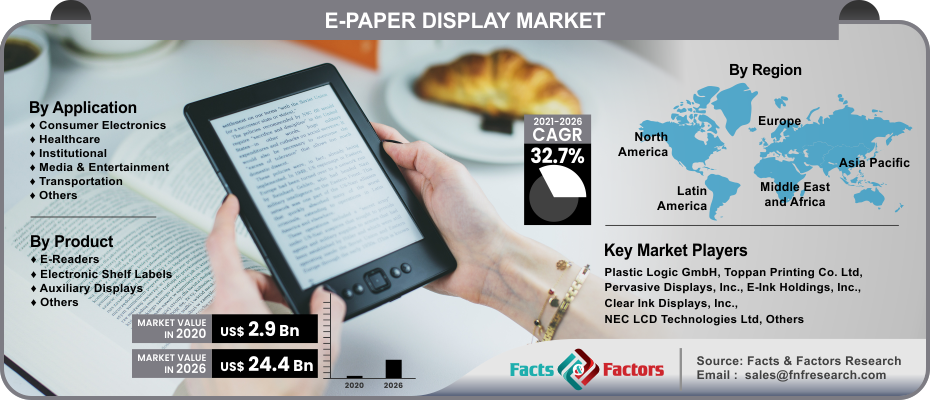
E-Paper Display Market By Application (Consumer Electronics, Healthcare, Institutional, Media & Entertainment, Transportation, & Others), By Product (E-Readers, Electronic Shelf Labels, Auxiliary Displays, & Others), And By Regions - Global & Regional Industry Perspective, Comprehensive Analysis, and Forecast 2021 – 2026

Industry Insights

[213+ Pages Report] We at Facts & Factors have recently published a report titled “Global E-Paper Display Market” that encompasses the spectacle of the market in an analytical and comprehensive manner. In the study, the global E-paper display market is projected to reach USD 24.4 Billion in the year 2026 from an initial value of USD 2.9 Billion in the year 2020 growing at a CAGR value of 32.7%.

logoMarket Overview

E-paper displays (EPD) are the integration of display with electronic reflective technology, which reflects the light in the same manner as a normal paper does. EPDs are also considered as a form of bi-stable displays that have the ability to absorb the content on the screen even after the latter is powered down. The current generation of EPDs can display static text and images for extended periods of time without any power. A plastic structure and electronics as often used as the display backplane.

logoIndustry Growth Factors

The global e-paper display market will be occupied by driving forces that can be attributed to the rising penetration of internet-based connectivity features coupled with rising environmental awareness to name a few. Additionally, increased consumption of electronic devices such as smartphones, tablets, and electronic wearables coupled with rising demand for on-the-move information absorption solutions will increase the footprint of the global e-paper display market for a larger consumer base. Moreover, rising technological advancements such as readability in indoor light and convenient composition coupled with lower power consumption will boost the growth of the global e-paper display market during the advent of the forecast period.

The global e-paper display market is driven by the rising number of electronic readers coupled with easy-to-use readers to name a few. Factors such as lightweight measures, battery-operated devices, and virtual countability of any structure will fuel the growth of the global e-paper display market during the advent of the forecast period. However, lack of awareness and limited availability will decrease the market value for the global e-paper display market to a certain extent.

E-Paper Display Market

To know more about this report | Request Free Sample Copy

logoSegmentation Analysis

The global e-paper display market is segmented into applications, products, and regions.

The global e-paper display market is divided into consumer electronics, healthcare, institutional, media & entertainment, transportation, and others on the basis of application. The consumer electronics segment is expected to witness the largest market share during the advent of the forecast period owing to a surge of e-readers, higher demand for on-the-move information, and easier ways for handling display-based devices to name a few. Based on product, the global e-paper display market is classified into e-readers, electronic shelf labels, auxiliary displays, and others. The electronic shelf labels category will witness the fastest growing CAGR during the advent of the forecast period owing to increased utilization in the retail sector coupled with wireless connectivity for updating shelving signage in a rapid and effective manner to name a few.

logo Report Scope

Report Attribute

Details

Market Size in 2020

USD 2.9 Billion

Projected Market Size in 2026

USD 24.4 Billion

CAGR Growth Rate

32.7% CAGR

Base Year

2020

Forecast Years

2021-2026

Key Market Players

Plastic Logic GmbH, Toppan Printing Co. Ltd, Pervasive Displays, Inc., E-Ink Holdings, Inc., Clear Ink Displays, Inc., NEC LCD Technologies Ltd., Delta Electronics, Inc., LG Display, Hanvon Technology Co. Ltd., Sony Corporation, Qualcomm MEMS Technologies, Inc., Inkcase, and Samsung, among others.

Key Segment

Applications, Products, and Region

Major Regions Covered

North America, Europe, Asia Pacific, Latin America, and Middle East & Africa

Purchase Options

Request customized purchase options to meet your research needs. Explore purchase options

logo Regional Analysis

North America is expected to witness the largest market share during the advent of the forecast period owing to higher penetration of tablets coupled with technological advancements to name a few. Additionally, a positive and cultural impact on the environment due to decreased energy consumption coupled with a rising applicational base will increase the footprint of the e-paper display market during the advent of the forecast period. Factors such as easy readability in bright sunlight coupled with increased integration into the smartwatch industry will further push the existing boundaries of the e-paper display market toward a larger horizon. Rising smartphone integrating EPDs coupled with early acceptance of the technology will fuel the growth of the e-paper display market during the advent of the forecast period.

logo Competitive Players

The key market participants for the global e-paper display market are:

  • Plastic Logic GmbH
  • Toppan Printing Co. Ltd
  • Pervasive Displays Inc.
  • E-Ink Holdings Inc.
  • Clear Ink Displays Inc.
  • NEC LCD Technologies Ltd.
  • Delta Electronics Inc.
  • LG Display
  • Hanvon Technology Co. Ltd.
  • Sony Corporation
  • Qualcomm MEMS Technologies Inc.
  • Inkcase
  • Samsung

logo By Application Segment Analysis

  • Consumer Electronics
  • Healthcare
  • Institutional
  • Media & Entertainment
  • Transportation
  • Others

logo By Product Segment Analysis

  • E-Readers
  • Electronic Shelf Labels
  • Auxiliary Displays
  • Others

logo By Regional Segment Analysis

  • North America
    • U.S.
    • Canada
  • Europe
    • UK
    • France
    • Germany
    • Italy
    • Spain
    • Rest of Europe
  • Asia Pacific
    • China
    • Japan
    • India
    • South Korea
    • Southeast Asia
    • Rest of Asia Pacific
  • Latin America
    • Brazil
    • Mexico
    • Rest of Latin America
  • Middle East and Africa
    • GCC Countries
    • South Africa
    • Rest of MEA

Table of Content

  1. Chapter 1 Executive Summary
    1. 1.1. Introduction of E-Paper Display
    2. 1.2. Global E-Paper Display Market, 2019 & 2026 (USD Billion)
    3. 1.3. Global E-Paper Display Market, 2016 – 2026 (USD Billion)
    4. 1.4. Global E-Paper Display Market Absolute Revenue Opportunity, 2016 – 2026 (USD Billion)
    5. 1.5. Global E-Paper Display Market Incremental Revenue Opportunity, 2020 – 2026 (USD Billion)
  2. Chapter 2 E-Paper Display Market – Application Analysis
    1. 2.1. Global E-Paper Display Market – Application Overview
    2. 2.2. Global E-Paper Display Market Share, by Application, 2019 & 2026 (USD Billion)
    3. 2.3. Consumer Electronics
      1. 2.3.1. Global Consumer Electronics E-Paper Display Market, 2016 – 2026 (USD Billion)
    4. 2.4. Healthcare
      1. 2.4.1. Global Healthcare E-Paper Display Market, 2016 – 2026 (USD Billion)
    5. 2.5. Institutional
      1. 2.5.1. Global Institutional E-Paper Display Market, 2016 – 2026 (USD Billion)
    6. 2.6. Media & Entertainment
      1. 2.6.1. Global Media & Entertainment E-Paper Display Market, 2016 – 2026 (USD Billion)
    7. 2.7. Transportation
      1. 2.7.1. Global Transportation E-Paper Display Market, 2016 – 2026 (USD Billion)
    8. 2.8. Others
      1. 2.8.1. Global Others E-Paper Display Market, 2016 – 2026 (USD Billion)
  3. Chapter 3 E-Paper Display Market – Product Analysis
    1. 3.1. Global E-Paper Display Market – Product Overview
    2. 3.2. Global E-Paper Display Market Share, by Product, 2019 & 2026 (USD Billion)
    3. 3.3. E-Readers
      1. 3.3.1. Global E-Readers E-Paper Display Market, 2016 – 2026 (USD Billion)
    4. 3.4. Electronic Shelf Labels
      1. 3.4.1. Global Electronic Shelf Labels E-Paper Display Market, 2016 – 2026 (USD Billion)
    5. 3.5. Auxiliary Displays
      1. 3.5.1. Global Auxiliary Displays E-Paper Display Market, 2016 – 2026 (USD Billion)
    6. 3.6. Others
      1. 3.6.1. Global Others E-Paper Display Market, 2016 – 2026 (USD Billion)
  4. Chapter 4 E-Paper Display Market – Regional Analysis
    1. 4.1. Global E-Paper Display Market Regional Overview
    2. 4.2. Global E-Paper Display Market Share, by Region, 2019 & 2026 (USD Billion)
    3. 4.3. North America
      1. 4.3.1. North America E-Paper Display Market, 2016 – 2026 (USD Billion)
        1. 4.3.1.1. North America E-Paper Display Market, by Country, 2016 - 2026 (USD Billion)
      2. 4.3.2. North America E-Paper Display Market, by Application, 2016 – 2026
        1. 4.3.2.1. North America E-Paper Display Market, by Application, 2016 – 2026 (USD Billion)
      3. 4.3.3. North America E-Paper Display Market, by Product, 2016 – 2026
        1. 4.3.3.1. North America E-Paper Display Market, by Product, 2016 – 2026 (USD Billion)
      4. 4.3.4. U.S.
        1. 4.3.4.1. U.S. E-Paper Display Market, 2016 – 2026 (USD Billion)
      5. 4.3.5. Canada
        1. 4.3.5.1. Canada E-Paper Display Market, 2016 – 2026 (USD Billion)
    4. 4.4. Europe
      1. 4.4.1. Europe E-Paper Display Market, 2016 – 2026 (USD Billion)
        1. 4.4.1.1. Europe E-Paper Display Market, by Country, 2016 - 2026 (USD Billion)
      2. 4.4.2. Europe E-Paper Display Market, by Application, 2016 – 2026
        1. 4.4.2.1. Europe E-Paper Display Market, by Application, 2016 – 2026 (USD Billion)
      3. 4.4.3. Europe E-Paper Display Market, by Product, 2016 – 2026
        1. 4.4.3.1. Europe E-Paper Display Market, by Product, 2016 – 2026 (USD Billion)
      4. 4.4.4. Germany
        1. 4.4.4.1. Germany E-Paper Display Market, 2016 – 2026 (USD Billion)
      5. 4.4.5. France
        1. 4.4.5.1. France E-Paper Display Market, 2016 – 2026 (USD Billion)
      6. 4.4.6. U.K.
        1. 4.4.6.1. U.K. E-Paper Display Market, 2016 – 2026 (USD Billion)
      7. 4.4.7. Italy
        1. 4.4.7.1. Italy E-Paper Display Market, 2016 – 2026 (USD Billion)
      8. 4.4.8. Spain
        1. 4.4.8.1. Spain E-Paper Display Market, 2016 – 2026 (USD Billion)
      9. 4.4.9. Rest of Europe
        1. 4.4.9.1. Rest of Europe E-Paper Display Market, 2016 – 2026 (USD Billion)
    5. 4.5. Asia Pacific
      1. 4.5.1. Asia Pacific E-Paper Display Market, 2016 – 2026 (USD Billion)
        1. 4.5.1.1. Asia Pacific E-Paper Display Market, by Country, 2016 - 2026 (USD Billion)
      2. 4.5.2. Asia Pacific E-Paper Display Market, by Application, 2016 – 2026
        1. 4.5.2.1. Asia Pacific E-Paper Display Market, by Application, 2016 – 2026 (USD Billion)
      3. 4.5.3. Asia Pacific E-Paper Display Market, by Product, 2016 – 2026
        1. 4.5.3.1. Asia Pacific E-Paper Display Market, by Product, 2016 – 2026 (USD Billion)
      4. 4.5.4. China
        1. 4.5.4.1. China E-Paper Display Market, 2016 – 2026 (USD Billion)
      5. 4.5.5. Japan
        1. 4.5.5.1. Japan E-Paper Display Market, 2016 – 2026 (USD Billion)
      6. 4.5.6. India
        1. 4.5.6.1. India E-Paper Display Market, 2016 – 2026 (USD Billion)
      7. 4.5.7. South Korea
        1. 4.5.7.1. South Korea E-Paper Display Market, 2016 – 2026 (USD Billion)
      8. 4.5.8. South-East Asia
        1. 4.5.8.1. South-East Asia E-Paper Display Market, 2016 – 2026 (USD Billion)
      9. 4.5.9. Rest of Asia Pacific
        1. 4.5.9.1. Rest of Asia Pacific E-Paper Display Market, 2016 – 2026 (USD Billion)
    6. 4.6. Latin America
      1. 4.6.1. Latin America E-Paper Display Market, 2016 – 2026 (USD Billion)
        1. 4.6.1.1. Latin America E-Paper Display Market, by Country, 2016 - 2026 (USD Billion)
      2. 4.6.2. Latin America E-Paper Display Market, by Application, 2016 – 2026
        1. 4.6.2.1. Latin America E-Paper Display Market, by Application, 2016 – 2026 (USD Billion)
      3. 4.6.3. Latin America E-Paper Display Market, by Product, 2016 – 2026
        1. 4.6.3.1. Latin America E-Paper Display Market, by Product, 2016 – 2026 (USD Billion)
      4. 4.6.4. Brazil
        1. 4.6.4.1. Brazil E-Paper Display Market, 2016 – 2026 (USD Billion)
      5. 4.6.5. Mexico
        1. 4.6.5.1. Mexico E-Paper Display Market, 2016 – 2026 (USD Billion)
      6. 4.6.6. Rest of Latin America
        1. 4.6.6.1. Rest of Latin America E-Paper Display Market, 2016 – 2026 (USD Billion)
    7. 4.7. The Middle-East and Africa
      1. 4.7.1. The Middle-East and Africa E-Paper Display Market, 2016 – 2026 (USD Billion)
        1. 4.7.1.1. The Middle-East and Africa E-Paper Display Market, by Country, 2016 - 2026 (USD Billion)
      2. 4.7.2. The Middle-East and Africa E-Paper Display Market, by Application, 2016 – 2026
        1. 4.7.2.1. The Middle-East and Africa E-Paper Display Market, by Application, 2016 – 2026 (USD Billion)
      3. 4.7.3. The Middle-East and Africa E-Paper Display Market, by Product, 2016 – 2026
        1. 4.7.3.1. The Middle-East and Africa E-Paper Display Market, by Product, 2016 – 2026 (USD Billion)
      4. 4.7.4. GCC Countries
        1. 4.7.4.1. GCC Countries E-Paper Display Market, 2016 – 2026 (USD Billion)
      5. 4.7.5. South Africa
        1. 4.7.5.1. South Africa E-Paper Display Market, 2016 – 2026 (USD Billion)
      6. 4.7.6. Rest of Middle-East Africa
        1. 4.7.6.1. Rest of Middle-East Africa E-Paper Display Market, 2016 – 2026 (USD Billion)
  5. Chapter 5 E-Paper Display Market – Competitive Landscape
    1. 5.1. Competitor Market Share – Revenue
    2. 5.2. Market Concentration Rate Analysis, Top 3 and Top 5 Players
    3. 5.3. Strategic Developments
      1. 5.3.1. Acquisitions and Mergers
      2. 5.3.2. New Products
      3. 5.3.3. Research & Development Activities
  6. Chapter 6 Company Profiles
    1. 6.1. Plastic Logic GmbH
      1. 6.1.1. Company Overview
      2. 6.1.2. Product/Service Portfolio
      3. 6.1.3. Plastic Logic GmbH Sales, Revenue, and Gross Margin
      4. 6.1.4. Plastic Logic GmbH Revenue and Growth Rate
      5. 6.1.5. Plastic Logic GmbH Market Share
      6. 6.1.6. Recent Initiatives, Funding/VC Activities, and Technological Innovations
    2. 6.2. Toppan Printing Co. Ltd
      1. 6.2.1. Company Overview
      2. 6.2.2. Product/Service Portfolio
      3. 6.2.3. Toppan Printing Co. Ltd Sales, Revenue, and Gross Margin
      4. 6.2.4. Toppan Printing Co. Ltd Revenue and Growth Rate
      5. 6.2.5. Toppan Printing Co. Ltd Market Share
      6. 6.2.6. Recent Initiatives, Funding/VC Activities, and Technological Innovations
    3. 6.3. Pervasive Displays Inc
      1. 6.3.1. Company Overview
      2. 6.3.2. Product/Service Portfolio
      3. 6.3.3. Pervasive Displays Inc Sales, Revenue, and Gross Margin
      4. 6.3.4. Pervasive Displays Inc Revenue and Growth Rate
      5. 6.3.5. Pervasive Displays Inc Market Share
      6. 6.3.6. Recent Initiatives, Funding/VC Activities, and Technological Innovations
    4. 6.4. E-Ink Holdings Inc
      1. 6.4.1. Company Overview
      2. 6.4.2. Product/Service Portfolio
      3. 6.4.3. E-Ink Holdings Inc Sales, Revenue, and Gross Margin
      4. 6.4.4. E-Ink Holdings Inc Revenue and Growth Rate
      5. 6.4.5. E-Ink Holdings Inc Market Share
      6. 6.4.6. Recent Initiatives, Funding/VC Activities, and Technological Innovations
    5. 6.5. Clear Ink Displays Inc
      1. 6.5.1. Company Overview
      2. 6.5.2. Product/Service Portfolio
      3. 6.5.3. Clear Ink Displays Inc Sales, Revenue, and Gross Margin
      4. 6.5.4. Clear Ink Displays Inc Revenue and Growth Rate
      5. 6.5.5. Clear Ink Displays Inc Market Share
      6. 6.5.6. Recent Initiatives, Funding/VC Activities, and Technological Innovations
    6. 6.6. NEC LCD Technologies Ltd
      1. 6.6.1. Company Overview
      2. 6.6.2. Product/Service Portfolio
      3. 6.6.3. NEC LCD Technologies Ltd Sales, Revenue, and Gross Margin
      4. 6.6.4. NEC LCD Technologies Ltd Revenue and Growth Rate
      5. 6.6.5. NEC LCD Technologies Ltd Market Share
      6. 6.6.6. Recent Initiatives, Funding/VC Activities, and Technological Innovations
    7. 6.7. Delta Electronics Inc
      1. 6.7.1. Company Overview
      2. 6.7.2. Product/Service Portfolio
      3. 6.7.3. Delta Electronics Inc Sales, Revenue, and Gross Margin
      4. 6.7.4. Delta Electronics Inc Revenue and Growth Rate
      5. 6.7.5. Delta Electronics Inc Market Share
      6. 6.7.6. Recent Initiatives, Funding/VC Activities, and Technological Innovations
    8. 6.8. LG Display
      1. 6.8.1. Company Overview
      2. 6.8.2. Product/Service Portfolio
      3. 6.8.3. LG Display Sales, Revenue, and Gross Margin
      4. 6.8.4. LG Display Revenue and Growth Rate
      5. 6.8.5. LG Display Market Share
      6. 6.8.6. Recent Initiatives, Funding/VC Activities, and Technological Innovations
    9. 6.9. Hanvon Technology Co. Ltd
      1. 6.9.1. Company Overview
      2. 6.9.2. Product/Service Portfolio
      3. 6.9.3. Hanvon Technology Co. Ltd Sales, Revenue, and Gross Margin
      4. 6.9.4. Hanvon Technology Co. Ltd Revenue and Growth Rate
      5. 6.9.5. Hanvon Technology Co. Ltd Market Share
      6. 6.9.6. Recent Initiatives, Funding/VC Activities, and Technological Innovations
    10. 6.10. Sony Corporation
      1. 6.10.1. Company Overview
      2. 6.10.2. Product/Service Portfolio
      3. 6.10.3. Sony Corporation Sales, Revenue, and Gross Margin
      4. 6.10.4. Sony Corporation Revenue and Growth Rate
      5. 6.10.5. Sony Corporation Market Share
      6. 6.10.6. Recent Initiatives, Funding/VC Activities, and Technological Innovations
    11. 6.11. Qualcomm MEMS Technologies Inc
      1. 6.11.1. Company Overview
      2. 6.11.2. Product/Service Portfolio
      3. 6.11.3. Qualcomm MEMS Technologies Inc Sales, Revenue, and Gross Margin
      4. 6.11.4. Qualcomm MEMS Technologies Inc Revenue and Growth Rate
      5. 6.11.5. Qualcomm MEMS Technologies Inc Market Share
      6. 6.11.6. Recent Initiatives, Funding/VC Activities, and Technological Innovations
    12. 6.12. Inkcase
      1. 6.12.1. Company Overview
      2. 6.12.2. Product/Service Portfolio
      3. 6.12.3. Inkcase Sales, Revenue, and Gross Margin
      4. 6.12.4. Inkcase Revenue and Growth Rate
      5. 6.12.5. Inkcase Market Share
      6. 6.12.6. Recent Initiatives, Funding/VC Activities, and Technological Innovations
    13. 6.13. Samsung
      1. 6.13.1. Company Overview
      2. 6.13.2. Product/Service Portfolio
      3. 6.13.3. Samsung Sales, Revenue, and Gross Margin
      4. 6.13.4. Samsung Revenue and Growth Rate
      5. 6.13.5. Samsung Market Share
      6. 6.13.6. Recent Initiatives, Funding/VC Activities, and Technological Innovations
  7. Chapter 7 E-Paper Display — Industry Analysis
    1. 7.1. Introduction and Taxonomy
    2. 7.2. E-Paper Display Market – Key Trends
      1. 7.2.1. Market Drivers
      2. 7.2.2. Market Restraints
      3. 7.2.3. Market Opportunities
    3. 7.3. Value Chain Analysis
    4. 7.4. Key Mandates and Regulations
    5. 7.5. Technology Roadmap and Timeline
    6. 7.6. E-Paper Display Market – Attractiveness Analysis
      1. 7.6.1. By Application
      2. 7.6.2. By Product
      3. 7.6.3. By Region
  8. Chapter 8 Industrial Chain, Sourcing Strategy, and Downstream Buyers
    1. 8.1. E-Paper Display Industrial Chain Analysis
    2. 8.2. Downstream Buyers
    3. 8.3. Distributors/Traders List
  9. Chapter 9 Marketing Strategy Analysis
    1. 9.1. Marketing Channel
    2. 9.2. Direct Marketing
    3. 9.3. Indirect Marketing
    4. 9.4. Marketing Channel Development Trends
    5. 9.5. Economic/Political Environmental Change
  10. Chapter 10 Report Conclusion & Key Insights
    1. 10.1. Key Insights from Primary Interviews & Surveys Respondents
    2. 10.2. Key Takeaways from Analysts, Consultants, and Industry Leaders
  11. Chapter 11 Research Approach & Methodology
    1. 11.1. Report Description
    2. 11.2. Research Scope
    3. 11.3. Research Methodology
      1. 11.3.1. Secondary Research
      2. 11.3.2. Primary Research
      3. 11.3.3. Statistical Models
        1. 11.3.3.1. Company Share Analysis Model
        2. 11.3.3.2. Revenue Based Modeling
      4. 11.3.4. Research Limitations

      List of Figures

      Fig.1	Product Picture of E-Paper Display
      Fig.2	Global E-Paper Display Market, 2016 – 2026 (USD Billion)
      Fig.3	Global E-Paper Display Market Absolute Revenue Opportunity, 2016 – 2026 (USD Billion)
      Fig.4	Global E-Paper Display Market Incremental Revenue Opportunity, 2020 – 2026 (USD Billion)
      Fig.5	Global E-Paper Display Market Share, by Application, 2019 & 2026 (USD Billion)
      Fig.6	Global Consumer Electronics  E-Paper Display Market, 2016 – 2026 (USD Billion)
      Fig.7	Global Healthcare E-Paper Display Market, 2016 – 2026 (USD Billion)
      Fig.8	Global Institutional E-Paper Display Market, 2016 – 2026 (USD Billion)
      Fig.9	Global Media & Entertainment E-Paper Display Market, 2016 – 2026 (USD Billion)
      Fig.10	Global Transportation  E-Paper Display Market, 2016 – 2026 (USD Billion)
      Fig.11	Global Others E-Paper Display Market, 2016 – 2026 (USD Billion)
      Fig.12	Global E-Paper Display Market Share, by Product, 2019 & 2026 (USD Billion)
      Fig.13	Global E-Readers  E-Paper Display Market, 2016 – 2026 (USD Billion)
      Fig.14	Global Electronic Shelf Labels E-Paper Display Market, 2016 – 2026 (USD Billion)
      Fig.15	Global Auxiliary Displays  E-Paper Display Market, 2016 – 2026 (USD Billion)
      Fig.16	Global Others E-Paper Display Market, 2016 – 2026 (USD Billion)
      Fig.17	Global E-Paper Display Market Share, by Region, 2019 & 2026 (USD Billion)
      Fig.18	North America E-Paper Display Market, 2016 – 2026 (USD Billion)
      Fig.19	U.S. E-Paper Display Market, 2016 – 2026 (USD Billion)
      Fig.20	Canada E-Paper Display Market, 2016 – 2026 (USD Billion)
      Fig.21	Europe E-Paper Display Market, 2016 – 2026 (USD Billion)
      Fig.22	Germany E-Paper Display Market, 2016 – 2026 (USD Billion)
      Fig.23	France E-Paper Display Market, 2016 – 2026 (USD Billion)
      Fig.24	U.K. E-Paper Display Market, 2016 – 2026 (USD Billion)
      Fig.25	Italy E-Paper Display Market, 2016 – 2026 (USD Billion)
      Fig.26	Spain E-Paper Display Market, 2016 – 2026 (USD Billion)
      Fig.27	Rest of Europe E-Paper Display Market, 2016 – 2026 (USD Billion)
      Fig.28	Asia Pacific E-Paper Display Market, 2016 – 2026 (USD Billion)
      Fig.29	China E-Paper Display Market, 2016 – 2026 (USD Billion)
      Fig.30	Japan E-Paper Display Market, 2016 – 2026 (USD Billion)
      Fig.31	India E-Paper Display Market, 2016 – 2026 (USD Billion)
      Fig.32	South  Korea E-Paper Display Market, 2016 – 2026 (USD Billion)
      Fig.33	South-East Asia E-Paper Display Market, 2016 – 2026 (USD Billion)
      Fig.34	Rest of Asia Pacific E-Paper Display Market, 2016 – 2026 (USD Billion)
      Fig.35	Latin America E-Paper Display Market, 2016 – 2026 (USD Billion)
      Fig.36	Brazil E-Paper Display Market, 2016 – 2026 (USD Billion)
      Fig.37	Mexico E-Paper Display Market, 2016 – 2026 (USD Billion)
      Fig.38	Rest of Latin America E-Paper Display Market, 2016 – 2026 (USD Billion)
      Fig.39	The Middle-East and Africa E-Paper Display Market, 2016 – 2026 (USD Billion)
      Fig.40	GCC Countries E-Paper Display Market, 2016 – 2026 (USD Billion)
      Fig.41	South Africa E-Paper Display Market, 2016 – 2026 (USD Billion)
      Fig.42	Rest of Middle-East Africa E-Paper Display Market, 2016 – 2026 (USD Billion)
      Fig.43	Competitor Market Share – Revenue
      Fig.44	Plastic Logic GmbH Revenue and Growth Rate
      Fig.45	Plastic Logic GmbH Market Share
      Fig.46	Toppan Printing Co. Ltd Revenue and Growth Rate
      Fig.47	Toppan Printing Co. Ltd Market Share
      Fig.48	Pervasive Displays Inc Revenue and Growth Rate
      Fig.49	Pervasive Displays Inc Market Share
      Fig.50	E-Ink Holdings Inc Revenue and Growth Rate
      Fig.51	E-Ink Holdings Inc Market Share
      Fig.52	Clear Ink Displays Inc Revenue and Growth Rate
      Fig.53	Clear Ink Displays Inc Market Share
      Fig.54	NEC LCD Technologies Ltd Revenue and Growth Rate
      Fig.55	NEC LCD Technologies Ltd Market Share
      Fig.56	Delta Electronics Inc Revenue and Growth Rate
      Fig.57	Delta Electronics Inc Market Share
      Fig.58	LG Display Revenue and Growth Rate
      Fig.59	LG Display Market Share
      Fig.60	Hanvon Technology Co. Ltd Revenue and Growth Rate
      Fig.61	Hanvon Technology Co. Ltd Market Share
      Fig.62	Sony Corporation Revenue and Growth Rate
      Fig.63	Sony Corporation Market Share
      Fig.64	Qualcomm MEMS Technologies Inc Revenue and Growth Rate
      Fig.65	Qualcomm MEMS Technologies Inc Market Share
      Fig.66	Inkcase Revenue and Growth Rate
      Fig.67	Inkcase Market Share
      Fig.68	Samsung Revenue and Growth Rate
      Fig.69	Samsung Market Share
      Fig.70	Market Dynamics
      Fig.71	Global E-Paper Display – Value Chain Analysis
      Fig.72	Key Mandates and Regulations
      Fig.73	Technology Roadmap and Timeline
      Fig.74	Market Attractiveness Analysis – By Application
      Fig.75	Market Attractiveness Analysis – By Product
      Fig.76	Market Attractiveness Analysis – By Region
      Fig.77	E-Paper Display Industrial Chain Analysis
      Fig.78	Market Channels
      Fig.79	Marketing Channel Development Trend
      Fig.80	Growth in World Gross Product, 2008-2018
      

      List of Tables

      Table 1	Global E-Paper Display Market, 2019 & 2026 (USD Billion)
      Table 2	Global E-Paper Display Market, by Application, 2016 – 2026 (USD Billion)
      Table 3	Global E-Paper Display Market, by Product, 2016 – 2026 (USD Billion)
      Table 4	Global E-Paper Display Market, by Region, 2016 – 2026 (USD Billion)
      Table 5	North America E-Paper Display Market, by Country, 2016 – 2026 (USD Billion)
      Table 6	North America E-Paper Display Market, by Application, 2016 – 2026 (USD Billion)
      Table 7	North America E-Paper Display Market, by Product, 2016 – 2026 (USD Billion)
      Table 8	Europe E-Paper Display Market, by Country, 2016 – 2026 (USD Billion)
      Table 9	Europe E-Paper Display Market, by Application, 2016 – 2026 (USD Billion)
      Table 10 Europe E-Paper Display Market, by Product, 2016 – 2026 (USD Billion)
      Table 11 Asia Pacific E-Paper Display Market, by Country, 2016 – 2026 (USD Billion)
      Table 12 Asia Pacific E-Paper Display Market, by Application, 2016 – 2026 (USD Billion)
      Table 13 Asia Pacific E-Paper Display Market, by Product, 2016 – 2026 (USD Billion)
      Table 14 Latin America E-Paper Display Market, by Country, 2016 – 2026 (USD Billion)
      Table 15 Latin America E-Paper Display Market, by Application, 2016 – 2026 (USD Billion)
      Table 16 Latin America E-Paper Display Market, by Product, 2016 – 2026 (USD Billion)
      Table 17 The Middle-East and Africa E-Paper Display Market, by Country, 2016 – 2026 (USD Billion)
      Table 18 The Middle-East and Africa E-Paper Display Market, by Application, 2016 – 2026 (USD Billion)
      Table 19 The Middle-East and Africa E-Paper Display Market, by Product, 2016 – 2026 (USD Billion)
      Table 20 Global E-Paper Display Market - Company Revenue Analysis, 2016 – 2019 (USD Billion)
      Table 21 Global E-Paper Display Market - Company Revenue Share Analysis, 2016 – 2019 (%)
      Table 22 Acquisitions and Mergers
      Table 23 Market Drivers – Impact Analysis
      Table 24 Market Restraints
      Table 25 Market Opportunities
      Table 26 Major Buyers of E-Paper Display
      Table 27 Distributors/Traders of E-Paper Display by Region
      

Industry Major Market Players

  • Plastic Logic GmbH
  • Toppan Printing Co. Ltd
  • Pervasive Displays Inc.
  • E-Ink Holdings Inc.
  • Clear Ink Displays Inc.
  • NEC LCD Technologies Ltd.
  • Delta Electronics Inc.
  • LG Display
  • Hanvon Technology Co. Ltd.
  • Sony Corporation
  • Qualcomm MEMS Technologies Inc.
  • Inkcase
  • Samsung