Search Market Research Report

Discover Our Latest Reports
Discover Our Featured Reports
Discover Top Selling Reports

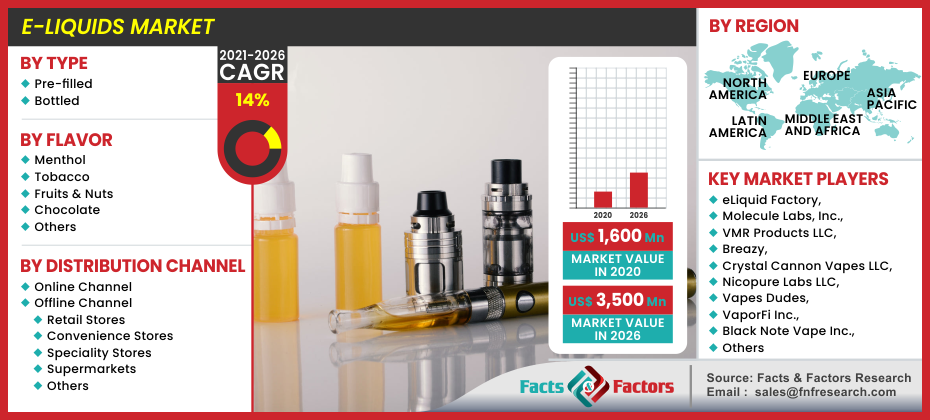
E-Liquids Market Size, Share Global Analysis Report, , 2021 – 2026

report img

E-Liquids Market By Type (Pre-filled & Bottled), By Flavor (Menthol, Tobacco, Fruits & Nuts, Chocolate, and Others), By Distribution Channel (Online Channel & Offline Channel), and By Regions: Global Industry Perspective, Comprehensive Analysis, and Forecast, 2021 – 2026

Industry Insights

[167+ Pages Report] As per the latest research and survey report issued by Facts and Factors, the global E-Liquids market was valued at around USD 1,600 Million in 2020 and is expected to register revenues worth USD 3,500 Million by the end of 2026, growing at an exceptional CAGR of approximately 14% between 2021 and 2026.

logoMarket Overview

E-Liquid are products that are a combination of vegetable glycerine, water mixed with natural or artificial flavoring, nicotine, and propylene glycol. Their functionality is dually based, but the most common application is aimed at filling e-cigarettes and personalized vaping devices. Furthermore, the aim to mimic the effect of traditional smoke derived from cigarettes. E-liquids, however, do not emulate smoke on their own and hence are recommended for users who suffer from the habits of passive smoking. Moreover, they reduce the risks associated with lung disorders occurred from the constant usage of traditional cigarettes.

logoIndustry Growth Factors

Alternatives to traditional smoking practices, availability of a range of flavor-based solutions such as menthol, tobacco, chocolate, and other assortments of fruit and nut-based derivatives, and the general lower toxic effect on the human body have further pushed the market for e-liquid to a greater extent over the forecast period. Furthermore, the marginal cost difference over tobacco-based products with variable price differences increases the popularity of e-liquid as a viable alternative product, thereby driving the footprint of the market. As the technology behind the science, a generalized popularity trail is expected to follow the e-cigarette corpus.

E-Liquids Market

To know more about this report | Request Free Sample Copy

Additionally, general aesthetics such as unique design choices, color customization options, the smartphone enables accessories, metallic carry cases, and sterling necklaces are some of the products available from a huge line of attachments and products. With the advent of cotton candy, bubble gum, candy cane, coffee, and chocolate being added to the mix, a swift transition from traditional smoking measures to the latter is expected. However, a crossover in legality of the harm caused by e-liquids with several government bodies across the world as well as constant policy changes with regards to packaging and marketing can cause hindrance to the growth to a certain degree.

logoSegmentation Analysis

The global e-liquid market can be segmented on the basis of type, flavors, distribution channels, and regions.

On the basis of type, the e-liquid category can be segmented into bottled and pre-filled consumables. The bottled segment is expected to account for the largest market share in the category owing to greater usability and functionality. Furthermore, bottled consumables allow for the user to be stored at a secure place till further intended. On the basis of flavor, the e-liquid category can be categorized into menthol, tobacco, fruits & nuts, chocolate, and others. On the basis of distribution channels, the e-liquid market can be broken down into online and offline channels. The offline channels can be further disintegrated into sub-categories such as retail stores, convenience stores, specialty stores, supermarkets, and others. The offline subsegment held the largest market value in terms of revenue generation over the years. However, with the rise of internet popularity and various sprouts of online vendors, the online category is expected to grow at an exceptionally high CAGR, expecting to surpass the former within the forecast period.

logoReport Scope

Report Attribute

Details

Market Size in 2020

USD 1,600 Million

Projected Market Size in 2026

USD 3,500 Million

CAGR Growth Rate

14% CAGR

Base Year

2020

Forecast Years

2021-2026

Key Market Players

eLiquid Factory, Molecule Labs, Inc., VMR Products LLC, Breazy, Crystal Cannon Vapes LLC, Nicopure Labs LLC, Vapes Dudes, VaporFi Inc., Black Note Vape Inc., Fontem Ventures, and Mig Vapor LLC, among others.

Key Segment

By Type, Flavor, Distribution, and Region

Major Regions Covered

North America, Europe, Asia Pacific, Latin America, and the Middle East & Africa

Purchase Options

Request customized purchase options to meet your research needs.Explore purchase options

logo Regional Analysis

The region of North America is expected to occupy the largest market share in terms of revenue generated. The key vendors in the e-liquid sector are all set in the region which makes the consumer base a highly preferred one. Furthermore, the manufacturers have begun expanding their product range through a series of mergers and acquisitions. The increasing popularity of the vape device has further increased the foothold of the E-liquids market in the region.

Asia-Pacific will mark the highest growing CAGR in the sector during the estimated forecast period. Several reasons associated with the increase of e-liquids can be attributed to the growing number of lungs related diseases in the region due to excessive consumption of traditional tobacco-based consumables. Additionally, the region follows a conceptualized outlook that e-cigarettes and e-liquids are less harmful than traditional cigarettes, which is likely to further increase the uptake of the market swing in the region.

logo Competitive Players

The main participants in the global e-liquids market are :

  • eLiquid Factory
  • Molecule Labs Inc.
  • VMR Products LLC
  • Breazy
  • Crystal Cannon Vapes LLC
  • Nicopure Labs LLC
  • Vapes Dudes
  • VaporFi Inc.
  • Black Note Vape Inc.
  • Fontem Ventures
  • Mig Vapor LLC

logo By Type Segment Analysis

  • Pre-filled
  • Bottled

logo By Flavor Analysis               

  • Menthol
  • Tobacco
  • Fruits & Nuts
  • Chocolate
  • Others

logo By Distribution Channel Segment Analysis

  • Online Channel
  • Offline Channel
    • Retail Stores
    • Convenience Stores
    • Speciality Stores
    • Supermarkets
    • Others

logo By Regional Segment Analysis

  • North America
  • U.S.
  • Canada
  • Europe
  • UK
  • France
  • Germany
  • Italy
  • Spain
  • Rest of Europe
  • Asia Pacific
  • China
  • Japan
  • India
  • South Korea
  • Southeast Asia
  • Rest of Asia Pacific
  • Latin America
  • Brazil
  • Mexico
  • Rest of Latin America
  • Middle East and Africa
  • GCC Countries
  • South Africa
  • Rest of MEA

Table of Content

  1. Chapter 1 Executive Summary
    1. 1.1. Introduction of E-Liquids
    2. 1.2. Global E-Liquids Market, 2020 & 2026 (USD Million)
    3. 1.3. Global E-Liquids Market, 2016 – 2026 (USD Million) (Liter)
    4. 1.4. Global E-Liquids Market Absolute Revenue Opportunity, 2016 – 2026 (USD Million)
    5. 1.5. Global E-Liquids Market Incremental Revenue Opportunity, 2021-2026 (USD Million)
  2. Chapter 2 E-Liquids Market – Type Analysis
    1. 2.1. Global E-Liquids Market – Type Overview
    2. 2.2. Global E-Liquids Market Share, by Type, 2020 & 2026 (USD Million)
    3. 2.3. Global E-Liquids Market share, by Type, 2020 & 2026 (Liter)
    4. 2.4. Pre-filled
      1. 2.4.1. Global Pre-filled E-Liquids Market, 2016 – 2026 (USD Million)
      2. 2.4.2. Global Pre-filled E-Liquids Market, 2016 – 2026 (Liter)
    5. 2.5. Bottled
      1. 2.5.1. Global Bottled E-Liquids Market, 2016 – 2026 (USD Million)
      2. 2.5.2. Global Bottled E-Liquids Market, 2016 – 2026 (Liter)
  3. Chapter 3 E-Liquids Market – Flavour Analysis
    1. 3.1. Global E-Liquids Market – Flavour Overview
    2. 3.2. Global E-Liquids Market Share, by Flavour, 2020 & 2026 (USD Million)
    3. 3.3. Global E-Liquids Market share, by Flavour, 2020 & 2026 (Liter)
    4. 3.4. Menthol
      1. 3.4.1. Global Menthol E-Liquids Market, 2016 – 2026 (USD Million)
      2. 3.4.2. Global Menthol E-Liquids Market, 2016 – 2026 (Liter)
    5. 3.5. Tobacco
      1. 3.5.1. Global Tobacco E-Liquids Market, 2016 – 2026 (USD Million)
      2. 3.5.2. Global Tobacco E-Liquids Market, 2016 – 2026 (Liter)
    6. 3.6. Fruits & Nuts
      1. 3.6.1. Global Fruits & Nuts E-Liquids Market, 2016 – 2026 (USD Million)
      2. 3.6.2. Global Fruits & Nuts E-Liquids Market, 2016 – 2026 (Liter)
    7. 3.7. Chocolate
      1. 3.7.1. Global Chocolate E-Liquids Market, 2016 – 2026 (USD Million)
      2. 3.7.2. Global Chocolate E-Liquids Market, 2016 – 2026 (Liter)
    8. 3.8. Others
      1. 3.8.1. Global Others E-Liquids Market, 2016 – 2026 (USD Million)
      2. 3.8.2. Global Others E-Liquids Market, 2016 – 2026 (Liter)
  4. Chapter 4 E-Liquids Market – Distribution Channel Analysis
    1. 4.1. Global E-Liquids Market – Distribution Channel Overview
    2. 4.2. Global E-Liquids Market Share, by Distribution Channel, 2020 & 2026 (USD Million)
    3. 4.3. Global E-Liquids Market share, by Distribution Channel, 2020 & 2026 (Liter)
    4. 4.4. Online Channels
      1. 4.4.1. Global Online Channels E-Liquids Market, 2016 – 2026 (USD Million)
      2. 4.4.2. Global Online Channels E-Liquids Market, 2016 – 2026 (Liter)
    5. 4.5. Offline Channels
      1. 4.5.1. Global Offline Channels E-Liquids Market, 2016 – 2026 (USD Million)
      2. 4.5.2. Global Offline Channels E-Liquids Market, 2016 – 2026 (Liter)
  5. Chapter 5 E-Liquids Market – Offline Channels Analysis
    1. 5.1. Global E-Liquids Market – Offline Channels Overview
    2. 5.2. Global E-Liquids Market Share, by Offline Channels, 2020 & 2026 (USD Million)
    3. 5.3. Global E-Liquids Market share, by Offline Channels, 2020 & 2026 (Liter)
    4. 5.4. Retail Stores
      1. 5.4.1. Global Retail Stores E-Liquids Market, 2016 – 2026 (USD Million)
      2. 5.4.2. Global Retail Stores E-Liquids Market, 2016 – 2026 (Liter)
    5. 5.5. Convenience Stores
      1. 5.5.1. Global Convenience Stores E-Liquids Market, 2016 – 2026 (USD Million)
      2. 5.5.2. Global Convenience Stores E-Liquids Market, 2016 – 2026 (Liter)
    6. 5.6. Speciality Stores
      1. 5.6.1. Global Speciality Stores E-Liquids Market, 2016 – 2026 (USD Million)
      2. 5.6.2. Global Speciality Stores E-Liquids Market, 2016 – 2026 (Liter)
    7. 5.7. Supermarkets
      1. 5.7.1. Global Supermarkets E-Liquids Market, 2016 – 2026 (USD Million)
      2. 5.7.2. Global Supermarkets E-Liquids Market, 2016 – 2026 (Liter)
    8. 5.8. Others
      1. 5.8.1. Global Others E-Liquids Market, 2016 – 2026 (USD Million)
      2. 5.8.2. Global Others E-Liquids Market, 2016 – 2026 (Liter)
  6. Chapter 6 E-Liquids Market – Regional Analysis
    1. 6.1. Global E-Liquids Market Regional Overview
    2. 6.2. Global E-Liquids Market Share, by Region, 2020 & 2026 (USD Million)
    3. 6.3. Global E-Liquids Market Share, by Region, 2020 & 2026 (Liter)
    4. 6.4. North America
      1. 6.4.1. North America E-Liquids Market, 2016 – 2026 (USD Million)
        1. 6.4.1.1. North America E-Liquids Market, by Country, 2016 – 2026 (USD Million)
      2. 6.4.2. North America Market, 2016 – 2026 (Liter)
        1. 6.4.2.1. North America E-Liquids Market, by Country, 2016 – 2026 (Liter)
      3. 6.4.3. North America E-Liquids Market, by Type, 2016 – 2026
        1. 6.4.3.1. North America E-Liquids Market, by Type, 2016 – 2026 (USD Million)
        2. 6.4.3.2. North America E-Liquids Market, by Type, 2016 – 2026 (Liter)
      4. 6.4.4. North America E-Liquids Market, by Flavour, 2016 – 2026
        1. 6.4.4.1. North America E-Liquids Market, by Flavour, 2016 – 2026 (USD Million)
        2. 6.4.4.2. North America E-Liquids Market, by Flavour, 2016 – 2026 (Liter)
      5. 6.4.5. North America E-Liquids Market, by Distribution Channel, 2016 – 2026
        1. 6.4.5.1. North America E-Liquids Market, by Distribution Channel, 2016 – 2026 (USD Million)
        2. 6.4.5.2. North America E-Liquids Market, by Distribution Channel, 2016 – 2026 (Liter)
      6. 6.4.6. North America E-Liquids Market, by Offline Channels, 2016 – 2026
        1. 6.4.6.1. North America E-Liquids Market, by Offline Channels, 2016 – 2026 (USD Million)
        2. 6.4.6.2. North America E-Liquids Market, by Offline Channels, 2016 – 2026 (Liter)
      7. 6.4.7. U.S.
        1. 6.4.7.1. U.S. E-Liquids Market, 2016 – 2026 (USD Million)
        2. 6.4.7.2. U.S. E-Liquids Market, 2016 – 2026 (Liter)
      8. 6.4.8. Canada
        1. 6.4.8.1. Canada E-Liquids Market, 2016 – 2026 (USD Million)
        2. 6.4.8.2. Canada E-Liquids Market, 2016 – 2026 (Liter)
    5. 6.5. Europe
      1. 6.5.1. Europe E-Liquids Market, 2016 – 2026 (USD Million)
        1. 6.5.1.1. Europe E-Liquids Market, by Country, 2016 – 2026 (USD Million)
      2. 6.5.2. Europe Market, 2016 – 2026 (Liter)
        1. 6.5.2.1. Europe E-Liquids Market, by Country, 2016 – 2026 (Liter)
      3. 6.5.3. Europe E-Liquids Market, by Type, 2016 – 2026
        1. 6.5.3.1. Europe E-Liquids Market, by Type, 2016 – 2026 (USD Million)
        2. 6.5.3.2. Europe E-Liquids Market, by Type, 2016 – 2026 (Liter)
      4. 6.5.4. Europe E-Liquids Market, by Flavour, 2016 – 2026
        1. 6.5.4.1. Europe E-Liquids Market, by Flavour, 2016 – 2026 (USD Million)
        2. 6.5.4.2. Europe E-Liquids Market, by Flavour, 2016 – 2026 (Liter)
      5. 6.5.5. Europe E-Liquids Market, by Distribution Channel, 2016 – 2026
        1. 6.5.5.1. Europe E-Liquids Market, by Distribution Channel, 2016 – 2026 (USD Million)
        2. 6.5.5.2. Europe E-Liquids Market, by Distribution Channel, 2016 – 2026 (Liter)
      6. 6.5.6. Europe E-Liquids Market, by Offline Channels, 2016 – 2026
        1. 6.5.6.1. Europe E-Liquids Market, by Offline Channels, 2016 – 2026 (USD Million)
        2. 6.5.6.2. Europe E-Liquids Market, by Offline Channels, 2016 – 2026 (Liter)
      7. 6.5.7. Germany
        1. 6.5.7.1. Germany E-Liquids Market, 2016 – 2026 (USD Million)
        2. 6.5.7.2. Germany E-Liquids Market, 2016 – 2026 (Liter)
      8. 6.5.8. France
        1. 6.5.8.1. France E-Liquids Market, 2016 – 2026 (USD Million)
        2. 6.5.8.2. France E-Liquids Market, 2016 – 2026 (Liter)
      9. 6.5.9. U.K.
        1. 6.5.9.1. U.K. E-Liquids Market, 2016 – 2026 (USD Million)
        2. 6.5.9.2. U.K. E-Liquids Market, 2016 – 2026 (Liter)
      10. 6.5.10. Italy
        1. 6.5.10.1. Italy E-Liquids Market, 2016 – 2026 (USD Million)
        2. 6.5.10.2. Italy E-Liquids Market, 2016 – 2026 (Liter)
      11. 6.5.11. Spain
        1. 6.5.11.1. Spain E-Liquids Market, 2016 – 2026 (USD Million)
        2. 6.5.11.2. Spain E-Liquids Market, 2016 – 2026 (Liter)
      12. 6.5.12. Rest of Europe
        1. 6.5.12.1. Rest of Europe E-Liquids Market, 2016 – 2026 (USD Million)
        2. 6.5.12.2. Rest of Europe E-Liquids Market, 2016 – 2026 (Liter)
    6. 6.6. Asia Pacific
      1. 6.6.1. Asia Pacific E-Liquids Market, 2016 – 2026 (USD Million)
        1. 6.6.1.1. Asia Pacific E-Liquids Market, by Country, 2016 – 2026 (USD Million)
      2. 6.6.2. Asia Pacific Market, 2016 – 2026 (Liter)
        1. 6.6.2.1. Asia Pacific E-Liquids Market, by Country, 2016 – 2026 (Liter)
      3. 6.6.3. Asia Pacific E-Liquids Market, by Type, 2016 – 2026
        1. 6.6.3.1. Asia Pacific E-Liquids Market, by Type, 2016 – 2026 (USD Million)
        2. 6.6.3.2. Asia Pacific E-Liquids Market, by Type, 2016 – 2026 (Liter)
      4. 6.6.4. Asia Pacific E-Liquids Market, by Flavour, 2016 – 2026
        1. 6.6.4.1. Asia Pacific E-Liquids Market, by Flavour, 2016 – 2026 (USD Million)
        2. 6.6.4.2. Asia Pacific E-Liquids Market, by Flavour, 2016 – 2026 (Liter)
      5. 6.6.5. Asia Pacific E-Liquids Market, by Distribution Channel, 2016 – 2026
        1. 6.6.5.1. Asia Pacific E-Liquids Market, by Distribution Channel, 2016 – 2026 (USD Million)
        2. 6.6.5.2. Asia Pacific E-Liquids Market, by Distribution Channel, 2016 – 2026 (Liter)
      6. 6.6.6. Asia Pacific E-Liquids Market, by Offline Channels, 2016 – 2026
        1. 6.6.6.1. Asia Pacific E-Liquids Market, by Offline Channels, 2016 – 2026 (USD Million)
        2. 6.6.6.2. Asia Pacific E-Liquids Market, by Offline Channels, 2016 – 2026 (Liter)
      7. 6.6.7. China
        1. 6.6.7.1. China E-Liquids Market, 2016 – 2026 (USD Million)
        2. 6.6.7.2. China E-Liquids Market, 2016 – 2026 (Liter)
      8. 6.6.8. Japan
        1. 6.6.8.1. Japan E-Liquids Market, 2016 – 2026 (USD Million)
        2. 6.6.8.2. Japan E-Liquids Market, 2016 – 2026 (Liter)
      9. 6.6.9. India
        1. 6.6.9.1. India E-Liquids Market, 2016 – 2026 (USD Million)
        2. 6.6.9.2. India E-Liquids Market, 2016 – 2026 (Liter)
      10. 6.6.10. South Korea
        1. 6.6.10.1. South Korea E-Liquids Market, 2016 – 2026 (USD Million)
        2. 6.6.10.2. South Korea E-Liquids Market, 2016 – 2026 (Liter)
      11. 6.6.11. South-East Asia
        1. 6.6.11.1. South-East Asia E-Liquids Market, 2016 – 2026 (USD Million)
        2. 6.6.11.2. South-East Asia E-Liquids Market, 2016 – 2026 (Liter)
      12. 6.6.12. Rest of Asia Pacific
        1. 6.6.12.1. Rest of Asia Pacific E-Liquids Market, 2016 – 2026 (USD Million)
        2. 6.6.12.2. Rest of Asia Pacific E-Liquids Market, 2016 – 2026 (Liter)
    7. 6.7. Latin America
      1. 6.7.1. Latin America E-Liquids Market, 2016 – 2026 (USD Million)
        1. 6.7.1.1. Latin America E-Liquids Market, by Country, 2016 – 2026 (USD Million)
      2. 6.7.2. Latin America Market, 2016 – 2026 (Liter)
        1. 6.7.2.1. Latin America E-Liquids Market, by Country, 2016 – 2026 (Liter)
      3. 6.7.3. Latin America E-Liquids Market, by Type, 2016 – 2026
        1. 6.7.3.1. Latin America E-Liquids Market, by Type, 2016 – 2026 (USD Million)
        2. 6.7.3.2. Latin America E-Liquids Market, by Type, 2016 – 2026 (Liter)
      4. 6.7.4. Latin America E-Liquids Market, by Flavour, 2016 – 2026
        1. 6.7.4.1. Latin America E-Liquids Market, by Flavour, 2016 – 2026 (USD Million)
        2. 6.7.4.2. Latin America E-Liquids Market, by Flavour, 2016 – 2026 (Liter)
      5. 6.7.5. Latin America E-Liquids Market, by Distribution Channel, 2016 – 2026
        1. 6.7.5.1. Latin America E-Liquids Market, by Distribution Channel, 2016 – 2026 (USD Million)
        2. 6.7.5.2. Latin America E-Liquids Market, by Distribution Channel, 2016 – 2026 (Liter)
      6. 6.7.6. Latin America E-Liquids Market, by Offline Channels, 2016 – 2026
        1. 6.7.6.1. Latin America E-Liquids Market, by Offline Channels, 2016 – 2026 (USD Million)
        2. 6.7.6.2. Latin America E-Liquids Market, by Offline Channels, 2016 – 2026 (Liter)
      7. 6.7.7. Brazil
        1. 6.7.7.1. Brazil E-Liquids Market, 2016 – 2026 (USD Million)
        2. 6.7.7.2. Brazil E-Liquids Market, 2016 – 2026 (Liter)
      8. 6.7.8. Mexico
        1. 6.7.8.1. Mexico E-Liquids Market, 2016 – 2026 (USD Million)
        2. 6.7.8.2. Mexico E-Liquids Market, 2016 – 2026 (Liter)
      9. 6.7.9. Rest of Latin America
        1. 6.7.9.1. Rest of Latin America E-Liquids Market, 2016 – 2026 (USD Million)
        2. 6.7.9.2. Rest of Latin America E-Liquids Market, 2016 – 2026 (Liter)
    8. 6.8. The Middle-East and Africa
      1. 6.8.1. The Middle-East and Africa E-Liquids Market, 2016 – 2026 (USD Million)
        1. 6.8.1.1. The Middle-East and Africa E-Liquids Market, by Country, 2016 – 2026 (USD Million)
      2. 6.8.2. The Middle-East and Africa Market, 2016 – 2026 (Liter)
        1. 6.8.2.1. The Middle-East and Africa E-Liquids Market, by Country, 2016 – 2026 (Liter)
      3. 6.8.3. The Middle-East and Africa E-Liquids Market, by Type, 2016 – 2026
        1. 6.8.3.1. The Middle-East and Africa E-Liquids Market, by Type, 2016 – 2026 (USD Million)
        2. 6.8.3.2. The Middle-East and Africa E-Liquids Market, by Type, 2016 – 2026 (Liter)
      4. 6.8.4. The Middle-East and Africa E-Liquids Market, by Flavour, 2016 – 2026
        1. 6.8.4.1. The Middle-East and Africa E-Liquids Market, by Flavour, 2016 – 2026 (USD Million)
        2. 6.8.4.2. The Middle-East and Africa E-Liquids Market, by Flavour, 2016 – 2026 (Liter)
      5. 6.8.5. The Middle-East and Africa E-Liquids Market, by Distribution Channel, 2016 – 2026
        1. 6.8.5.1. The Middle-East and Africa E-Liquids Market, by Distribution Channel, 2016 – 2026 (USD Million)
        2. 6.8.5.2. The Middle-East and Africa E-Liquids Market, by Distribution Channel, 2016 – 2026 (Liter)
      6. 6.8.6. The Middle-East and Africa E-Liquids Market, by Offline Channels, 2016 – 2026
        1. 6.8.6.1. The Middle-East and Africa E-Liquids Market, by Offline Channels, 2016 – 2026 (USD Million)
        2. 6.8.6.2. The Middle-East and Africa E-Liquids Market, by Offline Channels, 2016 – 2026 (Liter)
      7. 6.8.7. GCC Countries
        1. 6.8.7.1. GCC Countries E-Liquids Market, 2016 – 2026 (USD Million)
        2. 6.8.7.2. GCC Countries E-Liquids Market, 2016 – 2026 (Liter)
      8. 6.8.8. South Africa
        1. 6.8.8.1. South Africa E-Liquids Market, 2016 – 2026 (USD Million)
        2. 6.8.8.2. South Africa E-Liquids Market, 2016 – 2026 (Liter)
      9. 6.8.9. Rest of Middle-East Africa
        1. 6.8.9.1. Rest of Middle-East Africa E-Liquids Market, 2016 – 2026 (USD Million)
        2. 6.8.9.2. Rest of Middle-East Africa E-Liquids Market, 2016 – 2026 (Liter)
  7. Chapter 7 E-Liquids Production, Consumption, Export, Import by Regions
    1. 7.1. Global E-Liquids Production and Consumption, 2016 – 2026 (Liter)
    2. 7.2. Global Import and Export Analysis, by Region
  8. Chapter 8 E-Liquids Market – Competitive Landscape
    1. 8.1. Competitor Market Share – Revenue
    2. 8.2. Market Concentration Rate Analysis, Top 3 and Top 5 Players
    3. 8.3. Competitor Market Share – Volume
    4. 8.4. Strategic Developments
      1. 8.4.1. Acquisitions and Mergers
      2. 8.4.2. New Products
      3. 8.4.3. Research & Development Activities
  9. Chapter 9 Company Profiles
    1. 9.1. eLiquid Factory
      1. 9.1.1. Company Overview
      2. 9.1.2. Product/Service Portfolio
      3. 9.1.3. eLiquid Factory Sales, Revenue, Price, and Gross Margin
      4. 9.1.4. eLiquid Factory Revenue and Growth Rate
      5. 9.1.5. eLiquid Factory Market Share
      6. 9.1.6. Recent Initiatives, Funding/VC Activities, and Technological Innovations
    2. 9.2. Molecule Labs, Inc.
      1. 9.2.1. Company Overview
      2. 9.2.2. Product/Service Portfolio
      3. 9.2.3. Molecule Labs, Inc. Sales, Revenue, Price, and Gross Margin
      4. 9.2.4. Molecule Labs, Inc. Revenue and Growth Rate
      5. 9.2.5. Molecule Labs, Inc. Market Share
      6. 9.2.6. Recent Initiatives, Funding/VC Activities, and Technological Innovations
    3. 9.3. VMR Products LLC
      1. 9.3.1. Company Overview
      2. 9.3.2. Product/Service Portfolio
      3. 9.3.3. VMR Products LLC Sales, Revenue, Price, and Gross Margin
      4. 9.3.4. VMR Products LLC Revenue and Growth Rate
      5. 9.3.5. VMR Products LLC Market Share
      6. 9.3.6. Recent Initiatives, Funding/VC Activities, and Technological Innovations
    4. 9.4. Breazy
      1. 9.4.1. Company Overview
      2. 9.4.2. Product/Service Portfolio
      3. 9.4.3. Breazy Sales, Revenue, Price, and Gross Margin
      4. 9.4.4. Breazy Revenue and Growth Rate
      5. 9.4.5. Breazy Market Share
      6. 9.4.6. Recent Initiatives, Funding/VC Activities, and Technological Innovations
    5. 9.5. Crystal Cannon Vapes LLC
      1. 9.5.1. Company Overview
      2. 9.5.2. Product/Service Portfolio
      3. 9.5.3. Crystal Cannon Vapes LLC Sales, Revenue, Price, and Gross Margin
      4. 9.5.4. Crystal Cannon Vapes LLC Revenue and Growth Rate
      5. 9.5.5. Crystal Cannon Vapes LLC Market Share
      6. 9.5.6. Recent Initiatives, Funding/VC Activities, and Technological Innovations
    6. 9.6. Nicopure Labs LLC
      1. 9.6.1. Company Overview
      2. 9.6.2. Product/Service Portfolio
      3. 9.6.3. Nicopure Labs LLC Sales, Revenue, Price, and Gross Margin
      4. 9.6.4. Nicopure Labs LLC Revenue and Growth Rate
      5. 9.6.5. Nicopure Labs LLC Market Share
      6. 9.6.6. Recent Initiatives, Funding/VC Activities, and Technological Innovations
    7. 9.7. Vapes Dudes
      1. 9.7.1. Company Overview
      2. 9.7.2. Product/Service Portfolio
      3. 9.7.3. Vapes Dudes Sales, Revenue, Price, and Gross Margin
      4. 9.7.4. Vapes Dudes Revenue and Growth Rate
      5. 9.7.5. Vapes Dudes Market Share
      6. 9.7.6. Recent Initiatives, Funding/VC Activities, and Technological Innovations
    8. 9.8. VaporFi Inc.
      1. 9.8.1. Company Overview
      2. 9.8.2. Product/Service Portfolio
      3. 9.8.3. VaporFi Inc. Sales, Revenue, Price, and Gross Margin
      4. 9.8.4. VaporFi Inc. Revenue and Growth Rate
      5. 9.8.5. VaporFi Inc. Market Share
      6. 9.8.6. Recent Initiatives, Funding/VC Activities, and Technological Innovations
    9. 9.9. Black Note Vape Inc.
      1. 9.9.1. Company Overview
      2. 9.9.2. Product/Service Portfolio
      3. 9.9.3. Black Note Vape Inc. Sales, Revenue, Price, and Gross Margin
      4. 9.9.4. Black Note Vape Inc. Revenue and Growth Rate
      5. 9.9.5. Black Note Vape Inc. Market Share
      6. 9.9.6. Recent Initiatives, Funding/VC Activities, and Technological Innovations
    10. 9.10. Fontem Ventures
      1. 9.10.1. Company Overview
      2. 9.10.2. Product/Service Portfolio
      3. 9.10.3. Fontem Ventures Sales, Revenue, Price, and Gross Margin
      4. 9.10.4. Fontem Ventures Revenue and Growth Rate
      5. 9.10.5. Fontem Ventures Market Share
      6. 9.10.6. Recent Initiatives, Funding/VC Activities, and Technological Innovations
    11. 9.11. Mig Vapor LLC
      1. 9.11.1. Company Overview
      2. 9.11.2. Product/Service Portfolio
      3. 9.11.3. Mig Vapor LLC Sales, Revenue, Price, and Gross Margin
      4. 9.11.4. Mig Vapor LLC Revenue and Growth Rate
      5. 9.11.5. Mig Vapor LLC Market Share
      6. 9.11.6. Recent Initiatives, Funding/VC Activities, and Technological Innovations
    12. 9.12. Others
      1. 9.12.1. Company Overview
      2. 9.12.2. Product/Service Portfolio
      3. 9.12.3. Others Sales, Revenue, Price, and Gross Margin
      4. 9.12.4. Others Revenue and Growth Rate
      5. 9.12.5. Others Market Share
      6. 9.12.6. Recent Initiatives, Funding/VC Activities, and Technological Innovations
  10. Chapter 10 E-Liquids — Industry Analysis
    1. 10.1. Introduction and Taxonomy
    2. 10.2. E-Liquids Market – Key Trends
      1. 10.2.1. Market Drivers
      2. 10.2.2. Market Restraints
      3. 10.2.3. Market Opportunities
    3. 10.3. Value Chain Analysis
    4. 10.4. Key Mandates and Regulations
    5. 10.5. Technology Roadmap and Timeline
    6. 10.6. E-Liquids Market – Attractiveness Analysis
      1. 10.6.1. By Type
      2. 10.6.2. By Flavour
      3. 10.6.3. By Distribution Channel
      4. 10.6.4. By Offline Channels
      5. 10.6.5. By Region
  11. Chapter 11 Raw Material Analysis
    1. 11.1. E-Liquids Key Raw Material Analysis
      1. 11.1.1. Key Raw Materials
      2. 11.1.2. Price Trend of Key Raw Materials
    2. 11.2. Key Suppliers of Raw Materials
    3. 11.3. Proportion of Manufacturing Cost Structure
      1. 11.3.1. Raw Materials Cost
      2. 11.3.2. Labor Cost
      3. 11.3.3. Manufacturing Expenses
      4. 11.3.4. Miscellaneous Expenses
    4. 11.4. Manufacturing Cost Analysis of E-Liquids
  12. Chapter 12 Industrial Chain, Sourcing Strategy, and Downstream Buyers
    1. 12.1. E-Liquids Industrial Chain Analysis
    2. 12.2. Upstream Raw Materials Sourcing
      1. 12.2.1. Risk Mitigation:
      2. 12.2.2. Supplier Relationships:
      3. 12.2.3. Business Processes:
      4. 12.2.4. Securing the Product:
    3. 12.3. Raw Materials Sources of E-Liquids Major Manufacturers
    4. 12.4. Downstream Buyers
    5. 12.5. Distributors/Traders List
  13. Chapter 13 Marketing Strategy Analysis, Distributors
    1. 13.1. Marketing Channel
    2. 13.2. Direct Marketing
    3. 13.3. Indirect Marketing
    4. 13.4. Marketing Channel Development Trends
    5. 13.5. Economic/Political Environmental Change
  14. Chapter 14 Report Conclusion & Key Insights
    1. 14.1. Key Insights from Primary Interviews & Surveys Respondents
    2. 14.2. Key Takeaways from Analysts, Consultants, and Industry Leaders
  15. Chapter 15 Research Approach & Methodology
    1. 15.1. Report Description
    2. 15.2. Research Scope
    3. 15.3. Research Methodology
      1. 15.3.1. Secondary Research
      2. 15.3.2. Primary Research
      3. 15.3.3. Statistical Models
        1. 15.3.3.1. Company Share Analysis Model
        2. 15.3.3.2. Revenue Based Modeling
      4. 15.3.4. Research Limitations 

      List of Figures

      Fig.1	Product Picture of E-Liquids
      Fig.2	Global E-Liquids Market, 2016 – 2026 (USD Million)
      Fig.3	Global E-Liquids Market, 2016 – 2026 (Liter)
      Fig.4	Global E-Liquids Market Absolute Revenue Opportunity, 2016 – 2026 (USD Million)
      Fig.5	Global E-Liquids Market Incremental Revenue Opportunity, 2020 – 2026 (USD Million)
      Fig.6	Global E-Liquids Market Share, by Type, 2019 & 2026 (USD Million)
      Fig.7	Global E-Liquids Market Share, by Type, 2019 & 2026 (Liter)
      Fig.8	Global Pre-filled E-Liquids Market, 2016 – 2026 (USD Million)
      Fig.9	Global Pre-filled E-Liquids Market, 2016 – 2026 (Liter)
      Fig.10	Global Bottled E-Liquids Market, 2016 – 2026 (USD Million)
      Fig.11	Global Bottled E-Liquids Market, 2016 – 2026 (Liter)
      Fig.12	Global E-Liquids Market Share, by Flavour, 2019 & 2026 (USD Million)
      Fig.13	Global E-Liquids Market Share, by Flavour, 2019 & 2026 (Liter)
      Fig.14	Global Menthol E-Liquids Market, 2016 – 2026 (USD Million)
      Fig.15	Global Menthol E-Liquids Market, 2016 – 2026 (Liter)
      Fig.16	Global Tobacco E-Liquids Market, 2016 – 2026 (USD Million)
      Fig.17	Global Tobacco E-Liquids Market, 2016 – 2026 (Liter)
      Fig.18	Global Fruits & Nuts E-Liquids Market, 2016 – 2026 (USD Million)
      Fig.19	Global Fruits & Nuts E-Liquids Market, 2016 – 2026 (Liter)
      Fig.20	Global Chocolate E-Liquids Market, 2016 – 2026 (USD Million)
      Fig.21	Global Chocolate E-Liquids Market, 2016 – 2026 (Liter)
      Fig.22	Global Others E-Liquids Market, 2016 – 2026 (USD Million)
      Fig.23	Global Others E-Liquids Market, 2016 – 2026 (Liter)
      Fig.24	Global E-Liquids Market Share, by Distribution Channel, 2019 & 2026 (USD Million)
      Fig.25	Global E-Liquids Market Share, by Distribution Channel, 2019 & 2026 (Liter)
      Fig.26	Global Online Channels E-Liquids Market, 2016 – 2026 (USD Million)
      Fig.27	Global Online Channels E-Liquids Market, 2016 – 2026 (Liter)
      Fig.28	Global Offline Channels E-Liquids Market, 2016 – 2026 (USD Million)
      Fig.29	Global Offline Channels E-Liquids Market, 2016 – 2026 (Liter)
      Fig.30	Global E-Liquids Market Share, by Offline Channels, 2019 & 2026 (USD Million)
      Fig.31	Global E-Liquids Market Share, by Offline Channels, 2019 & 2026 (Liter)
      Fig.32	Global Retail Stores E-Liquids Market, 2016 – 2026 (USD Million)
      Fig.33	Global Retail Stores E-Liquids Market, 2016 – 2026 (Liter)
      Fig.34	Global Convenience Stores E-Liquids Market, 2016 – 2026 (USD Million)
      Fig.35	Global Convenience Stores E-Liquids Market, 2016 – 2026 (Liter)
      Fig.36	Global Speciality Stores E-Liquids Market, 2016 – 2026 (USD Million)
      Fig.37	Global Speciality Stores E-Liquids Market, 2016 – 2026 (Liter)
      Fig.38	Global Supermarkets E-Liquids Market, 2016 – 2026 (USD Million)
      Fig.39	Global Supermarkets E-Liquids Market, 2016 – 2026 (Liter)
      Fig.40	Global Others E-Liquids Market, 2016 – 2026 (USD Million)
      Fig.41	Global Others E-Liquids Market, 2016 – 2026 (Liter)
      Fig.42	Global E-Liquids Market Share, by Region, 2019 & 2026 (USD Million)
      Fig.43	Global E-Liquids Market Share, by Region, 2019 & 2026 (Liter)
      Fig.44	North America E-Liquids Market, 2016 – 2026 (USD Million)
      Fig.45	North America E-Liquids Market, 2016 – 2026 (Liter)
      Fig.46	U.S. E-Liquids Market, 2016 – 2026 (USD Million)
      Fig.47	U.S. E-Liquids  Market, 2016 – 2026 (Liter)
      Fig.48	Canada E-Liquids Market, 2016 – 2026 (USD Million)
      Fig.49	Canada E-Liquids  Market, 2016 – 2026 (Liter)
      Fig.50	Europe E-Liquids Market, 2016 – 2026 (USD Million)
      Fig.51	Europe E-Liquids Market, 2016 – 2026 (Liter)
      Fig.52	Germany E-Liquids Market, 2016 – 2026 (USD Million)
      Fig.53	Germany E-Liquids  Market, 2016 – 2026 (Liter)
      Fig.54	France E-Liquids Market, 2016 – 2026 (USD Million)
      Fig.55	France E-Liquids  Market, 2016 – 2026 (Liter)
      Fig.56	U.K. E-Liquids Market, 2016 – 2026 (USD Million)
      Fig.57	U.K. E-Liquids  Market, 2016 – 2026 (Liter)
      Fig.58	Italy E-Liquids Market, 2016 – 2026 (USD Million)
      Fig.59	Italy E-Liquids  Market, 2016 – 2026 (Liter)
      Fig.60	Spain E-Liquids Market, 2016 – 2026 (USD Million)
      Fig.61	Spain E-Liquids  Market, 2016 – 2026 (Liter)
      Fig.62	Rest of Europe E-Liquids Market, 2016 – 2026 (USD Million)
      Fig.63	Rest of Europe E-Liquids  Market, 2016 – 2026 (Liter)
      Fig.64	Asia Pacific E-Liquids Market, 2016 – 2026 (USD Million)
      Fig.65	Asia Pacific E-Liquids Market, 2016 – 2026 (Liter)
      Fig.66	China E-Liquids Market, 2016 – 2026 (USD Million)
      Fig.67	China E-Liquids  Market, 2016 – 2026 (Liter)
      Fig.68	Japan E-Liquids Market, 2016 – 2026 (USD Million)
      Fig.69	Japan E-Liquids  Market, 2016 – 2026 (Liter)
      Fig.70	India E-Liquids Market, 2016 – 2026 (USD Million)
      Fig.71	India E-Liquids  Market, 2016 – 2026 (Liter)
      Fig.72	South  Korea E-Liquids Market, 2016 – 2026 (USD Million)
      Fig.73	South  Korea E-Liquids  Market, 2016 – 2026 (Liter)
      Fig.74	South-East Asia E-Liquids Market, 2016 – 2026 (USD Million)
      Fig.75	South-East Asia E-Liquids  Market, 2016 – 2026 (Liter)
      Fig.76	Rest of Asia Pacific E-Liquids Market, 2016 – 2026 (USD Million)
      Fig.77	Rest of Asia Pacific E-Liquids  Market, 2016 – 2026 (Liter)
      Fig.78	Latin America E-Liquids Market, 2016 – 2026 (USD Million)
      Fig.79	Latin America E-Liquids Market, 2016 – 2026 (Liter)
      Fig.80	Brazil E-Liquids Market, 2016 – 2026 (USD Million)
      Fig.81	Brazil E-Liquids  Market, 2016 – 2026 (Liter)
      Fig.82	Mexico E-Liquids Market, 2016 – 2026 (USD Million)
      Fig.83	Mexico E-Liquids  Market, 2016 – 2026 (Liter)
      Fig.84	Rest of Latin America E-Liquids Market, 2016 – 2026 (USD Million)
      Fig.85	Rest of Latin America E-Liquids  Market, 2016 – 2026 (Liter)
      Fig.86	The Middle-East and Africa E-Liquids Market, 2016 – 2026 (USD Million)
      Fig.87	The Middle-East and Africa E-Liquids Market, 2016 – 2026 (Liter)
      Fig.88	GCC Countries E-Liquids Market, 2016 – 2026 (USD Million)
      Fig.89	GCC Countries E-Liquids  Market, 2016 – 2026 (Liter)
      Fig.90	South Africa E-Liquids Market, 2016 – 2026 (USD Million)
      Fig.91	South Africa E-Liquids  Market, 2016 – 2026 (Liter)
      Fig.92	Rest of Middle-East Africa E-Liquids Market, 2016 – 2026 (USD Million)
      Fig.93	Rest of Middle-East Africa E-Liquids  Market, 2016 – 2026 (Liter)
      Fig.94	Global E-Liquids Production and Consumption, 2016 – 2026 (Liter)
      Fig.95	North America E-Liquids Production and Consumption, 2016 – 2026 (USD Million) (Liter)
      Fig.96	Europe E-Liquids Production and Consumption, 2016 – 2026 (USD Million) (Liter)
      Fig.97	Asia Pacific E-Liquids Production and Consumption, 2016 – 2026 (USD Million) (Liter)
      Fig.98	Latin America E-Liquids Production and Consumption, 2016 – 2026 (USD Million) (Liter)
      Fig.99	The Middle-East and Africa E-Liquids Production and Consumption, 2016 – 2026 (USD Million) (Liter)
      Fig.100	Competitor Market Share – Revenue
      Fig.101	Competitor Market Share – Volume
      Fig.102	eLiquid Factory Revenue and Growth Rate
      Fig.103	eLiquid Factory Market Share
      Fig.104	Molecule Labs, Inc. Revenue and Growth Rate
      Fig.105	Molecule Labs, Inc. Market Share
      Fig.106	VMR Products LLC Revenue and Growth Rate
      Fig.107	VMR Products LLC Market Share
      Fig.108	Breazy Revenue and Growth Rate
      Fig.109	Breazy Market Share
      Fig.110	Crystal Cannon Vapes LLC Revenue and Growth Rate
      Fig.111	Crystal Cannon Vapes LLC Market Share
      Fig.112	Nicopure Labs LLC Revenue and Growth Rate
      Fig.113	Nicopure Labs LLC Market Share
      Fig.114	Vapes Dudes Revenue and Growth Rate
      Fig.115	Vapes Dudes Market Share
      Fig.116	VaporFi Inc. Revenue and Growth Rate
      Fig.117	VaporFi Inc. Market Share
      Fig.118	Black Note Vape Inc. Revenue and Growth Rate
      Fig.119	Black Note Vape Inc. Market Share
      Fig.120	Fontem Ventures Revenue and Growth Rate
      Fig.121	Fontem Ventures Market Share
      Fig.122	Mig Vapor LLC Revenue and Growth Rate
      Fig.123	Mig Vapor LLC Market Share
      Fig.124	Others Revenue and Growth Rate
      Fig.125	Others Market Share
      Fig.126	Market Dynamics
      Fig.127	Global E-Liquids – Value Chain Analysis
      Fig.128	Key Mandates and Regulations
      Fig.129	Technology Roadmap and Timeline
      Fig.130	Market Attractiveness Analysis – By Type
      Fig.131	Market Attractiveness Analysis – By Flavour
      Fig.132	Market Attractiveness Analysis – By Distribution Channel
      Fig.133	Market Attractiveness Analysis – By Offline Channels
      Fig.134	Market Attractiveness Analysis – By Region
      Fig.135	Manufacturing Cost Structure of E-Liquids
      Fig.136	E-Liquids Industrial Chain Analysis
      Fig.137	Market Channels
      Fig.138	Marketing Channel Development Trend
      Fig.139	Growth in World Gross Product, 2008-2018
      

      List of Tables

      Table 1	Global E-Liquids Market, 2019 & 2026 (USD Million)
      Table 2	Global E-Liquids Market, by Type, 2016 – 2026 (USD Million)
      Table 3	Global E-Liquids Market, by Type, 2016 – 2026 (Liter)
      Table 4	Global E-Liquids Market, by Flavour, 2016 – 2026 (USD Million)
      Table 5	Global E-Liquids Market, by Flavour, 2016 – 2026 (Liter)
      Table 6	Global E-Liquids Market, by Distribution Channel, 2016 – 2026 (USD Million)
      Table 7	Global E-Liquids Market, by Distribution Channel, 2016 – 2026 (Liter)
      Table 8	Global E-Liquids Market, by Offline Channels, 2016 – 2026 (USD Million)
      Table 9	Global E-Liquids Market, by Offline Channels, 2016 – 2026 (Liter)
      Table 10 Global E-Liquids Market, by Region, 2016 – 2026 (USD Million)
      Table 11 Global E-Liquids Market, by Region, 2016 – 2026 (Liter)
      Table 12 North America E-Liquids Market, by Country, 2016 – 2026 (USD Million)
      Table 13 North America E-Liquids Market, by Country, 2016 – 2026 (Liter)
      Table 14 North America E-Liquids Market, by Type, 2016 – 2026 (USD Million)
      Table 15 North America E-Liquids Market, by Type, 2016 – 2026 (Liter)
      Table 16 North America E-Liquids Market, by Flavour, 2016 – 2026 (USD Million)
      Table 17 North America E-Liquids Market, by Flavour, 2016 – 2026 (Liter)
      Table 18 North America E-Liquids Market, by Distribution Channel, 2016 – 2026 (USD Million)
      Table 19 North America E-Liquids Market, by Distribution Channel, 2016 – 2026 (Liter)
      Table 20 North America E-Liquids Market, by Offline Channels, 2016 – 2026 (USD Million)
      Table 21 North America E-Liquids Market, by Offline Channels, 2016 – 2026 (Liter)
      Table 22 Europe E-Liquids Market, by Country, 2016 – 2026 (USD Million)
      Table 23 Europe E-Liquids Market, by Country, 2016 – 2026 (Liter)
      Table 24 Europe E-Liquids Market, by Type, 2016 – 2026 (USD Million)
      Table 25 Europe E-Liquids Market, by Type, 2016 – 2026 (Liter)
      Table 26 Europe E-Liquids Market, by Flavour, 2016 – 2026 (USD Million)
      Table 27 Europe E-Liquids Market, by Flavour, 2016 – 2026 (Liter)
      Table 28 Europe E-Liquids Market, by Distribution Channel, 2016 – 2026 (USD Million)
      Table 29 Europe E-Liquids Market, by Distribution Channel, 2016 – 2026 (Liter)
      Table 30 Europe E-Liquids Market, by Offline Channels, 2016 – 2026 (USD Million)
      Table 31 Europe E-Liquids Market, by Offline Channels, 2016 – 2026 (Liter)
      Table 32 Asia Pacific E-Liquids Market, by Country, 2016 – 2026 (USD Million)
      Table 33 Asia Pacific E-Liquids Market, by Country, 2016 – 2026 (Liter)
      Table 34 Asia Pacific E-Liquids Market, by Type, 2016 – 2026 (USD Million)
      Table 35 Asia Pacific E-Liquids Market, by Type, 2016 – 2026 (Liter)
      Table 36 Asia Pacific E-Liquids Market, by Flavour, 2016 – 2026 (USD Million)
      Table 37 Asia Pacific E-Liquids Market, by Flavour, 2016 – 2026 (Liter)
      Table 38 Asia Pacific E-Liquids Market, by Distribution Channel, 2016 – 2026 (USD Million)
      Table 39 Asia Pacific E-Liquids Market, by Distribution Channel, 2016 – 2026 (Liter)
      Table 40 Asia Pacific E-Liquids Market, by Offline Channels, 2016 – 2026 (USD Million)
      Table 41 Asia Pacific E-Liquids Market, by Offline Channels, 2016 – 2026 (Liter)
      Table 42 Latin America E-Liquids Market, by Country, 2016 – 2026 (USD Million)
      Table 43 Latin America E-Liquids Market, by Country, 2016 – 2026 (Liter)
      Table 44 Latin America E-Liquids Market, by Type, 2016 – 2026 (USD Million)
      Table 45 Latin America E-Liquids Market, by Type, 2016 – 2026 (Liter)
      Table 46 Latin America E-Liquids Market, by Flavour, 2016 – 2026 (USD Million)
      Table 47 Latin America E-Liquids Market, by Flavour, 2016 – 2026 (Liter)
      Table 48 Latin America E-Liquids Market, by Distribution Channel, 2016 – 2026 (USD Million)
      Table 49 Latin America E-Liquids Market, by Distribution Channel, 2016 – 2026 (Liter)
      Table 50 Latin America E-Liquids Market, by Offline Channels, 2016 – 2026 (USD Million)
      Table 51 Latin America E-Liquids Market, by Offline Channels, 2016 – 2026 (Liter)
      Table 52 The Middle-East and Africa E-Liquids Market, by Country, 2016 – 2026 (USD Million)
      Table 53 The Middle-East and Africa E-Liquids Market, by Country, 2016 – 2026 (Liter)
      Table 54 The Middle-East and Africa E-Liquids Market, by Type, 2016 – 2026 (USD Million)
      Table 55 The Middle-East and Africa E-Liquids Market, by Type, 2016 – 2026 (Liter)
      Table 56 The Middle-East and Africa E-Liquids Market, by Flavour, 2016 – 2026 (USD Million)
      Table 57 The Middle-East and Africa E-Liquids Market, by Flavour, 2016 – 2026 (Liter)
      Table 58 The Middle-East and Africa E-Liquids Market, by Distribution Channel, 2016 – 2026 (USD Million)
      Table 59 The Middle-East and Africa E-Liquids Market, by Distribution Channel, 2016 – 2026 (Liter)
      Table 60 The Middle-East and Africa E-Liquids Market, by Offline Channels, 2016 – 2026 (USD Million)
      Table 61 The Middle-East and Africa E-Liquids Market, by Offline Channels, 2016 – 2026 (Liter)
      Table 62 North America E-Liquids Production, Consumption, Export, Import, 2016 – 2020
      Table 63 Europe E-Liquids Production, Consumption, Export, Import, 2016 – 2020
      Table 64 Asia Pacific E-Liquids Production, Consumption, Export, Import, 2016 – 2020
      Table 65 Latin America E-Liquids Production, Consumption, Export, Import, 2016 – 2020
      Table 66 The Middle-East and Africa E-Liquids Production, Consumption, Export, Import, 2016 – 2020
      Table 67 Global E-Liquids Market - Company Revenue Analysis, 2016 – 2020 (USD Million)
      Table 68 Global E-Liquids Market - Company Revenue Share Analysis, 2016 – 2020 (%)
      Table 69 Global E-Liquids Market - Company Volume Analysis, 2016 – 2020 (Liter)
      Table 70 Global E-Liquids Market - Company Volume Share Analysis, 2016 – 2020 (%)
      Table 71 Acquisitions and Mergers
      Table 72 Market Drivers – Impact Analysis
      Table 73 Market Restraints
      Table 74 Market Opportunities
      Table 75 Production Base and Market Concentration Rate of Raw Material
      Table 76 Key Suppliers of Raw Materials
      Table 77 Raw Materials Sources of E-Liquids Major Manufacturers
      Table 78 Major Buyers of E-Liquids
      Table 79 Distributors/Traders of E-Liquids by Region
      

Industry Major Market Players

  • Liquid Factory
  • Molecule Labs Inc.
  • VMR Products LLC
  • Breazy
  • Crystal Cannon Vapes LLC
  • Nicopure Labs LLC
  • Vapes Dudes
  • VaporFi Inc.
  • Black Note Vape Inc.
  • Fontem Ventures
  • Mig Vapor LLC