- Chapter 1. Executive Summary 20
- Chapter 2. E-Invoicing market – Type Analysis 22
- 2.1. Global E-Invoicing Market – Type Overview 22
- 2.2. Global E-Invoicing Market Share, by Type, 2018 & 2025 (USD Million ) 22
- 2.3. Cloud-Based 23
- 2.3.1. Global Cloud-Based E-Invoicing Market, 2015-2027 (USD Million ) 23
- 2.4. On-Premise 24
- 2.4.1. Global On-Premise E-Invoicing Market, 2015-2027 (USD Million ) 24
- Chapter 3. E-Invoicing market – End-Users Analysis 24
- 3.1. Global E-Invoicing Market – End-Users Overview 24
- 3.2. Global E-Invoicing Market Share, by End-Users , 2018 & 2025 (USD Million ) 25
- 3.3. Energy 26
- 3.3.1. Global Energy E-Invoicing Market, 2015-2027 (USD Million ) 26
- 3.4. FMCG 27
- 3.4.1. Global FMCG E-Invoicing Market, 2015-2027 (USD Million ) 27
- 3.5. E-Commerce 28
- 3.5.1. Global E-Commerce E-Invoicing Market, 2015-2027 (USD Million ) 28
- 3.6. Finance 29
- 3.6.1. Global Finance E-Invoicing Market, 2015-2027 (USD Million ) 29
- 3.7. Express Service 30
- 3.7.1. Global Express Service E-Invoicing Market, 2015-2027 (USD Million ) 30
- 3.8. Others 31
- 3.8.1. Global Others E-Invoicing Market, 2015-2027 (USD Million ) 31
- Chapter 4. E-Invoicing market – Regional Analysis 32
- 4.1. Global E-Invoicing Market Regional Overview 32
- 4.2. Global E-Invoicing Market Share, by Region, 2018 & 2025 (Value) 32
- 4.3. North America 34
- 4.3.1. North America E-Invoicing Market size and forecast, 2015-2027 34
- 4.3.2. North America E-Invoicing Market, by Country, 2018 & 2025 (USD Million ) 34
- 4.3.3. North America E-Invoicing Market, by Type, 2015-2027 36
- 4.3.3.1. North America E-Invoicing Market, by Type, 2015-2027 (USD Million ) 36
- 4.3.4. North America E-Invoicing Market, by End-Users , 2015-2027 37
- 4.3.4.1. North America E-Invoicing Market, by End-Users , 2015-2027 (USD Million ) 37
- 4.3.5. U.S. 38
- 4.3.5.1. U.S. Market size and forecast, 2015-2027 (USD Million ) 38
- 4.3.6. Canada 39
- 4.3.6.1. Canada Market size and forecast, 2015-2027 (USD Million ) 39
- 4.3.7. Mexico 40
- 4.3.7.1. Mexico Market size and forecast, 2015-2027 (USD Million ) 40
- 4.4. Europe 41
- 4.4.1. Europe E-Invoicing Market size and forecast, 2015-2027 41
- 4.4.2. Europe E-Invoicing Market, by Country, 2018 & 2025 (USD Million ) 41
- 4.4.3. Europe E-Invoicing Market, by Type, 2015-2027 43
- 4.4.3.1. Europe E-Invoicing Market, by Type, 2015-2027 (USD Million ) 43
- 4.4.4. Europe E-Invoicing Market, by End-Users , 2015-2027 44
- 4.4.4.1. Europe E-Invoicing Market, by End-Users , 2015-2027 (USD Million ) 44
- 4.4.5. Germany 45
- 4.4.5.1. Germany Market size and forecast, 2015-2027 (USD Million ) 45
- 4.4.6. France 46
- 4.4.6.1. France Market size and forecast, 2015-2027 (USD Million ) 46
- 4.4.7. U.K. 47
- 4.4.7.1. U.K. Market size and forecast, 2015-2027 (USD Million ) 47
- 4.4.8. Italy 48
- 4.4.8.1. Italy Market size and forecast, 2015-2027 (USD Million ) 48
- 4.4.9. Spain 49
- 4.4.9.1. Spain Market size and forecast, 2015-2027 (USD Million ) 49
- 4.4.10. Nordic Countries 50
- 4.4.10.1. Nordic Countries Market size and forecast, 2015-2027 (USD Million ) 50
- 4.4.11. Benelux Union 51
- 4.4.11.1. Benelux Union Market size and forecast, 2015-2027 (USD Million ) 51
- 4.4.12. Rest of Europe 52
- 4.4.12.1. Rest of Europe Market size and forecast, 2015-2027 (USD Million ) 52
- 4.5. Asia Pacific 53
- 4.5.1. Asia Pacific E-Invoicing Market size and forecast, 2015-2027 53
- 4.5.2. Asia Pacific E-Invoicing Market, by Country, 2018 & 2025 (USD Million ) 53
- 4.5.3. Asia Pacific E-Invoicing Market, by Type, 2015-2027 55
- 4.5.3.1. Asia Pacific E-Invoicing Market, by Type, 2015-2027 (USD Million ) 55
- 4.5.4. Asia Pacific E-Invoicing Market, by End-Users , 2015-2027 56
- 4.5.4.1. Asia Pacific E-Invoicing Market, by End-Users , 2015-2027 (USD Million ) 56
- 4.5.5. China 57
- 4.5.5.1. China Market size and forecast, 2015-2027 (USD Million ) 57
- 4.5.6. Japan 58
- 4.5.6.1. Japan Market size and forecast, 2015-2027 (USD Million ) 58
- 4.5.7. India 59
- 4.5.7.1. India Market size and forecast, 2015-2027 (USD Million ) 59
- 4.5.8. New Zealand 60
- 4.5.8.1. New Zealand Market size and forecast, 2015-2027 (USD Million ) 60
- 4.5.9. Australia 61
- 4.5.9.1. Australia Market size and forecast, 2015-2027 (USD Million ) 61
- 4.5.10. South Korea 62
- 4.5.10.1. South Korea Market size and forecast, 2015-2027 (USD Million ) 62
- 4.5.11. South-East Asia 63
- 4.5.11.1. South-East Asia Market size and forecast, 2015-2027 (USD Million ) 63
- 4.5.12. Rest of Asia Pacific 64
- 4.5.12.1. Rest of Asia Pacific Market size and forecast, 2015-2027 (USD Million ) 64
- 4.6. Latin America 65
- 4.6.1. Latin America E-Invoicing Market size and forecast, 2015-2027 65
- 4.6.2. Latin America E-Invoicing Market, by Country, 2018 & 2025 (USD Million ) 65
- 4.6.3. Latin America E-Invoicing Market, by Type, 2015-2027 67
- 4.6.3.1. Latin America E-Invoicing Market, by Type, 2015-2027 (USD Million ) 67
- 4.6.4. Latin America E-Invoicing Market, by End-Users , 2015-2027 68
- 4.6.4.1. Latin America E-Invoicing Market, by End-Users , 2015-2027 (USD Million ) 68
- 4.6.5. Brazil 69
- 4.6.5.1. Brazil Market size and forecast, 2015-2027 (USD Million ) 69
- 4.6.6. Argentina 70
- 4.6.6.1. Argentina Market size and forecast, 2015-2027 (USD Million ) 70
- 4.6.7. Rest of Latin America 71
- 4.6.7.1. Rest of Latin America Market size and forecast, 2015-2027 (USD Million ) 71
- 4.7. The Middle-East and Africa 72
- 4.7.1. The Middle-East and Africa E-Invoicing Market size and forecast, 2015-2027 72
- 4.7.2. The Middle-East and Africa E-Invoicing Market, by Country, 2018 & 2025 (USD Million ) 72
- 4.7.3. The Middle-East and Africa E-Invoicing Market, by Type, 2015-2027 74
- 4.7.3.1. The Middle-East and Africa E-Invoicing Market, by Type, 2015-2027 (USD Million ) 74
- 4.7.4. The Middle-East and Africa E-Invoicing Market, by End-Users , 2015-2027 75
- 4.7.4.1. The Middle-East and Africa E-Invoicing Market, by End-Users , 2015-2027 (USD Million ) 75
- 4.7.5. Saudi Arabia 76
- 4.7.5.1. Saudi Arabia Market size and forecast, 2015-2027 (USD Million ) 76
- 4.7.6. UAE 77
- 4.7.6.1. UAE Market size and forecast, 2015-2027 (USD Million ) 77
- 4.7.7. Egypt 78
- 4.7.7.1. Egypt Market size and forecast, 2015-2027 (USD Million ) 78
- 4.7.8. Kuwait 79
- 4.7.8.1. Kuwait Market size and forecast, 2015-2027 (USD Million ) 79
- 4.7.9. South Africa 80
- 4.7.9.1. South Africa Market size and forecast, 2015-2027 (USD Million ) 80
- 4.7.10. Rest of Middle-East Africa 81
- 4.7.10.1. Rest of Middle-East Africa Market size and forecast, 2015-2027 (USD Million ) 81
- Chapter 5. E-Invoicing market – Competitive Landscape 82
- 5.1. Competitor Market Share – Revenue 82
- 5.2. Market Concentration Rate Analysis, Top 3 and Top 5 Players 84
- 5.3. Strategic Development 85
- 5.3.1. Acquisitions and Mergers 85
- 5.3.2. New Products 85
- 5.3.3. Research & Development Activities 85
- Chapter 6. Company Profiles 86
- 6.1. YAT Software 86
- 6.1.1. Company Overview 86
- 6.1.2. YAT Software Revenue and Gross Margin 86
- 6.1.3. Product portfolio 87
- 6.1.4. Recent initiatives 88
- 6.2. Araize Inc. 88
- 6.2.1. Company Overview 88
- 6.2.2. Araize Inc. Revenue and Gross Margin 88
- 6.2.3. Product portfolio 89
- 6.2.4. Recent initiatives 90
- 6.3. Tipalti Solutions Ltd. 90
- 6.3.1. Company Overview 90
- 6.3.2. Tipalti Solutions Ltd. Revenue and Gross Margin 90
- 6.3.3. Product portfolio 91
- 6.3.4. Recent initiatives 92
- 6.4. Freshbooks 92
- 6.4.1. Company Overview 92
- 6.4.2. Freshbooks Revenue and Gross Margin 92
- 6.4.3. Product portfolio 93
- 6.4.4. Recent initiatives 94
- 6.5. KashFlow Software 94
- 6.5.1. Company Overview 94
- 6.5.2. KashFlow Software Revenue and Gross Margin 94
- 6.5.3. Product portfolio 95
- 6.5.4. Recent initiatives 96
- 6.6. Zervant 96
- 6.6.1. Company Overview 96
- 6.6.2. Zervant Revenue and Gross Margin 96
- 6.6.3. Product portfolio 97
- 6.6.4. Recent initiatives 98
- 6.7. Mercury Systems Inc. 98
- 6.7.1. Company Overview 98
- 6.7.2. Mercury Systems Inc. Revenue and Gross Margin 98
- 6.7.3. Product portfolio 99
- 6.7.4. Recent initiatives 100
- 6.8. Coupa Software Inc. 100
- 6.8.1. Company Overview 100
- 6.8.2. Coupa Software Inc. Revenue and Gross Margin 100
- 6.8.3. Product portfolio 101
- 6.8.4. Recent initiatives 102
- 6.9. Zoho 102
- 6.9.1. Company Overview 102
- 6.9.2. Zoho Revenue and Gross Margin 102
- 6.9.3. Product portfolio 103
- 6.9.4. Recent initiatives 104
- 6.10. Intuit 104
- 6.10.1. Company Overview 104
- 6.10.2. Intuit Revenue and Gross Margin 104
- 6.10.3. Product portfolio 105
- 6.10.4. Recent initiatives 106
- 6.11. IPayables 106
- 6.11.1. Company Overview 106
- 6.11.2. IPayables Revenue and Gross Margin 106
- 6.11.3. Product portfolio 107
- 6.11.4. Recent initiatives 108
- 6.12. Xero 108
- 6.12.1. Company Overview 108
- 6.12.2. Xero Revenue and Gross Margin 108
- 6.12.3. Product portfolio 109
- 6.12.4. Recent initiatives 110
- 6.13. FinancialForce 110
- 6.13.1. Company Overview 110
- 6.13.2. FinancialForce Revenue and Gross Margin 110
- 6.13.3. Product portfolio 111
- 6.13.4. Recent initiatives 112
- 6.14. SAP 112
- 6.14.1. Company Overview 112
- 6.14.2. SAP Revenue and Gross Margin 112
- 6.14.3. Product portfolio 113
- 6.14.4. Recent initiatives 114
- 6.15. Acclivity Group LLC 114
- 6.15.1. Company Overview 114
- 6.15.2. Acclivity Group LLC Revenue and Gross Margin 114
- 6.15.3. Product portfolio 115
- 6.15.4. Recent initiatives 116
- 6.16. Norming Software 116
- 6.16.1. Company Overview 116
- 6.16.2. Norming Software Revenue and Gross Margin 116
- 6.16.3. Product portfolio 117
- 6.16.4. Recent initiatives 118
- 6.17. Brightpearl 118
- 6.17.1. Company Overview 118
- 6.17.2. Brightpearl Revenue and Gross Margin 118
- 6.17.3. Product portfolio 119
- 6.17.4. Recent initiatives 120
- 6.18. Sage 120
- 6.18.1. Company Overview 120
- 6.18.2. Sage Revenue and Gross Margin 120
- 6.18.3. Product portfolio 121
- 6.18.4. Recent initiatives 122
- 6.19. PaySimple 122
- 6.19.1. Company Overview 122
- 6.19.2. PaySimple Revenue and Gross Margin 122
- 6.19.3. Product portfolio 123
- 6.19.4. Recent initiatives 124
- Chapter 7. E-Invoicing — Industry Analysis 125
- 7.1. E-Invoicing Market – Key Trends 125
- 7.1.1. Market Drivers 126
- 7.1.2. Market Restraints 126
- 7.1.3. Market Opportunities 127
- 7.2. Value Chain Analysis 128
- 7.3. Technology Roadmap and Timeline 129
- 7.4. E-Invoicing Market – Attractiveness Analysis 130
- 7.4.1. By Type 130
- 7.4.2. By End-Users 130
- 7.4.3. By Region 132
- Chapter 8. Marketing Strategy Analysis, Distributors 133
- 8.1. Marketing Channel 133
- 8.2. Direct Marketing 134
- 8.3. Indirect Marketing 134
- 8.4. Marketing Channel Development Trend 134
- 8.5. Economic/Political Environmental Change 135
- Chapter 9. Report Conclusion 136
- Chapter 10. Research Approach & Methodology 137
- 10.1. Report Description 137
- 10.2. Research Scope 138
- 10.3. Research Methodology 138
- 10.3.1. Secondary Research 139
- 10.3.2. Primary Research 140
- 10.3.3. Models 141
- 10.3.3.1. Company Share Analysis Model 141
- 10.3.3.2. Revenue Based Modeling 142
- 10.3.3.3. Research Limitations 142
-
List of Figures
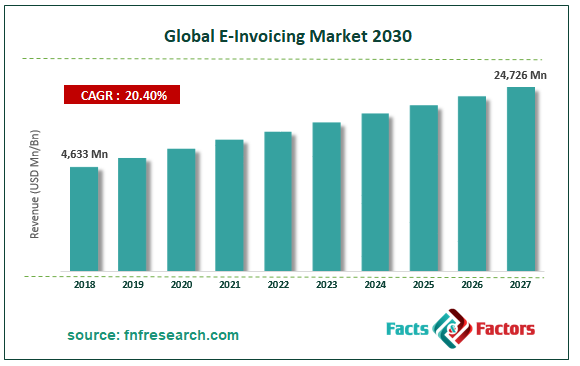
FIG. 1 Global E-Invoicing  Market, 2015-2027 (USD Million ) 23
FIG. 2 Global E-Invoicing  Market Share, by Type, 2018 & 2025 (USD Million ) 24
FIG. 3 Global Cloud-Based  E-Invoicing  Market, 2015-2027 (USD Million ) 25
FIG. 4 Global On-Premise E-Invoicing  Market, 2015-2027 (USD Million ) 26
FIG. 5 Global E-Invoicing  Market Share, by End-Users , 2018 & 2025 (USD Million ) 27
FIG. 6 Global Energy E-Invoicing  Market, 2015-2027 (USD Million ) 28
FIG. 7 Global FMCG E-Invoicing  Market, 2015-2027 (USD Million ) 29
FIG. 8 Global E-Commerce E-Invoicing  Market, 2015-2027 (USD Million ) 30
FIG. 9 Global Finance E-Invoicing  Market, 2015-2027 (USD Million ) 31
FIG. 10 Global Express Service E-Invoicing  Market, 2015-2027 (USD Million ) 32
FIG. 11 Global Others E-Invoicing  Market, 2015-2027 (USD Million ) 33
FIG. 12 Global E-Invoicing  Market Share, by Region, 2018 & 2025 34
FIG. 13 North America E-Invoicing  Market, 2015-2027 36
FIG. 14 U.S. E-Invoicing  Market, 2015-2027 40
FIG. 15 Canada E-Invoicing  Market, 2015-2027 41
FIG. 16 Mexico E-Invoicing  Market, 2015-2027 42
FIG. 17 Europe E-Invoicing  Market, 2015-2027 43
FIG. 18 Germany E-Invoicing  Market, 2015-2027 47
FIG. 19 France E-Invoicing  Market, 2015-2027 48
FIG. 20 U.K. E-Invoicing  Market, 2015-2027 49
FIG. 21 Italy E-Invoicing  Market, 2015-2027 50
FIG. 22 Spain E-Invoicing  Market, 2015-2027 51
FIG. 23 Nordic Countries E-Invoicing  Market, 2015-2027 52
FIG. 24 Benelux Union E-Invoicing  Market, 2015-2027 53
FIG. 25 Rest of Europe E-Invoicing  Market, 2015-2027 54
FIG. 26 Asia Pacific E-Invoicing  Market, 2015-2027 55
FIG. 27 China E-Invoicing  Market, 2015-2027 59
FIG. 28 Japan E-Invoicing  Market, 2015-2027 60
FIG. 29 India E-Invoicing  Market, 2015-2027 61
FIG. 30 New Zealand E-Invoicing  Market, 2015-2027 62
FIG. 31 Australia E-Invoicing  Market, 2015-2027 63
FIG. 32 South  Korea E-Invoicing  Market, 2015-2027 64
FIG. 33 South-East Asia E-Invoicing  Market, 2015-2027 65
FIG. 34 Rest of Asia Pacific E-Invoicing  Market, 2015-2027 66
FIG. 35 Latin America E-Invoicing  Market, 2015-2027 67
FIG. 36 Brazil E-Invoicing  Market, 2015-2027 71
FIG. 37 Argentina E-Invoicing  Market, 2015-2027 72
FIG. 38 Rest of Latin America E-Invoicing  Market, 2015-2027 73
FIG. 39 The Middle-East and Africa E-Invoicing  Market, 2015-2027 74
FIG. 40 Saudi Arabia E-Invoicing  Market, 2015-2027 78
FIG. 41 UAE E-Invoicing  Market, 2015-2027 79
FIG. 42 Egypt E-Invoicing  Market, 2015-2027 80
FIG. 43 Kuwait E-Invoicing  Market, 2015-2027 81
FIG. 44 South Africa E-Invoicing  Market, 2015-2027 82
FIG. 45 Rest of Middle-East Africa E-Invoicing  Market, 2015-2027 83
FIG. 46 Competitor Market Share – Revenue 84
FIG. 47 YAT Software Revenue and Growth Rate 89
FIG. 48 YAT Software Market Share 89
FIG. 49 Araize Inc. Revenue and Growth Rate 91
FIG. 50 Araize Inc. Market Share 91
FIG. 51 Tipalti Solutions Ltd. Revenue and Growth Rate 93
FIG. 52 Tipalti Solutions Ltd. Market Share 93
FIG. 53 Freshbooks Revenue and Growth Rate 95
FIG. 54 Freshbooks Market Share 95
FIG. 55 KashFlow Software Revenue and Growth Rate 97
FIG. 56 KashFlow Software Market Share 97
FIG. 57 Zervant Revenue and Growth Rate 99
FIG. 58 Zervant Market Share 99
FIG. 59 Mercury Systems Inc. Revenue and Growth Rate 101
FIG. 60 Mercury Systems Inc. Market Share 101
FIG. 61 Coupa Software Inc. Revenue and Growth Rate 103
FIG. 62 Coupa Software Inc. Market Share 103
FIG. 63 Zoho Revenue and Growth Rate 105
FIG. 64 Zoho Market Share 105
FIG. 65 Intuit Revenue and Growth Rate 107
FIG. 66 Intuit Market Share 107
FIG. 67 IPayables Revenue and Growth Rate 109
FIG. 68 IPayables Market Share 109
FIG. 69 Xero Revenue and Growth Rate 111
FIG. 70 Xero Market Share 111
FIG. 71 FinancialForce Revenue and Growth Rate 113
FIG. 72 FinancialForce Market Share 113
FIG. 73 SAP Revenue and Growth Rate 115
FIG. 74 SAP Market Share 115
FIG. 75 Acclivity Group LLC Revenue and Growth Rate 117
FIG. 76 Acclivity Group LLC Market Share 117
FIG. 77 Norming Software Revenue and Growth Rate 119
FIG. 78 Norming Software Market Share 119
FIG. 79 Brightpearl Revenue and Growth Rate 121
FIG. 80 Brightpearl Market Share 121
FIG. 81 Sage Revenue and Growth Rate 123
FIG. 82 Sage Market Share 123
FIG. 83 PaySimple Revenue and Growth Rate 125
FIG. 84 PaySimple Market Share 125
FIG. 85 Market Dynamics 127
FIG. 86 Global E-Invoicing  – Value Chain Analysis 130
FIG. 87 Technology Roadmap and Timeline 131
FIG. 88 Market Attractiveness Analysis – By Type 132
FIG. 89 Market Attractiveness Analysis – By End-Users 133
FIG. 90 Market Attractiveness Analysis – By Region 134
FIG. 91 Market Channel 135
FIG. 92 Marketing Channel Development Trend 136
FIG. 93 Growth in World Gross Product, 2008-2018 137
List of Tables
TABLE 1 Global E-Invoicing  Market, 2018 & 2025 (USD Million ) 22
TABLE 2 Global E-Invoicing  market, by Type, 2015-2027 (USD Million ) 24
TABLE 3 Global E-Invoicing  market, by End-Users , 2015-2027 (USD Million ) 27
TABLE 4 Global E-Invoicing  market, by Region, 2015-2027 (USD Million ) 34
TABLE 5 North America E-Invoicing  Market, by Type, 2015-2027 (USD Million ) 38
TABLE 6 North America E-Invoicing  Market, by End-Users , 2015-2027 (USD Million ) 39
TABLE 7 Europe E-Invoicing  Market, by Type, 2015-2027 (USD Million ) 45
TABLE 8 Europe E-Invoicing  Market, by End-Users , 2015-2027 (USD Million ) 46
TABLE 9 Asia Pacific E-Invoicing  Market, by Type, 2015-2027 (USD Million ) 57
TABLE 10 Asia Pacific E-Invoicing  Market, by End-Users , 2015-2027 (USD Million ) 58
TABLE 11 Latin America E-Invoicing  Market, by Type, 2015-2027 (USD Million ) 69
TABLE 12 Latin America E-Invoicing  Market, by End-Users , 2015-2027 (USD Million ) 70
TABLE 13 The Middle-East and Africa E-Invoicing  Market, by Type, 2015-2027 (USD Million ) 76
TABLE 14 The Middle-East and Africa E-Invoicing  Market, by End-Users , 2015-2027 (USD Million ) 77
TABLE 15 Global E-Invoicing  Market - Company Revenue Analysis 2015-2018 (USD Million ) 84
TABLE 16 Global E-Invoicing  Market - Company Revenue Share Analysis 2015-2018(%) 86
TABLE 17 Acquisitions and Mergers 87
TABLE 18 New Product/Service Launch 87
TABLE 19 Research & Development Activities 87
TABLE 20 Market Drivers 128
TABLE 21 Market Restraints 128
TABLE 22 Market Opportunities 129

 Report Scope

