Search Market Research Report

Discover Our Latest Reports
Discover Our Featured Reports
Discover Top Selling Reports

E-Grocery Market Size, Share Global Analysis Report, 2020–2026

report img

E-Grocery Market By End Users (Individuals, Organization (Small and Medium Enterprises, and Large Enterprises)); By Type (Indirect, and Direct); By Product Type (Food Grains, Bread, Bakery and Dairy Products, Fruits and Vegetables, Dry and Baking Products, Beverages, and Others); By Business Model (Delivery, and Takeaway); By Platform (Web Based, and App Based); By Purchase Type(One-time Purchase, and Subscription): North America Industry Outlook, Market Size, Business Intelligence, Consumer Preferences, Statistical Surveys, Comprehensive Analysis, Historical Developments, Current Trends, and Forecast 2020–2026

Industry Insights

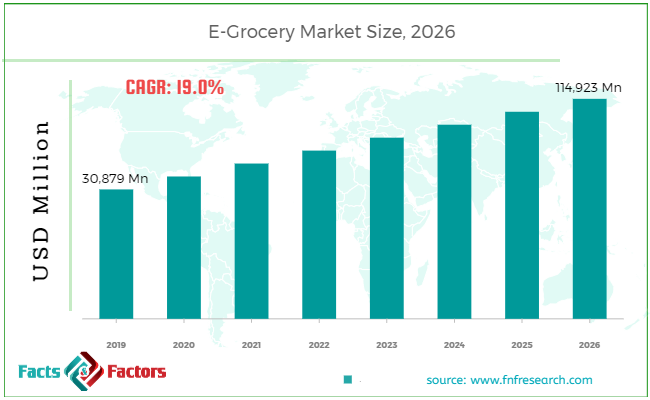
[220+ Pages Report] According to the report published by Facts Factors, the global e-grocery market size was worth around USD 30,879.1 million in 2019 and is predicted to grow to around USD 114,923.8 million  by 2026 with a compound annual growth rate (CAGR) of roughly 19.0% between 2020 and 2026. The report analyzes the global e-grocery market drivers, restraints/challenges, and the effect they have on the demands during the projection period. In addition, the report explores emerging opportunities in the e-grocery market.

E-Grocery Market Size

To know more about this report | Request Free Sample Copy

This specialized expertise oriented industry research report scrutinizes the technical and commercial business outlook of the e-grocery industry. The report analyzes and declares the historical and current trends analysis of the e-grocery industry and subsequently recommends the projected trends anticipated to be observed in the e-grocery market in the upcoming years.

The e-grocery market report analyzes and notifies the industry statistics at the regional and country levels in order to acquire a thorough perspective of the entire e-grocery market. The historical and past insights are provided for FY 2016 to FY 2019 whereas projected trends are delivered for FY 2020 to FY 2026. The quantitative and numerical data is represented in terms of both volumes (Units) and value (USD Million) from FY 2016 – 2026.


logoKey Insights from Primary Research        

  • As per our primary respondents, the e-Grocery market is set to grow annually at a CAGR rate of 19.0%. In 2019, the market is valued at around USD 30,879 Million and is expected to reach at around USD 114,925 Million by 2026.
  • On basis of end-user segment, ‘individual’ segment dominated the e-Grocery market in 2019. The individual segment is expected to be the fastest growing segment over the projected years and estimated to register USD 91,132.4 Million by 2026.
  • On basis of type segment, ‘indirect’ type dominated the e-Grocery market in 2019. This segment will grow at a CAGR rate of 20.9% over the forecast period. This segment generated is valued at around USD 16,126.0 Million in 2019 and expected to reach USD 73,814.5 Million by 2026.
  • On basis of product type segment, ‘bread, bakery and dairy products’ dominated the e-Grocery market in 2019. This segment will grow at a CAGR rate of 19.1% over the forecast period.
  • As per our primary respondents, United States region accounted the highest market share in the e-Grocery market in 2019. This segment generated revenues worth USD 29,402.7 Million in 2019 and expected to reach USD 110,434.9 Million by 2026

logoKey Recommendations from Analysts

  • As per our analysts, the e-Grocery market is expected to grow significantly over the forecast period.
  • As per analysts, the incorporation of new technologies such as voice enabled technologies in e-grocery is anticipated to accelerate the growth of the market during the forecast period.
  • The strategic and competitive advantage provided by digital payment methods is estimated to drive this market.
  • As per analysts, growth of e-commerce industry is contributing to the growth of the market.
  • Our team of analysts has identified that United States is expected to be the fastest growing country segment over the forecast period owing to its higher internet penetration coupled with growing awareness among the end-users regarding the grocery apps.

The quantitative data is further underlined and reinforced by comprehensive qualitative data which comprises various across-the-board market dynamics. The rationales which directly or indirectly impact the e-grocery industry are exemplified through parameters such as growth drivers, restraints, challenges, and opportunities among other impacting factors.

Throughout our research report, we have encompassed all the proven models and tools of industry analysis and extensively illustrated all the key business strategies and business models adopted in the e-grocery industry. The report provides an all-inclusive and detailed competitive landscape prevalent in the e-grocery market.

The report utilizes established industry analysis tools and models such as Porter’s Five Forces framework to analyze and recognize critical business strategies adopted by various stakeholders involved in the entire value chain of the e-grocery industry. The e-grocery market report additionally employs SWOT analysis and PESTLE analysis models for further in-depth analysis.

The report study further includes an in-depth analysis of industry players' market shares and provides an overview of leading players' market position in the e-grocery sector. Key strategic developments in the e-grocery market competitive landscape such as acquisitions & mergers, inaugurations of different products and services, partnerships & joint ventures, MoU agreements, VC & funding activities, R&D activities, and geographic expansion among other noteworthy activities by key players of the e-grocery market are appropriately highlighted in the report.

Penetration of internet had played a vital role in connecting people in various ways. The internet has greatly helped to shorten the gap between people and their prospects. Additionally, rapid urbanization has elevated the working population. They are more prone towards online grocery shopping due to their hectic schedules. Moreover, traditional grocery requires hours, to pay the bill in counters, while online grocery saves time. Therefore, consumer preference towards e-grocery owing to such factors is increasing the market demand in recent years. Although, online grocery looks promising when compared to other products available online but it faces rather different challenges such as lack of physical evidence and verification of the products. Furthermore, advances in technology and rise in omnichannel marketing and sales is expected to increase the market demand in upcoming years.

The e-grocery market research report delivers an acute valuation and taxonomy of the e-grocery industry by practically splitting the market on the basis of different types, applications, and regions. Through the analysis of the historical and projected trends, all the segments and sub-segments were evaluated through the bottom-up approach, and different market sizes have been projected for FY 2020 to FY 2026.

logoReport Scope

Report Attribute

Details

Market Size in 2019

USD 30,879.1 Million

Projected Market Size in 2026

USD 114,923.8 Million

CAGR Growth Rate

19.0% CAGR

Base Year

2019

Forecast Years

2020-2026

Key Market Players

7-Eleven, Inc., ALDI, Amazon.com, Inc., Beelivery, Fresh Direct, LLC., Google LLC, Instacart, Postmates Inc., Ahold Delhaize, Albertsons Companies, Target Corporation, Kroger Co., and Walmart among others.

Key Segment

By End Users, Type, Product, Business, Platform, Purchase, and Region

Major Regions Covered

North America, Europe, Asia Pacific, Latin America, and the Middle East & Africa

Purchase Options

Request customized purchase options to meet your research needs.Explore purchase options

The regional segmentation of the e-grocery industry includes the complete classification of all the major countries including U.S., Canada, and Mexico. E-grocery market has been segmented into end users, type, product type, business model, platform, purchase type, and region.  The end users segment has been classified into individuals, and organization. The organization has been categorized into large enterprises, small and medium enterprises in terms of the organization size.

Based on type, the market has been divided into indirect, and direct. Based on product type, the market has been segregated into food grains, bread, bakery and dairy products, fruits and vegetables, dry and baking products, and beverages among others. The business model is of two types that are delivery, and takeaway. On the basis of platform, the market has been segmented into web-based, and app-based. Furthermore, the purchase type has been bifurcated into one-time purchase, and subscription.

logoSome of the essential players operating in the e-grocery market, but not restricted to include

  •  7-Eleven Inc.
  •  ALDI
  •  Amazon.com Inc.
  •  Beelivery
  •  Fresh Direct LLC.
  •  Google LLC
  •  Instacart
  •  Postmates Inc.
  •  Ahold Delhaize
  •  Albertsons Companies
  •  Target Corporation
  •  Kroger Co.

This report segments the e-grocery market as follows:

logoBy End Users Segmentation Analysis

  • Individuals
  • Organization
    • Small and Medium Enterprises
    • Large Enterprises

logoBy Type Segmentation Analysis

  • Indirect
  • Direct

logoBy Product Type Segmentation Analysis

  • Food Grains
  • Bread, Bakery and Dairy Products
  • Fruits and Vegetables
  • Dry and Baking Products
  • Beverages
  • Others

logoBy Business Model Segmentation Analysis

  • Delivery
  • Takeaway

logoBy Platform Segmentation Analysis

  • Web Based
  • App Based

logoBy Purchase Type Segmentation Analysis

  • One-time Purchase
  • Subscription

logoBy Regional Segmentation Analysis

  • U.S.
  • Canada
  • Mexico

Table of Content

  1. Chapter 1 Executive Summary
    1. 1.1. Introduction of E-Grocery
    2. 1.2. North America E-Grocery Market, 2019 & 2026 (USD Million)
    3. 1.3. North America E-Grocery Market, 2016 – 2026 (USD Million)
    4. 1.4. North America E-Grocery Market Absolute Revenue Opportunity, 2016 – 2026 (USD Million)
    5. 1.5. North America E-Grocery Market Incremental Revenue Opportunity, 2020 – 2026 (USD Million)
  2. Chapter 2 E-Grocery Market – End Users Analysis
    1. 2.1. North America E-Grocery Market – End Users Overview
    2. 2.2. North America E-Grocery Market Share, by End Users, 2019 & 2026 (USD Million)
    3. 2.3. Individuals
      1. 2.3.1. North America Individuals E-Grocery Market, 2016 – 2026 (USD Million)
    4. 2.4. Organization
      1. 2.4.1. North America Organization E-Grocery Market, 2016 – 2026 (USD Million)
  3. Chapter 3 E-Grocery Market – Type Analysis
    1. 3.1. North America E-Grocery Market – Type Overview
    2. 3.2. North America E-Grocery Market Share, by Type, 2019 & 2026 (USD Million)
    3. 3.3. Indirect
      1. 3.3.1. North America Indirect E-Grocery Market, 2016 – 2026 (USD Million)
    4. 3.4. Direct
      1. 3.4.1. North America Direct E-Grocery Market, 2016 – 2026 (USD Million)
  4. Chapter 4 E-Grocery Market – Product Type Analysis
    1. 4.1. North America E-Grocery Market – Product Type Overview
    2. 4.2. North America E-Grocery Market Share, by Product Type, 2019 & 2026 (USD Million)
    3. 4.3. Food Grains
      1. 4.3.1. North America Food Grains E-Grocery Market, 2016 – 2026 (USD Million)
    4. 4.4. Bread, Bakery and Dairy Products
      1. 4.4.1. North America Bread, Bakery and Dairy Products E-Grocery Market, 2016 – 2026 (USD Million)
    5. 4.5. Fruits and Vegetables
      1. 4.5.1. North America Fruits and Vegetables E-Grocery Market, 2016 – 2026 (USD Million)
    6. 4.6. Dry and Baking Products
      1. 4.6.1. North America Dry and Baking Products E-Grocery Market, 2016 – 2026 (USD Million)
    7. 4.7. Beverages
      1. 4.7.1. North America Beverages E-Grocery Market, 2016 – 2026 (USD Million)
    8. 4.8. Others
      1. 4.8.1. North America Others E-Grocery Market, 2016 – 2026 (USD Million)
  5. Chapter 5 E-Grocery Market – Business Model Analysis
    1. 5.1. North America E-Grocery Market – Business Model Overview
    2. 5.2. North America E-Grocery Market Share, by Business Model, 2019 & 2026 (USD Million)
    3. 5.3. Delivery
      1. 5.3.1. North America Delivery E-Grocery Market, 2016 – 2026 (USD Million)
    4. 5.4. Takeaway
      1. 5.4.1. North America Takeaway E-Grocery Market, 2016 – 2026 (USD Million)
  6. Chapter 6 E-Grocery Market – Platform Analysis
    1. 6.1. North America E-Grocery Market – Platform Overview
    2. 6.2. North America E-Grocery Market Share, by Platform, 2019 & 2026 (USD Million)
    3. 6.3. Web Based
      1. 6.3.1. North America Web Based E-Grocery Market, 2016 – 2026 (USD Million)
    4. 6.4. App Based
      1. 6.4.1. North America App Based E-Grocery Market, 2016 – 2026 (USD Million)
  7. Chapter 7 E-Grocery Market – Purchase Type Analysis
    1. 7.1. North America E-Grocery Market – Purchase Type Overview
    2. 7.2. North America E-Grocery Market Share, by Purchase Type, 2019 & 2026 (USD Million)
    3. 7.3. One-time Purchase
      1. 7.3.1. North America One-time Purchase E-Grocery Market, 2016 – 2026 (USD Million)
    4. 7.4. Subscription
      1. 7.4.1. North America Subscription E-Grocery Market, 2016 – 2026 (USD Million)
  8. Chapter 8 E-Grocery Market – Regional Analysis
    1. 8.1.1. U.S.
      1. 8.1.1.1. U.S. E-Grocery Market, 2016 – 2026 (USD Million)
    2. 8.1.2. Canada
      1. 8.1.2.1. Canada E-Grocery Market, 2016 – 2026 (USD Million)
  • Chapter 9 E-Grocery Market – Competitive Landscape
    1. 9.1. Competitor Market Share – Revenue
    2. 9.2. Market Concentration Rate Analysis, Top 3 and Top 5 Players
    3. 9.3. Strategic Developments
      1. 9.3.1. Acquisitions and Mergers
      2. 9.3.2. New Products
      3. 9.3.3. Research & Development Activities
  • Chapter 10 Company Profiles
    1. 10.1. 7-Eleven, Inc.
      1. 10.1.1. Company Overview
      2. 10.1.2. Product/Service Portfolio
      3. 10.1.3. 7-Eleven, Inc. Sales, Revenue, and Gross Margin
      4. 10.1.4. 7-Eleven, Inc. Revenue and Growth Rate
      5. 10.1.5. 7-Eleven, Inc. Market Share
      6. 10.1.6. Recent Initiatives, Funding/VC Activities, and Technological Innovations
    2. 10.2. ALDI
      1. 10.2.1. Company Overview
      2. 10.2.2. Product/Service Portfolio
      3. 10.2.3. ALDI Sales, Revenue, and Gross Margin
      4. 10.2.4. ALDI Revenue and Growth Rate
      5. 10.2.5. ALDI Market Share
      6. 10.2.6. Recent Initiatives, Funding/VC Activities, and Technological Innovations
    3. 10.3. Amazon.com, Inc
      1. 10.3.1. Company Overview
      2. 10.3.2. Product/Service Portfolio
      3. 10.3.3. Amazon.com, Inc Sales, Revenue, and Gross Margin
      4. 10.3.4. Amazon.com, Inc Revenue and Growth Rate
      5. 10.3.5. Amazon.com, Inc Market Share
      6. 10.3.6. Recent Initiatives, Funding/VC Activities, and Technological Innovations
    4. 10.4. Beelivery
      1. 10.4.1. Company Overview
      2. 10.4.2. Product/Service Portfolio
      3. 10.4.3. Beelivery Sales, Revenue, and Gross Margin
      4. 10.4.4. Beelivery Revenue and Growth Rate
      5. 10.4.5. Beelivery Market Share
      6. 10.4.6. Recent Initiatives, Funding/VC Activities, and Technological Innovations
    5. 10.5. Fresh Direct, LLC.
      1. 10.5.1. Company Overview
      2. 10.5.2. Product/Service Portfolio
      3. 10.5.3. Fresh Direct, LLC. Sales, Revenue, and Gross Margin
      4. 10.5.4. Fresh Direct, LLC. Revenue and Growth Rate
      5. 10.5.5. Fresh Direct, LLC. Market Share
      6. 10.5.6. Recent Initiatives, Funding/VC Activities, and Technological Innovations
    6. 10.6. Google LLC
      1. 10.6.1. Company Overview
      2. 10.6.2. Product/Service Portfolio
      3. 10.6.3. Google LLC Sales, Revenue, and Gross Margin
      4. 10.6.4. Google LLC Revenue and Growth Rate
      5. 10.6.5. Google LLC Market Share
      6. 10.6.6. Recent Initiatives, Funding/VC Activities, and Technological Innovations
    7. 10.7. Instacart
      1. 10.7.1. Company Overview
      2. 10.7.2. Product/Service Portfolio
      3. 10.7.3. Instacart Sales, Revenue, and Gross Margin
      4. 10.7.4. Instacart Revenue and Growth Rate
      5. 10.7.5. Instacart Market Share
      6. 10.7.6. Recent Initiatives, Funding/VC Activities, and Technological Innovations
    8. 10.8. Maplebear Inc.
      1. 10.8.1. Company Overview
      2. 10.8.2. Product/Service Portfolio
      3. 10.8.3. Maplebear Inc. Sales, Revenue, and Gross Margin
      4. 10.8.4. Maplebear Inc. Revenue and Growth Rate
      5. 10.8.5. Maplebear Inc. Market Share
      6. 10.8.6. Recent Initiatives, Funding/VC Activities, and Technological Innovations
    9. 10.9. Ahold Delhaize
      1. 10.9.1. Company Overview
      2. 10.9.2. Product/Service Portfolio
      3. 10.9.3. Ahold Delhaize Sales, Revenue, and Gross Margin
      4. 10.9.4. Ahold Delhaize Revenue and Growth Rate
      5. 10.9.5. Ahold Delhaize Market Share
      6. 10.9.6. Recent Initiatives, Funding/VC Activities, and Technological Innovations
    10. 10.10. POSTMATES INC
      1. 10.10.1. Company Overview
      2. 10.10.2. Product/Service Portfolio
      3. 10.10.3. POSTMATES INC Sales, Revenue, and Gross Margin
      4. 10.10.4. POSTMATES INC Revenue and Growth Rate
      5. 10.10.5. POSTMATES INC Market Share
      6. 10.10.6. Recent Initiatives, Funding/VC Activities, and Technological Innovations
    11. 10.11. Albertsons Companies
      1. 10.11.1. Company Overview
      2. 10.11.2. Product/Service Portfolio
      3. 10.11.3. Albertsons Companies Sales, Revenue, and Gross Margin
      4. 10.11.4. Albertsons Companies Revenue and Growth Rate
      5. 10.11.5. Albertsons Companies Market Share
      6. 10.11.6. Recent Initiatives, Funding/VC Activities, and Technological Innovations
    12. 10.12. Target Brands, Inc.
      1. 10.12.1. Company Overview
      2. 10.12.2. Product/Service Portfolio
      3. 10.12.3. Target Brands, Inc. Sales, Revenue, and Gross Margin
      4. 10.12.4. Target Brands, Inc. Revenue and Growth Rate
      5. 10.12.5. Target Brands, Inc. Market Share
      6. 10.12.6. Recent Initiatives, Funding/VC Activities, and Technological Innovations
    13. 10.13. The Kroger Co
      1. 10.13.1. Company Overview
      2. 10.13.2. Product/Service Portfolio
      3. 10.13.3. The Kroger Co Sales, Revenue, and Gross Margin
      4. 10.13.4. The Kroger Co Revenue and Growth Rate
      5. 10.13.5. The Kroger Co Market Share
      6. 10.13.6. Recent Initiatives, Funding/VC Activities, and Technological Innovations
    14. 10.14. Walmart
      1. 10.14.1. Company Overview
      2. 10.14.2. Product/Service Portfolio
      3. 10.14.3. Walmart Sales, Revenue, and Gross Margin
      4. 10.14.4. Walmart Revenue and Growth Rate
      5. 10.14.5. Walmart Market Share
      6. 10.14.6. Recent Initiatives, Funding/VC Activities, and Technological Innovations
  • Chapter 11 E-Grocery — Industry Analysis
    1. 11.1. Introduction and Taxonomy
    2. 11.2. E-Grocery Market – Key Trends
      1. 11.2.1. Market Drivers
      2. 11.2.2. Market Restraints
      3. 11.2.3. Market Opportunities
    3. 11.3. Value Chain Analysis
    4. 11.4. Porter’s Five Forces Model
    5. 11.5. Analysis on Impact of Covid-19 on North America E-Grocery Market
    6. 11.6. Consumer Behavior Analysis
    7. 11.7. DMA Level
    8. 11.8. Key Mandates and Regulations
    9. 11.9. Technology Roadmap and Timeline
    10. 11.10. E-Grocery Market – Attractiveness Analysis
      1. 11.10.1. By End Users
      2. 11.10.2. By Type
      3. 11.10.3. By Product Type
      4. 11.10.4. By Business Model
      5. 11.10.5. By Platform
      6. 11.10.6. By Purchase Type
      7. 11.10.7. By Region
  • Chapter 12 Industrial Chain, Sourcing Strategy, and Downstream Buyers
    1. 12.1. E-Grocery Industrial Chain Analysis
    2. 12.2. Downstream Buyers
    3. 12.3. Distributors/Traders List
  • Chapter 13 Marketing Strategy Analysis
    1. 13.1. Marketing Channel
    2. 13.2. Direct Marketing
    3. 13.3. Indirect Marketing
    4. 13.4. Marketing Channel Development Trends
    5. 13.5. Economic/Political Environmental Change
  • Chapter 14 Report Conclusion & Key Insights
    1. 14.1. Key Insights from Primary Interviews & Surveys Respondents
    2. 14.2. Key Takeaways from Analysts, Consultants, and Industry Leaders
  • Chapter 15 Research Approach & Methodology
    1. 15.1. Report Description
    2. 15.2. Research Scope
    3. 15.3. Research Methodology
      1. 15.3.1. Secondary Research
      2. 15.3.2. Primary Research
      3. 15.3.3. Statistical Models
        1. 15.3.3.1. Company Share Analysis Model
        2. 15.3.3.2. Revenue Based Modeling
      4. 15.3.4. Research Limitations

      List of Figures

      Fig.1 Product Picture of E-Grocery
      Fig.2 North America E-Grocery Market, 2016 – 2026 (USD Million)
      Fig.3 North America E-Grocery Market Absolute Revenue Opportunity, 2016 – 2026 (USD Million)
      Fig.4 North America E-Grocery Market Incremental Revenue Opportunity, 2020 – 2026 (USD Million)
      Fig.5 North America E-Grocery Market Share, by End Users, 2019 & 2026 (USD Million)
      Fig.6 North America Individuals E-Grocery Market, 2016 – 2026 (USD Million)
      Fig.7 North America Organization E-Grocery Market, 2016 – 2026 (USD Million)
      Fig.8 North America E-Grocery Market Share, by Type, 2019 & 2026 (USD Million)
      Fig.9 North America Indirect E-Grocery Market, 2016 – 2026 (USD Million)
      Fig.10 North America Direct E-Grocery Market, 2016 – 2026 (USD Million)
      Fig.11 North America E-Grocery Market Share, by Product Type, 2019 & 2026 (USD Million)
      Fig.12 North America Food Grains E-Grocery Market, 2016 – 2026 (USD Million)
      Fig.13 North America Bread, Bakery and Dairy Products E-Grocery Market, 2016 – 2026 (USD Million)
      Fig.14 North America Fruits and Vegetables E-Grocery Market, 2016 – 2026 (USD Million)
      Fig.15 North America Dry and Baking Products E-Grocery Market, 2016 – 2026 (USD Million)
      Fig.16 North America Beverages E-Grocery Market, 2016 – 2026 (USD Million)
      Fig.17 North America Others E-Grocery Market, 2016 – 2026 (USD Million)
      Fig.18 North America E-Grocery Market Share, by Business Model, 2019 & 2026 (USD Million)
      Fig.19 North America Delivery E-Grocery Market, 2016 – 2026 (USD Million)
      Fig.20 North America Takeaway E-Grocery Market, 2016 – 2026 (USD Million)
      Fig.21 North America E-Grocery Market Share, by Platform, 2019 & 2026 (USD Million)
      Fig.22 North America Web Based E-Grocery Market, 2016 – 2026 (USD Million)
      Fig.23 North America App Based E-Grocery Market, 2016 – 2026 (USD Million)
      Fig.24 North America E-Grocery Market Share, by Purchase Type, 2019 & 2026 (USD Million)
      Fig.25 North America One-time Purchase E-Grocery Market, 2016 – 2026 (USD Million)
      Fig.26 North America Subscription E-Grocery Market, 2016 – 2026 (USD Million)
      Fig.27 U.S. E-Grocery Market, 2016 – 2026 (USD Million)
      Fig.28 Canada E-Grocery Market, 2016 – 2026 (USD Million)
      Fig.29 Competitor Market Share – Revenue
      Fig.30 7-Eleven, Inc. Revenue and Growth Rate
      Fig.31 7-Eleven, Inc. Market Share
      Fig.32 ALDI Revenue and Growth Rate
      Fig.33 ALDI Market Share
      Fig.34 Amazon.com, Inc Revenue and Growth Rate
      Fig.35 Amazon.com, Inc Market Share
      Fig.36 Beelivery Revenue and Growth Rate
      Fig.37 Beelivery Market Share
      Fig.38 Fresh Direct, LLC. Revenue and Growth Rate
      Fig.39 Fresh Direct, LLC. Market Share
      Fig.40 Google LLC Revenue and Growth Rate
      Fig.41 Google LLC Market Share
      Fig.42 Instacart Revenue and Growth Rate
      Fig.43 Instacart Market Share
      Fig.44 Maplebear Inc. Revenue and Growth Rate
      Fig.45 Maplebear Inc. Market Share
      Fig.46 Ahold Delhaize Revenue and Growth Rate
      Fig.47 Ahold Delhaize Market Share
      Fig.48 POSTMATES INC Revenue and Growth Rate
      Fig.49 POSTMATES INC Market Share
      Fig.50 Albertsons Companies Revenue and Growth Rate
      Fig.51 Albertsons Companies Market Share
      Fig.52 Target Brands, Inc. Revenue and Growth Rate
      Fig.53 Target Brands, Inc. Market Share
      Fig.54 The Kroger Co Revenue and Growth Rate
      Fig.55 The Kroger Co Market Share
      Fig.56 Walmart Revenue and Growth Rate
      Fig.57 Walmart Market Share
      Fig.58 Market Dynamics
      Fig.59 North America E-Grocery – Value Chain Analysis
      Fig.60 Key Mandates and Regulations
      Fig.61 Technology Roadmap and Timeline
      Fig.62 Market Attractiveness Analysis – By End Users
      Fig.63 Market Attractiveness Analysis – By Type
      Fig.64 Market Attractiveness Analysis – By Product Type
      Fig.65 Market Attractiveness Analysis – By Business Model
      Fig.66 Market Attractiveness Analysis – By Platform
      Fig.67 Market Attractiveness Analysis – By Purchase Type
      Fig.68 Market Attractiveness Analysis – By Region
      Fig.69 E-Grocery Industrial Chain Analysis
      Fig.70 Market Channels
      Fig.71 Marketing Channel Development Trend
      Fig.72 Growth in World Gross Product, 2008-2018

      List of Tables

      Table 1 North America E-Grocery Market, 2019 & 2026 (USD Million)
      Table 2 North America E-Grocery Market, by End Users, 2016 – 2026 (USD Million)
      Table 3 North America E-Grocery Market, by Type, 2016 – 2026 (USD Million)
      Table 4 North America E-Grocery Market, by Product Type, 2016 – 2026 (USD Million)
      Table 5 North America E-Grocery Market, by Business Model, 2016 – 2026 (USD Million)
      Table 6 North America E-Grocery Market, by Platform, 2016 – 2026 (USD Million)
      Table 7 North America E-Grocery Market, by Purchase Type, 2016 – 2026 (USD Million)
      Table 8 North America E-Grocery Market - Company Revenue Analysis, 2016 – 2019 (USD Million)
      Table 9 North America E-Grocery Market - Company Revenue Share Analysis, 2016 – 2019 (%)
      Table 10 Acquisitions and Mergers
      Table 11 Market Drivers – Impact Analysis
      Table 12 Market Restraints
      Table 13 Market Opportunities
      Table 14 Major Buyers of E-Grocery
      Table 15 Distributors/Traders of E-Grocery by Region
  • Industry Major Market Players

    •  7-Eleven Inc.
    •  ALDI
    •  Amazon.com Inc.
    •  Beelivery
    •  Fresh Direct LLC.
    •  Google LLC
    •  Instacart
    •  Postmates Inc.
    •  Ahold Delhaize
    •  Albertsons Companies
    •  Target Corporation
    •  Kroger Co.