Search Market Research Report

Discover Our Latest Reports
Discover Our Featured Reports
Discover Top Selling Reports

E-Compass Market Size, Share Global Analysis Report, 2020–2026

report img

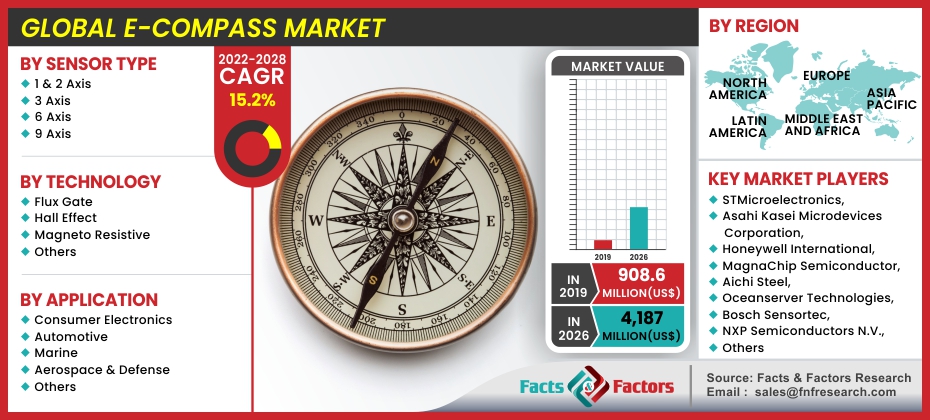
E-Compass Market By Sensor Type (1 & 2-axis, 3-axis, 6-axis, 9-axis), By Technology (Fluxgate, Hall-Effect, Magneto resistive, Others), By Application (Consumer Electronics, Aerospace & Defense, Automotive, Marine, Others): Global Industry Outlook, Market Size, Business Intelligence, Consumer Preferences, Statistical Surveys, Comprehensive Analysis, Historical Developments, Current Trends, and Forecast 2020–2026

Industry Insights

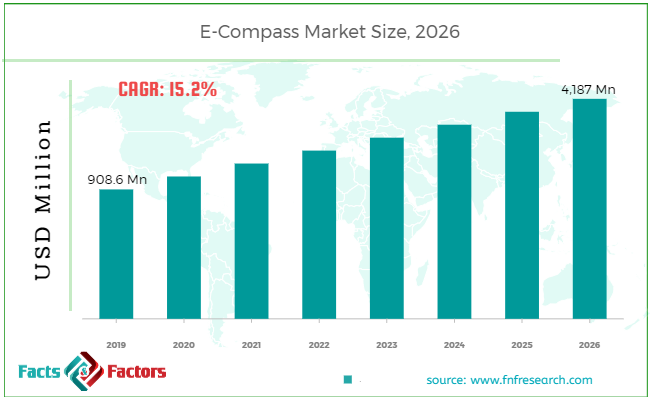
[190+ Pages Report] According to the report published by Facts Factors, the global e-compass market size was worth around USD 908.6 million in 2019 and is predicted to grow to around USD 4,187 million by 2026 with a compound annual growth rate (CAGR) of roughly 15.2% between 2020 and 2026. The report analyzes the global e-compass market drivers, restraints/challenges, and the effect they have on the demands during the projection period. In addition, the report explores emerging opportunities in the e-compass market.

E-Compass Market Size

To know more about this report | Request Free Sample Copy

This specialized and expertise oriented industry research report scrutinizes the technical and commercial business outlook of the e-compass industry. The report analyzes and declares the historical and current trends analysis of the e-compass industry and subsequently recommends the projected trends anticipated to be observed in the e-compass market during the upcoming years.


logoKey Insights from Primary Research        

  • As per our primary respondents, the global e-compass market is set to grow annually at a rate of around 15.2%, and the revenue was valued at around USD 908.6 million in 2019.
  • The Asia Pacific held the largest market share in 2019 due to the high volume of manufacturers from the consumer electronics sector in this region.
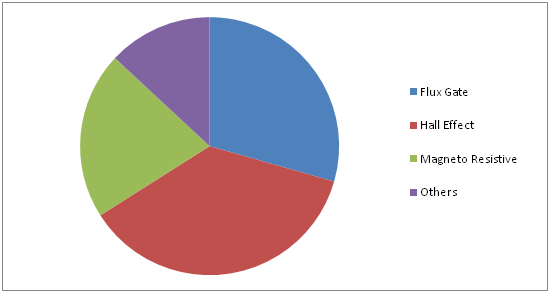
  • On basis of the “Technology” segment, the hall-effect segment dominated the global e-compass market as they are much economical in terms of cost as well as have been miniaturized in the form of ICs.
  • On basis of the “Sensor Type” segment, the 1 & 2 axis segment dominated the global e-compass market because it is widely used in aviation, defense industries.
  • The presence of well-established players has intensified the industry rivalry, due to which the degree of competition is considerably higher.

logoKey Recommendations from Analysts

  • As per our analysts, the global e-compass market is expected to grow significantly over the forecast period due to the rise in usage of E-compass in Uavs and Auvs.
  • As per analysts, the high growth in the consumer electronics sector is boosting the market.
  • The collaborations and partnerships between the manufacturing firms can create lucrative opportunities worldwide.
  • Our team of analysts has identified, that the Asia Pacific is expected to be the fastest-growing market over the estimated period, as the manufacturers of the consumer electronics industry is growing in the region.

logoGlobal E-Compass Market Revenue Share – By Technology

E-Compass Market

To know more about this report | Request Free Sample Copy


The e-compass market report analyzes and notifies the industry statistics at the global as well as regional and country levels in order to acquire a thorough perspective of the entire-compass market. The historical and past insights are provided for FY 2016 to FY 2019 whereas projected trends are delivered for FY 2020 to FY 2026. The quantitative and numerical data is represented in terms of value (USD Million) from FY 2016 – 2026.

The quantitative data is further underlined and reinforced by comprehensive qualitative data which comprises various across-the-board market dynamics. The rationales which directly or indirectly impact the e-compass industry are exemplified through parameters such as growth drivers, restraints, challenges, and opportunities among other impacting factors.

Throughout our research report, we have encompassed all the proven models and tools of industry analysis and extensively illustrated all the key business strategies and business models adopted in the e-compass industry. The report provides an all-inclusive and detailed competitive landscape prevalent in the e-compass market.

Global E-Compass Market

To know more about this report | Request Free Sample Copy

The report utilizes established industry analysis tools and models such as Porter’s Five Forces framework to analyze and recognize critical business strategies adopted by various stakeholders involved in the entire value chain of the e-compass industry. The e-compass market report additionally employs SWOT analysis and PESTLE analysis models for further in-depth analysis.

The report study further includes an in-depth analysis of industry players' market shares and provides an overview of leading players' market position in the e-compass sector. Key strategic developments in the e-compass market competitive landscape such as acquisitions & mergers, inaugurations of different products and services, partnerships & joint ventures, MoU agreements, VC & funding activities, R&D activities, and geographic expansion among other noteworthy activities by key players of the e-compass market are appropriately highlighted in the report.

The global e-compass market is experiencing significant growth that is expected to continue over the upcoming years. Also, the high demands for minerals globally will boost the global e-compass market. Also, the consumer electronics industry is growing widely such as tablets, smartphone’s, wearable devices which will further increase the demand for the e-compass market

The e-compass market research report delivers an acute valuation and taxonomy of the e-compass industry by practically splitting the market on the basis of different sensor types, technology, application, and regions. Through the analysis of the historical and projected trends, all the segments and sub-segments were evaluated through the bottom-up approach, and different market sizes have been projected for FY 2020 to FY 2026.

logoReport Scope

Report Attribute

Details

Market Size in 2019

USD 908.6 Million

Projected Market Size in 2026

USD 4,187 Million

CAGR Growth Rate

15.2% CAGR

Base Year

2019

Forecast Years

2020-2026

Key Market Players

STMicroelectronics, Asahi Kasei Microdevices Corporation, Honeywell International, MagnaChip Semiconductor, Aichi Steel, Oceanserver Technologies, Bosch Sensortec, NXP Semiconductors N.V., InvenSense, Inc., mCube Inc., TrueNorth Technologies, PNI Sensors Corporation among others.

Key Segment

By Sensor, Technology, Application, and Region

Major Regions Covered

North America, Europe, Asia Pacific, Latin America, and the Middle East & Africa

Purchase Options

Request customized purchase options to meet your research needs.Explore purchase options

The regional segmentation of the e-compass industry includes the complete classification of all the major continents including North America, Latin America, Europe, Asia Pacific, and the Middle East & Africa. Further, country-wise data for the e-compass industry is provided for the leading economies of the world.

The e-compass market is segmented based on sensor type, technology, application, and region. On the basis of sensor type, the market is classified into 1 &2 axis, 3 axis, 6 axis, and 9 axis. Based on technology, the market is bifurcated into flux gate, Hall Effect, magneto resistive, and others. Based on application, the market is classified into consumer electronics, aerospace & defense, marine, surveying, automotive, and others.

logoSome of the leading players in the global market include

  • STMicroelectronics
  • Asahi Kasei Microdevices Corporation
  • Honeywell International
  • MagnaChip Semiconductor
  • Aichi Steel
  • Oceanserver Technologies
  • Bosch Sensortec
  • NXP Semiconductors N.V.
  • InvenSense Inc.
  • mCube Inc.
  • TrueNorth Technologies
  • PNI Sensors Corporation 

The taxonomy of the e-compass market by its scope and segmentation is as follows:

logoBy Sensor Type Analysis

  • 1 & 2 Axis
  • 3 Axis
  • 6 Axis
  • 9 Axis

logoBy Technology Analysis

  • Flux Gate
  • Hall Effect
  • Magneto Resistive
  • Others

logoBy Application Analysis

  • Consumer Electronics
  • Automotive
  • Marine
  • Aerospace & Defense
  • Others

logoBy Regional Segmentation Analysis

  • North America
    • The U.S.
    • Canada
  • Europe
    • Germany
    • The UK
    • France
    • Spain
    • Italy
    • Rest of Europe
  • Asia Pacific
    • China
    • Japan
    • India
    • South Korea
    • Southeast Asia
    • Rest of Asia Pacific
  • Latin America
    • Brazil
    • Mexico
    • Rest of Latin America
  • Middle East & Africa
    • GCC
    • South Africa
    • Rest of Middle East & Africa

Table of Content

  1. Chapter 1 Executive Summary
    1. 1.1. Introduction of E-Compass
    2. 1.2. Global E-Compass Market, 2019 & 2026 (USD Million)
    3. 1.3. Global E-Compass Market, 2016 – 2026 (USD Million)
    4. 1.4. Global E-Compass Market Absolute Revenue Opportunity, 2016 – 2026 (USD Million)
    5. 1.5. Global E-Compass Market Incremental Revenue Opportunity, 2020 – 2026 (USD Million)
  2. Chapter 2 E-Compass Market – By Sensor Type Analysis
    1. 2.1. Global E-Compass Market – By Sensor Type Overview
    2. 2.2. Global E-Compass Market Share, By Sensor Type, 2019 & 2026 (USD Million)
    3. 2.3. 1 & 2-axis
      1. 2.3.1. Global 1 & 2-axis E-Compass Market, 2016 – 2026 (USD Million)
    4. 2.4. 3-axis
      1. 2.4.1. Global 3-axis E-Compass Market, 2016 – 2026 (USD Million)
    5. 2.5. 6-axis
      1. 2.5.1. Global 6-axis E-Compass Market, 2016 – 2026 (USD Million)
    6. 2.6. 9-axis
      1. 2.6.1. Global 9-axis E-Compass Market, 2016 – 2026 (USD Million)
  3. Chapter 3 E-Compass Market – By Technology Analysis
    1. 3.1. Global E-Compass Market – By Technology Overview
    2. 3.2. Global E-Compass Market Share, By Technology, 2019 & 2026 (USD Million)
    3. 3.3. Fluxgate
      1. 3.3.1. Global Fluxgate E-Compass Market, 2016 – 2026 (USD Million)
    4. 3.4. Hall-Effect
      1. 3.4.1. Global Hall-Effect E-Compass Market, 2016 – 2026 (USD Million)
    5. 3.5. Magneto Resistive
      1. 3.5.1. Global Magneto Resistive E-Compass Market, 2016 – 2026 (USD Million)
    6. 3.6. Others
      1. 3.6.1. Global Others E-Compass Market, 2016 – 2026 (USD Million)
  4. Chapter 4 E-Compass Market – By Application Analysis
    1. 4.1. Global E-Compass Market – By Application Overview
    2. 4.2. Global E-Compass Market Share, By Application, 2019 & 2026 (USD Million)
    3. 4.3. Consumer Electronics
      1. 4.3.1. Global Consumer Electronics E-Compass Market, 2016 – 2026 (USD Million)
    4. 4.4. Aerospace & Defense
      1. 4.4.1. Global Aerospace & Defense E-Compass Market, 2016 – 2026 (USD Million)
    5. 4.5. Automotive
      1. 4.5.1. Global Automotive E-Compass Market, 2016 – 2026 (USD Million)
    6. 4.6. Marine
      1. 4.6.1. Global Marine E-Compass Market, 2016 – 2026 (USD Million)
    7. 4.7. Surveying
      1. 4.7.1. Global Surveying E-Compass Market, 2016 – 2026 (USD Million)
    8. 4.8. Others
      1. 4.8.1. Global Others E-Compass Market, 2016 – 2026 (USD Million)
  5. Chapter 5 E-Compass Market – Regional Analysis
    1. 5.1. Global E-Compass Market Regional Overview
    2. 5.2. Global E-Compass Market Share, by Region, 2019 & 2026 (USD Million)
    3. 5.3. North America
      1. 5.3.1. North America E-Compass Market, 2016 – 2026 (USD Million)
        1. 5.3.1.1. North America E-Compass Market, by Country, 2016 - 2026 (USD Million)
      2. 5.3.2. North America E-Compass Market, By Sensor Type, 2016 – 2026
        1. 5.3.2.1. North America E-Compass Market, By Sensor Type, 2016 – 2026 (USD Million)
      3. 5.3.3. North America E-Compass Market, By Technology, 2016 – 2026
        1. 5.3.3.1. North America E-Compass Market, By Technology, 2016 – 2026 (USD Million)
      4. 5.3.4. North America E-Compass Market, By Application, 2016 – 2026
        1. 5.3.4.1. North America E-Compass Market, By Application, 2016 – 2026 (USD Million)
      5. 5.3.5. U.S.
        1. 5.3.5.1. U.S. E-Compass Market, 2016 – 2026 (USD Million)
      6. 5.3.6. Canada
        1. 5.3.6.1. Canada E-Compass Market, 2016 – 2026 (USD Million)
    4. 5.4. Europe
      1. 5.4.1. Europe E-Compass Market, 2016 – 2026 (USD Million)
        1. 5.4.1.1. Europe E-Compass Market, by Country, 2016 - 2026 (USD Million)
      2. 5.4.2. Europe E-Compass Market, By Sensor Type, 2016 – 2026
        1. 5.4.2.1. Europe E-Compass Market, By Sensor Type, 2016 – 2026 (USD Million)
      3. 5.4.3. Europe E-Compass Market, By Technology, 2016 – 2026
        1. 5.4.3.1. Europe E-Compass Market, By Technology, 2016 – 2026 (USD Million)
      4. 5.4.4. Europe E-Compass Market, By Application, 2016 – 2026
        1. 5.4.4.1. Europe E-Compass Market, By Application, 2016 – 2026 (USD Million)
      5. 5.4.5. Germany
        1. 5.4.5.1. Germany E-Compass Market, 2016 – 2026 (USD Million)
      6. 5.4.6. France
        1. 5.4.6.1. France E-Compass Market, 2016 – 2026 (USD Million)
      7. 5.4.7. U.K.
        1. 5.4.7.1. U.K. E-Compass Market, 2016 – 2026 (USD Million)
      8. 5.4.8. Italy
        1. 5.4.8.1. Italy E-Compass Market, 2016 – 2026 (USD Million)
      9. 5.4.9. Rest of Europe
        1. 5.4.9.1. Rest of Europe E-Compass Market, 2016 – 2026 (USD Million)
    5. 5.5. Asia Pacific
      1. 5.5.1. Asia Pacific E-Compass Market, 2016 – 2026 (USD Million)
        1. 5.5.1.1. Asia Pacific E-Compass Market, by Country, 2016 - 2026 (USD Million)
      2. 5.5.2. Asia Pacific E-Compass Market, By Sensor Type, 2016 – 2026
        1. 5.5.2.1. Asia Pacific E-Compass Market, By Sensor Type, 2016 – 2026 (USD Million)
      3. 5.5.3. Asia Pacific E-Compass Market, By Technology, 2016 – 2026
        1. 5.5.3.1. Asia Pacific E-Compass Market, By Technology, 2016 – 2026 (USD Million)
      4. 5.5.4. Asia Pacific E-Compass Market, By Application, 2016 – 2026
        1. 5.5.4.1. Asia Pacific E-Compass Market, By Application, 2016 – 2026 (USD Million)
      5. 5.5.5. China
        1. 5.5.5.1. China E-Compass Market, 2016 – 2026 (USD Million)
      6. 5.5.6. Japan
        1. 5.5.6.1. Japan E-Compass Market, 2016 – 2026 (USD Million)
      7. 5.5.7. India
        1. 5.5.7.1. India E-Compass Market, 2016 – 2026 (USD Million)
      8. 5.5.8. South Korea
        1. 5.5.8.1. South Korea E-Compass Market, 2016 – 2026 (USD Million)
      9. 5.5.9. Rest of Asia Pacific
        1. 5.5.9.1. Rest of Asia Pacific E-Compass Market, 2016 – 2026 (USD Million)
    6. 5.6. Latin America
      1. 5.6.1. Latin America E-Compass Market, 2016 – 2026 (USD Million)
        1. 5.6.1.1. Latin America E-Compass Market, by Country, 2016 - 2026 (USD Million)
      2. 5.6.2. Latin America E-Compass Market, By Sensor Type, 2016 – 2026
        1. 5.6.2.1. Latin America E-Compass Market, By Sensor Type, 2016 – 2026 (USD Million)
      3. 5.6.3. Latin America E-Compass Market, By Technology, 2016 – 2026
        1. 5.6.3.1. Latin America E-Compass Market, By Technology, 2016 – 2026 (USD Million)
      4. 5.6.4. Latin America E-Compass Market, By Application, 2016 – 2026
        1. 5.6.4.1. Latin America E-Compass Market, By Application, 2016 – 2026 (USD Million)
      5. 5.6.5. Brazil
        1. 5.6.5.1. Brazil E-Compass Market, 2016 – 2026 (USD Million)
      6. 5.6.6. Mexico
        1. 5.6.6.1. Mexico E-Compass Market, 2016 – 2026 (USD Million)
      7. 5.6.7. Rest of Latin America
        1. 5.6.7.1. Rest of Latin America E-Compass Market, 2016 – 2026 (USD Million)
    7. 5.7. The Middle-East and Africa
      1. 5.7.1. The Middle-East and Africa E-Compass Market, 2016 – 2026 (USD Million)
        1. 5.7.1.1. The Middle-East and Africa E-Compass Market, by Country, 2016 - 2026 (USD Million)
      2. 5.7.2. The Middle-East and Africa E-Compass Market, By Sensor Type, 2016 – 2026
        1. 5.7.2.1. The Middle-East and Africa E-Compass Market, By Sensor Type, 2016 – 2026 (USD Million)
      3. 5.7.3. The Middle-East and Africa E-Compass Market, By Technology, 2016 – 2026
        1. 5.7.3.1. The Middle-East and Africa E-Compass Market, By Technology, 2016 – 2026 (USD Million)
      4. 5.7.4. The Middle-East and Africa E-Compass Market, By Application, 2016 – 2026
        1. 5.7.4.1. The Middle-East and Africa E-Compass Market, By Application, 2016 – 2026 (USD Million)
      5. 5.7.5. GCC Countries
        1. 5.7.5.1. GCC Countries E-Compass Market, 2016 – 2026 (USD Million)
      6. 5.7.6. South Africa
        1. 5.7.6.1. South Africa E-Compass Market, 2016 – 2026 (USD Million)
      7. 5.7.7. Rest of Middle-East Africa
        1. 5.7.7.1. Rest of Middle-East Africa E-Compass Market, 2016 – 2026 (USD Million)
  6. Chapter 6 E-Compass Market – Competitive Landscape
    1. 6.1. Competitor Market Share – Revenue
    2. 6.2. Market Concentration Rate Analysis, Top 3 and Top 5 Players
    3. 6.3. Strategic Developments
      1. 6.3.1. Acquisitions and Mergers
      2. 6.3.2. New Products
      3. 6.3.3. Research & Development Activities
  7. Chapter 7 Company Profiles
    1. 7.1. STMicroelectronics
      1. 7.1.1. Company Overview
      2. 7.1.2. Product/Service Portfolio
      3. 7.1.3. STMicroelectronics Sales, Revenue, and Gross Margin
      4. 7.1.4. STMicroelectronics Revenue and Growth Rate
      5. 7.1.5. STMicroelectronics Market Share
      6. 7.1.6. Recent Initiatives, Funding/VC Activities, and Technological Innovations
    2. 7.2. Honeywell International
      1. 7.2.1. Company Overview
      2. 7.2.2. Product/Service Portfolio
      3. 7.2.3. Honeywell International Sales, Revenue, and Gross Margin
      4. 7.2.4. Honeywell International Revenue and Growth Rate
      5. 7.2.5. Honeywell International Market Share
      6. 7.2.6. Recent Initiatives, Funding/VC Activities, and Technological Innovations
    3. 7.3. Aichi Steel
      1. 7.3.1. Company Overview
      2. 7.3.2. Product/Service Portfolio
      3. 7.3.3. Aichi Steel Sales, Revenue, and Gross Margin
      4. 7.3.4. Aichi Steel Revenue and Growth Rate
      5. 7.3.5. Aichi Steel Market Share
      6. 7.3.6. Recent Initiatives, Funding/VC Activities, and Technological Innovations
    4. 7.4. Bosch Sensortec
      1. 7.4.1. Company Overview
      2. 7.4.2. Product/Service Portfolio
      3. 7.4.3. Bosch Sensortec Sales, Revenue, and Gross Margin
      4. 7.4.4. Bosch Sensortec Revenue and Growth Rate
      5. 7.4.5. Bosch Sensortec Market Share
      6. 7.4.6. Recent Initiatives, Funding/VC Activities, and Technological Innovations
    5. 7.5. ST Microelectronics
      1. 7.5.1. Company Overview
      2. 7.5.2. Product/Service Portfolio
      3. 7.5.3. ST Microelectronics Sales, Revenue, and Gross Margin
      4. 7.5.4. ST Microelectronics Revenue and Growth Rate
      5. 7.5.5. ST Microelectronics Market Share
      6. 7.5.6. Recent Initiatives, Funding/VC Activities, and Technological Innovations
    6. 7.6. InvenSense, Inc.
      1. 7.6.1. Company Overview
      2. 7.6.2. Product/Service Portfolio
      3. 7.6.3. InvenSense, Inc. Sales, Revenue, and Gross Margin
      4. 7.6.4. InvenSense, Inc. Revenue and Growth Rate
      5. 7.6.5. InvenSense, Inc. Market Share
      6. 7.6.6. Recent Initiatives, Funding/VC Activities, and Technological Innovations
    7. 7.7. TrueNorth Technologies
      1. 7.7.1. Company Overview
      2. 7.7.2. Product/Service Portfolio
      3. 7.7.3. TrueNorth Technologies Sales, Revenue, and Gross Margin
      4. 7.7.4. TrueNorth Technologies Revenue and Growth Rate
      5. 7.7.5. TrueNorth Technologies Market Share
      6. 7.7.6. Recent Initiatives, Funding/VC Activities, and Technological Innovations
    8. 7.8. PNI Sensors Corporation
      1. 7.8.1. Company Overview
      2. 7.8.2. Product/Service Portfolio
      3. 7.8.3. PNI Sensors Corporation Sales, Revenue, and Gross Margin
      4. 7.8.4. PNI Sensors Corporation Revenue and Growth Rate
      5. 7.8.5. PNI Sensors Corporation Market Share
      6. 7.8.6. Recent Initiatives, Funding/VC Activities, and Technological Innovations
  8. Chapter 8 E-Compass — Industry Analysis
    1. 8.1. Introduction and Taxonomy
    2. 8.2. E-Compass Market – Key Trends
      1. 8.2.1. Market Drivers
      2. 8.2.2. Market Restraints
      3. 8.2.3. Market Opportunities
    3. 8.3. Value Chain Analysis
    4. 8.4. Key Mandates and Regulations
    5. 8.5. Technology Roadmap and Timeline
    6. 8.6. E-Compass Market – Attractiveness Analysis
      1. 8.6.1. By Sensor Type
      2. 8.6.2. By Technology
      3. 8.6.3. By Application
      4. 8.6.4. By Region
  9. Chapter 9 Industrial Chain, Sourcing Strategy, and Downstream Buyers
    1. 9.1. E-Compass Industrial Chain Analysis
    2. 9.2. Downstream Buyers
    3. 9.3. Distributors/Traders List
  10. Chapter 10 Marketing Strategy Analysis
    1. 10.1. Marketing Channel
    2. 10.2. Direct Marketing
    3. 10.3. Indirect Marketing
    4. 10.4. Marketing Channel Development Trends
    5. 10.5. Economic/Political Environmental Change
  11. Chapter 11 Report Conclusion & Key Insights
    1. 11.1. Key Insights from Primary Interviews & Surveys Respondents
    2. 11.2. Key Takeaways from Analysts, Consultants, and Industry Leaders
  12. Chapter 12 Research Approach & Methodology
    1. 12.1. Report Description
    2. 12.2. Research Scope
    3. 12.3. Research Methodology
      1. 12.3.1. Secondary Research
      2. 12.3.2. Primary Research
      3. 12.3.3. Statistical Models
        1. 12.3.3.1. Company Share Analysis Model
        2. 12.3.3.2. Revenue Based Modeling
      4. 12.3.4. Research Limitations

      List of Figures

      Fig.1 Product Picture of E-Compass
      Fig.2 Global E-Compass Market, 2016 – 2026 (USD Million)
      Fig.3 Global E-Compass Market Absolute Revenue Opportunity, 2016 – 2026 (USD Million)
      Fig.4 Global E-Compass Market Incremental Revenue Opportunity, 2020 – 2026 (USD Million)
      Fig.5 Global E-Compass Market Share, By Sensor Type, 2019 & 2026 (USD Million)
      Fig.6 Global 1 & 2-axis E-Compass Market, 2016 – 2026 (USD Million)
      Fig.7 Global 3-axis E-Compass Market, 2016 – 2026 (USD Million)
      Fig.8 Global 6-axis E-Compass Market, 2016 – 2026 (USD Million)
      Fig.9 Global 9-axis E-Compass Market, 2016 – 2026 (USD Million)
      Fig.10 Global E-Compass Market Share, By Technology, 2019 & 2026 (USD Million)
      Fig.11 Global Fluxgate E-Compass Market, 2016 – 2026 (USD Million)
      Fig.12 Global Hall-Effect E-Compass Market, 2016 – 2026 (USD Million)
      Fig.13 Global Magneto Resistive E-Compass Market, 2016 – 2026 (USD Million)
      Fig.14 Global Others E-Compass Market, 2016 – 2026 (USD Million)
      Fig.15 Global E-Compass Market Share, By Application, 2019 & 2026 (USD Million)
      Fig.16 Global Consumer Electronics E-Compass Market, 2016 – 2026 (USD Million)
      Fig.17 Global Aerospace & Defense E-Compass Market, 2016 – 2026 (USD Million)
      Fig.18 Global Automotive E-Compass Market, 2016 – 2026 (USD Million)
      Fig.19 Global Marine E-Compass Market, 2016 – 2026 (USD Million)
      Fig.20 Global Surveying E-Compass Market, 2016 – 2026 (USD Million)
      Fig.21 Global Others E-Compass Market, 2016 – 2026 (USD Million)
      Fig.22 Global E-Compass Market Share, by Region, 2019 & 2026 (USD Million)
      Fig.23 North America E-Compass Market, 2016 – 2026 (USD Million)
      Fig.24 U.S. E-Compass Market, 2016 – 2026 (USD Million)
      Fig.25 Canada E-Compass Market, 2016 – 2026 (USD Million)
      Fig.26 Europe E-Compass Market, 2016 – 2026 (USD Million)
      Fig.27 Germany E-Compass Market, 2016 – 2026 (USD Million)
      Fig.28 France E-Compass Market, 2016 – 2026 (USD Million)
      Fig.29 U.K. E-Compass Market, 2016 – 2026 (USD Million)
      Fig.30 Italy E-Compass Market, 2016 – 2026 (USD Million)
      Fig.31 Rest of Europe E-Compass Market, 2016 – 2026 (USD Million)
      Fig.32 Asia Pacific E-Compass Market, 2016 – 2026 (USD Million)
      Fig.33 China E-Compass Market, 2016 – 2026 (USD Million)
      Fig.34 Japan E-Compass Market, 2016 – 2026 (USD Million)
      Fig.35 India E-Compass Market, 2016 – 2026 (USD Million)
      Fig.36 South  Korea E-Compass Market, 2016 – 2026 (USD Million)
      Fig.37 Rest of Asia Pacific E-Compass Market, 2016 – 2026 (USD Million)
      Fig.38 Latin America E-Compass Market, 2016 – 2026 (USD Million)
      Fig.39 Brazil E-Compass Market, 2016 – 2026 (USD Million)
      Fig.40 Mexico E-Compass Market, 2016 – 2026 (USD Million)
      Fig.41 Rest of Latin America E-Compass Market, 2016 – 2026 (USD Million)
      Fig.42 The Middle-East and Africa E-Compass Market, 2016 – 2026 (USD Million)
      Fig.43 GCC Countries E-Compass Market, 2016 – 2026 (USD Million)
      Fig.44 South Africa E-Compass Market, 2016 – 2026 (USD Million)
      Fig.45 Rest of Middle-East Africa E-Compass Market, 2016 – 2026 (USD Million)
      Fig.46 Competitor Market Share – Revenue
      Fig.47 STMicroelectronics Revenue and Growth Rate
      Fig.48 STMicroelectronics Market Share
      Fig.49 Honeywell International Revenue and Growth Rate
      Fig.50 Honeywell International Market Share
      Fig.51 Aichi Steel Revenue and Growth Rate
      Fig.52 Aichi Steel Market Share
      Fig.53 Bosch Sensortec Revenue and Growth Rate
      Fig.54 Bosch Sensortec Market Share
      Fig.55 ST Microelectronics Revenue and Growth Rate
      Fig.56 ST Microelectronics Market Share
      Fig.57 InvenSense, Inc. Revenue and Growth Rate
      Fig.58 InvenSense, Inc. Market Share
      Fig.59 TrueNorth Technologies Revenue and Growth Rate
      Fig.60 TrueNorth Technologies Market Share
      Fig.61 PNI Sensors Corporation Revenue and Growth Rate
      Fig.62 PNI Sensors Corporation Market Share
      Fig.63 Market Dynamics
      Fig.64 Global E-Compass – Value Chain Analysis
      Fig.65 Key Mandates and Regulations
      Fig.66 Technology Roadmap and Timeline
      Fig.67 Market Attractiveness Analysis – By Sensor Type
      Fig.68 Market Attractiveness Analysis – By Technology
      Fig.69 Market Attractiveness Analysis – By Application
      Fig.70 Market Attractiveness Analysis – By Region
      Fig.71 E-Compass Industrial Chain Analysis
      Fig.72 Market Channels
      Fig.73 Marketing Channel Development Trend
      Fig.74 Growth in World Gross Product, 2008-2018
      

      List of Tables

      Table 1 Global E-Compass Market, 2019 & 2026 (USD Million)
      Table 2 Global E-Compass Market, By Sensor Type, 2016 – 2026 (USD Million)
      Table 3 Global E-Compass Market, By Technology, 2016 – 2026 (USD Million)
      Table 4 Global E-Compass Market, By Application, 2016 – 2026 (USD Million)
      Table 5 Global E-Compass Market, by Region, 2016 – 2026 (USD Million)
      Table 6 North America E-Compass Market, by Country, 2016 – 2026 (USD Million)
      Table 7 North America E-Compass Market, By Sensor Type, 2016 – 2026 (USD Million)
      Table 8 North America E-Compass Market, By Technology, 2016 – 2026 (USD Million)
      Table 9 North America E-Compass Market, By Application, 2016 – 2026 (USD Million)
      Table 10 Europe E-Compass Market, by Country, 2016 – 2026 (USD Million)
      Table 11 Europe E-Compass Market, By Sensor Type, 2016 – 2026 (USD Million)
      Table 12 Europe E-Compass Market, By Technology, 2016 – 2026 (USD Million)
      Table 13 Europe E-Compass Market, By Application, 2016 – 2026 (USD Million)
      Table 14 Asia Pacific E-Compass Market, by Country, 2016 – 2026 (USD Million)
      Table 15 Asia Pacific E-Compass Market, By Sensor Type, 2016 – 2026 (USD Million)
      Table 16 Asia Pacific E-Compass Market, By Technology, 2016 – 2026 (USD Million)
      Table 17 Asia Pacific E-Compass Market, By Application, 2016 – 2026 (USD Million)
      Table 18 Latin America E-Compass Market, by Country, 2016 – 2026 (USD Million)
      Table 19 Latin America E-Compass Market, By Sensor Type, 2016 – 2026 (USD Million)
      Table 20 Latin America E-Compass Market, By Technology, 2016 – 2026 (USD Million)
      Table 21 Latin America E-Compass Market, By Application, 2016 – 2026 (USD Million)
      Table 22 The Middle-East and Africa E-Compass Market, by Country, 2016 – 2026 (USD Million)
      Table 23 The Middle-East and Africa E-Compass Market, By Sensor Type, 2016 – 2026 (USD Million)
      Table 24 The Middle-East and Africa E-Compass Market, By Technology, 2016 – 2026 (USD Million)
      Table 25 The Middle-East and Africa E-Compass Market, By Application, 2016 – 2026 (USD Million)
      Table 26 Global E-Compass Market - Company Revenue Analysis, 2016 – 2019 (USD Million)
      Table 27 Global E-Compass Market - Company Revenue Share Analysis, 2016 – 2019 (%)
      Table 28 Acquisitions and Mergers
      Table 29 Market Drivers – Impact Analysis
      Table 30 Market Restraints
      Table 31 Market Opportunities
      Table 32 Major Buyers of E-Compass
      Table 33 Distributors/Traders of E-Compass by Region
      

Industry Major Market Players

  • STMicroelectronics
  • Asahi Kasei Microdevices Corporation
  • Honeywell International
  • MagnaChip Semiconductor
  • Aichi Steel
  • Oceanserver Technologies
  • Bosch Sensortec
  • NXP Semiconductors N.V.
  • InvenSense Inc.
  • mCube Inc.
  • TrueNorth Technologies
  • PNI Sensors Corporation