Search Market Research Report

Discover Our Latest Reports
Discover Our Featured Reports
Discover Top Selling Reports

E-Bike Sharing Market Size, Share Global Analysis Report, 2020–2026

report img

E-Bike Sharing Market By Type (Public Organization & Government, Private Company) and By Industry (Internal Use, and Public Use): Global Industry Outlook, Market Size, Business Intelligence, Consumer Preferences, Statistical Surveys, Comprehensive Analysis, Historical Developments, Current Trends, and Forecast 2020–2026

Industry Insights

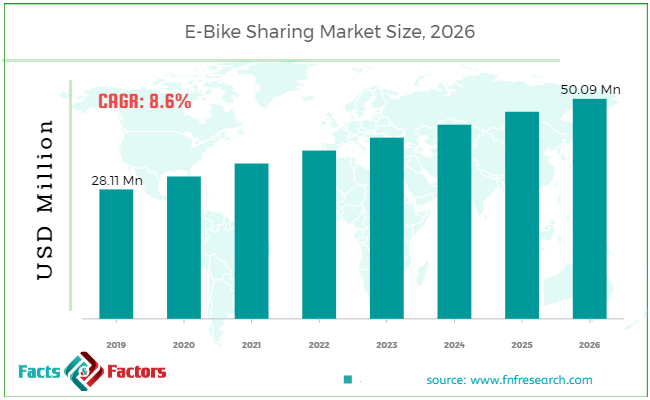
[180+ Pages Report] According to the report published by Facts Factors, the global e-bike sharing market size was worth around 28.11 million in 2019 and is predicted to grow to around USD 50.09 million by 2026 with a compound annual growth rate (CAGR) of roughly 8.6% between 2020 and 2026. The report analyzes the global e-bike sharing market drivers, restraints/challenges, and the effect they have on the demands during the projection period. In addition, the report explores emerging opportunities in the e-bike sharing market.

E-Bike Sharing Market Size

To know more about this report | Request Free Sample Copy

This specialized and expertise oriented industry research report scrutinizes the technical and commercial business outlook of the e-bike sharing industry. The report analyzes and declares the historical and current trends analysis of the e-bike sharing industry and subsequently recommends the projected trends anticipated to be observed in the e-bike sharing market during the upcoming years.

The e-bike sharing market report analyzes and notifies the industry statistics at the global as well as regional and country levels in order to acquire a thorough perspective of the entire e-bike sharing market. The historical and past insights are provided for FY 2016 to FY 2019 whereas projected trends are delivered for FY 2020 to FY 2026. The quantitative and numerical data is represented in terms of both volume (Units) and value (USD Million) from FY 2016 – 2026.


logoKey Insights from Primary Research

  • As per our primary respondents, the global e-bike sharing market is set to grow annually at a rate of around 8.6%
  • It was established through primary research that the e-bike sharing market was valued at around USD 28.11 Million in 2019.
  • Asia Pacific region is presently dominating the market among all the regions and is further expected to maintain its position throughout the forecast period.
  • On basis of industry segment, ‘public’ segment dominated the global e-bike sharing market in 2019.
  • North America & Europe will contribute in the e-bike sharing market in future years ahead as in these regions; bike sharing providers are replacing their bikes with e-bike.

logoKey Recommendations from Analysts

  • As per our analysts, the global e-bike sharing market is expected to reach around USD 50 Million by 2026.
  • The strategic and competitive advantage provided by the e-bikes is anticipated to increase the market demand in upcoming years.
  • Our team of analysts has identified, that growing environment concerns is propelling the market growth over the past few years.
  • The team has analyzed that the industry is in nascent stage, and it will grow in future years rapidly.
  • Our team of analysts has identified that increasing investment in R&D for improving battery performance and bicycle structure will increase the market demand for e-bike over the forecast period.

The quantitative data is further underlined and reinforced by comprehensive qualitative data which comprises various across-the-board market dynamics. The rationales which directly or indirectly impact the e-bike sharing industry are exemplified through parameters such as growth drivers, restraints, challenges, and opportunities among other impacting factors.

Throughout our research report, we have encompassed all the proven models and tools of industry analysis and extensively illustrated all the key business strategies and business models adopted in the e-bike sharing industry. The report provides an all-inclusive and detailed competitive landscape prevalent in the e-bike sharing market.

The report utilizes established industry analysis tools and models such as Porter’s Five Forces framework to analyze and recognize critical business strategies adopted by various stakeholders involved in the entire value chain of the e-bike sharing industry. The e-bike sharing market report additionally employs SWOT analysis and PESTLE analysis models for further in-depth analysis.

The report study further includes an in-depth analysis of industry players' market shares and provides an overview of leading players' market position in the E-Bike Sharing sector. Key strategic developments in the e-bike sharing market competitive landscape such as acquisitions & mergers, inaugurations of different products and services, partnerships & joint ventures, MoU agreements, VC & funding activities, R&D activities, and geographic expansion among other noteworthy activities by key players of the e-bike sharing market are appropriately highlighted in the report.

The demand for e-bikes is increasing owing to its flexible operations and zero carbon emissions. Moreover, high fuel prices across the globe are making individual to incline towards vehicle sharing as it is cost effective transport solution. In addition, enterprises are heavily investing in R & D activities to enhance overall vehicle performance. Furthermore, due to heavy traffic congestion people are adopting for convenient travel facilities. , Thereby, certain factors are responsible for the growth of the market. In North America and Europe, bike sharing enterprises are replacing conventional bikes with e-bikes to users. Thereby, it is anticipated that in the next few years the market size for e-bike sharing will rapidly grow.

The e-bike sharing market research report delivers an acute valuation and taxonomy of the e-bike sharing industry by practically splitting the market on the basis of different types, applications, and regions. Through the analysis of the historical and projected trends, all the segments and sub-segments were evaluated through the bottom-up approach, and different market sizes have been projected for FY 2020 to FY 2026. The regional segmentation of the e-bike sharing industry includes the complete classification of all the major continents including North America, Latin America, Europe, Asia Pacific, and Middle East & Africa. Further, country-wise data for the e-bike sharing industry is provided for the leading economies of the world.

The e-bike sharing market is segmented based on type and industry. On the basis of type segmentation, the market is classified into public organization & government, private company. In terms of industry segment, the market is bifurcated into internal use, and public use.

logoReport Scope

Report Attribute

Details

Market Size in 2019

USD 28.11 Million

Projected Market Size in 2026

USD 50.09 Million

CAGR Growth Rate

8.6% CAGR

Base Year

2019

Forecast Years

2019-2026

Key Market Players

Pedego Electric Bikes, Bikeplus, Ofo, Hellobike, Lime Bike, BikeMi, Obike, Mango, Co-bikes, Bonopark, Citi Bike, Journey Matters, Mobike, Zoomcar, and Gobike among others.

Key Segment

By Type, By Industry, By Region

Major Regions Covered

North America, Europe, Asia Pacific, Latin America, and the Middle East & Africa

Purchase Options

Request customized purchase options to meet your research needs. Explore purchase options

logoSome of the leading players in the global market include

  • Pedego Electric Bikes
  • Bikeplus
  • Ofo
  • Hellobike
  • Lime Bike
  • BikeMi
  • Obike
  • Mango
  • Co-bikes
  • Bonopark
  • Citi Bike
  • Journey Matters
  • Mobike
  • Zoomcar
  • Gobike

The taxonomy of the e-bike sharing industry by its scope and segmentation is as follows:

logoBy Type Segmentation Analysis

  • Public Organization & Government
  • Private Company

logoBy Industry Segmentation Analysis

  • Internal Use
  • Public Use

logoBy Regional Segmentation Analysis

  • North America
    • The U.S.
    • Canada
  • Europe
    • Germany
    • The UK
    • France
    • Spain
    • Italy
    • Rest of Europe
  • Asia Pacific
    • China
    • Japan
    • India
    • South Korea
    • Southeast Asia
    • Rest of Asia Pacific
  • Latin America
    • Brazil
    • Mexico
    • Rest of Latin America
  • Middle East & Africa
    • GCC
    • South Africa
    • Rest of Middle East & Africa

Table of Content

  1. CHAPTER 1. Executive Summary
  2. CHAPTER 2. e-bike sharing market – Type Analysis
    1. 2.1. Global E-Bike Sharing Market – Type Overview
    2. 2.2. Global E-Bike Sharing Market Share, by Type, 2018 & 2025 (USD Million)
    3. 2.3. Public Organization & Government
      1. 2.3.1. Global Public Organization & Government E-Bike Sharing Market, 2016-2026 (USD Million)
    4. 2.4. Private Company
      1. 2.4.1. Global Private Company E-Bike Sharing Market, 2016-2026 (USD Million)
  3. CHAPTER 3. e-bike sharing market – Industry Analysis
    1. 3.1. Global E-Bike Sharing Market – Industry Overview
    2. 3.2. Global E-Bike Sharing Market Share, by Industry, 2018 & 2025 (USD Million)
    3. 3.3. Internal Use
      1. 3.3.1. Global Internal Use E-Bike Sharing Market, 2016-2026 (USD Million)
    4. 3.4. Public Use
      1. 3.4.1. Global Public Use E-Bike Sharing Market, 2016-2026 (USD Million)
  4. CHAPTER 4. e-bike sharing market – Regional Analysis
    1. 4.1. Global E-Bike Sharing Market Regional Overview
    2. 4.2. Global E-Bike Sharing Market Share, by Region, 2018 & 2025 (Value)
    3. 4.3. North America
      1. 4.3.1. North America E-Bike Sharing Market size and forecast, 2016-2026
      2. 4.3.2. North America E-Bike Sharing Market, by Country, 2018 & 2025 (USD Million)
      3. 4.3.3. North America E-Bike Sharing Market, by Type, 2016-2026
        1. 4.3.3.1. North America E-Bike Sharing Market, by Type, 2016-2026 (USD Million)
      4. 4.3.4. North America E-Bike Sharing Market, by Industry, 2016-2026
        1. 4.3.4.1. North America E-Bike Sharing Market, by Industry, 2016-2026 (USD Million)
      5. 4.3.5. U.S.
        1. 4.3.5.1. U.S. Market size and forecast, 2016-2026 (USD Million)
      6. 4.3.6. Canada
        1. 4.3.6.1. Canada Market size and forecast, 2016-2026 (USD Million)
    4. 4.4. Europe
      1. 4.4.1. Europe E-Bike Sharing Market size and forecast, 2016-2026
      2. 4.4.2. Europe E-Bike Sharing Market, by Country, 2018 & 2025 (USD Million)
      3. 4.4.3. Europe E-Bike Sharing Market, by Type, 2016-2026
        1. 4.4.3.1. Europe E-Bike Sharing Market, by Type, 2016-2026 (USD Million)
      4. 4.4.4. Europe E-Bike Sharing Market, by Industry, 2016-2026
        1. 4.4.4.1. Europe E-Bike Sharing Market, by Industry, 2016-2026 (USD Million)
      5. 4.4.5. Germany
        1. 4.4.5.1. Germany Market size and forecast, 2016-2026 (USD Million)
      6. 4.4.6. France
        1. 4.4.6.1. France Market size and forecast, 2016-2026 (USD Million)
      7. 4.4.7. U.K.
        1. 4.4.7.1. U.K. Market size and forecast, 2016-2026 (USD Million)
      8. 4.4.8. Italy
        1. 4.4.8.1. Italy Market size and forecast, 2016-2026 (USD Million)
      9. 4.4.9. Spain
        1. 4.4.9.1. Spain Market size and forecast, 2016-2026 (USD Million)
      10. 4.4.10. Rest of Europe
        1. 4.4.10.1. Rest of Europe Market size and forecast, 2016-2026 (USD Million)
    5. 4.5. Asia Pacific
      1. 4.5.1. Asia Pacific E-Bike Sharing Market size and forecast, 2016-2026
      2. 4.5.2. Asia Pacific E-Bike Sharing Market, by Country, 2018 & 2025 (USD Million)
      3. 4.5.3. Asia Pacific E-Bike Sharing Market, by Type, 2016-2026
        1. 4.5.3.1. Asia Pacific E-Bike Sharing Market, by Type, 2016-2026 (USD Million)
      4. 4.5.4. Asia Pacific E-Bike Sharing Market, by Industry, 2016-2026
        1. 4.5.4.1. Asia Pacific E-Bike Sharing Market, by Industry, 2016-2026 (USD Million)
      5. 4.5.5. China
        1. 4.5.5.1. China Market size and forecast, 2016-2026 (USD Million)
      6. 4.5.6. Japan
        1. 4.5.6.1. Japan Market size and forecast, 2016-2026 (USD Million)
      7. 4.5.7. India
        1. 4.5.7.1. India Market size and forecast, 2016-2026 (USD Million)
      8. 4.5.8. South Korea
        1. 4.5.8.1. South Korea Market size and forecast, 2016-2026 (USD Million)
      9. 4.5.9. South-East Asia
        1. 4.5.9.1. South-East Asia Market size and forecast, 2016-2026 (USD Million)
      10. 4.5.10. Rest of Asia Pacific
        1. 4.5.10.1. Rest of Asia Pacific Market size and forecast, 2016-2026 (USD Million)
    6. 4.6. Latin America
      1. 4.6.1. Latin America E-Bike Sharing Market size and forecast, 2016-2026
      2. 4.6.2. Latin America E-Bike Sharing Market, by Country, 2018 & 2025 (USD Million)
      3. 4.6.3. Latin America E-Bike Sharing Market, by Type, 2016-2026
        1. 4.6.3.1. Latin America E-Bike Sharing Market, by Type, 2016-2026 (USD Million)
      4. 4.6.4. Latin America E-Bike Sharing Market, by Industry, 2016-2026
        1. 4.6.4.1. Latin America E-Bike Sharing Market, by Industry, 2016-2026 (USD Million)
      5. 4.6.5. Brazil
        1. 4.6.5.1. Brazil Market size and forecast, 2016-2026 (USD Million)
      6. 4.6.6. Mexico
        1. 4.6.6.1. Mexico Market size and forecast, 2016-2026 (USD Million)
      7. 4.6.7. Rest of Latin America
        1. 4.6.7.1. Rest of Latin America Market size and forecast, 2016-2026 (USD Million)
    7. 4.7. The Middle-East and Africa
      1. 4.7.1. The Middle-East and Africa E-Bike Sharing Market size and forecast, 2016-2026
      2. 4.7.2. The Middle-East and Africa E-Bike Sharing Market, by Country, 2018 & 2025 (USD Million)
      3. 4.7.3. The Middle-East and Africa E-Bike Sharing Market, by Type, 2016-2026
        1. 4.7.3.1. The Middle-East and Africa E-Bike Sharing Market, by Type, 2016-2026 (USD Million)
      4. 4.7.4. The Middle-East and Africa E-Bike Sharing Market, by Industry, 2016-2026
        1. 4.7.4.1. The Middle-East and Africa E-Bike Sharing Market, by Industry, 2016-2026 (USD Million)
      5. 4.7.5. GCC Countries
        1. 4.7.5.1. GCC Countries Market size and forecast, 2016-2026 (USD Million)
      6. 4.7.6. South Africa
        1. 4.7.6.1. South Africa Market size and forecast, 2016-2026 (USD Million)
      7. 4.7.7. Rest of Middle-East Africa
        1. 4.7.7.1. Rest of Middle-East Africa Market size and forecast, 2016-2026 (USD Million)
  5. CHAPTER 5. e-bike sharing market – Competitive Landscape
    1. 5.1. Competitor Market Share – Revenue
    2. 5.2. Market Concentration Rate Analysis, Top 3 and Top 5 Players
    3. 5.3. Strategic Development
      1. 5.3.1. Acquisitions and Mergers
      2. 5.3.2. New Products
      3. 5.3.3. Research & Development Activities
  6. CHAPTER 6. Company Profiles
    1. 6.1. Bikeplus
      1. 6.1.1. Company Overview
      2. 6.1.2. Bikeplus Revenue and Gross Margin
      3. 6.1.3. Product portfolio
      4. 6.1.4. Recent initiatives
    2. 6.2. Ofo
      1. 6.2.1. Company Overview
      2. 6.2.2. Ofo Revenue and Gross Margin
      3. 6.2.3. Product portfolio
      4. 6.2.4. Recent initiatives
    3. 6.3. Co-bikes
      1. 6.3.1. Company Overview
      2. 6.3.2. Co-bikes Revenue and Gross Margin
      3. 6.3.3. Product portfolio
      4. 6.3.4. Recent initiatives
    4. 6.4. Hellobike
      1. 6.4.1. Company Overview
      2. 6.4.2. Hellobike Revenue and Gross Margin
      3. 6.4.3. Product portfolio
      4. 6.4.4. Recent initiatives
    5. 6.5. Lime Bike
      1. 6.5.1. Company Overview
      2. 6.5.2. Lime Bike Revenue and Gross Margin
      3. 6.5.3. Product portfolio
      4. 6.5.4. Recent initiatives
    6. 6.6. BikeMi
      1. 6.6.1. Company Overview
      2. 6.6.2. BikeMi Revenue and Gross Margin
      3. 6.6.3. Product portfolio
      4. 6.6.4. Recent initiatives
    7. 6.7. Obike
      1. 6.7.1. Company Overview
      2. 6.7.2. Obike Revenue and Gross Margin
      3. 6.7.3. Product portfolio
      4. 6.7.4. Recent initiatives
    8. 6.8. Pedego Electric Bikes
      1. 6.8.1. Company Overview
      2. 6.8.2. Pedego Electric Bikes Revenue and Gross Margin
      3. 6.8.3. Product portfolio
      4. 6.8.4. Recent initiatives
    9. 6.9. Mango
      1. 6.9.1. Company Overview
      2. 6.9.2. Mango Revenue and Gross Margin
      3. 6.9.3. Product portfolio
      4. 6.9.4. Recent initiatives
    10. 6.10. Bonopark
      1. 6.10.1. Company Overview
      2. 6.10.2. Bonopark Revenue and Gross Margin
      3. 6.10.3. Product portfolio
      4. 6.10.4. Recent initiatives
    11. 6.11. Citi Bike
      1. 6.11.1. Company Overview
      2. 6.11.2. Citi Bike Revenue and Gross Margin
      3. 6.11.3. Product portfolio
      4. 6.11.4. Recent initiatives
    12. 6.12. Journey Matters
      1. 6.12.1. Company Overview
      2. 6.12.2. Journey Matters Revenue and Gross Margin
      3. 6.12.3. Product portfolio
      4. 6.12.4. Recent initiatives
    13. 6.13. Mobike
      1. 6.13.1. Company Overview
      2. 6.13.2. Mobike Revenue and Gross Margin
      3. 6.13.3. Product portfolio
      4. 6.13.4. Recent initiatives
    14. 6.14. Zoomcar
      1. 6.14.1. Company Overview
      2. 6.14.2. Zoomcar Revenue and Gross Margin
      3. 6.14.3. Product portfolio
      4. 6.14.4. Recent initiatives
    15. 6.15. Gobike
      1. 6.15.1. Company Overview
      2. 6.15.2. Gobike Revenue and Gross Margin
      3. 6.15.3. Product portfolio
      4. 6.15.4. Recent initiatives
  7. CHAPTER 7. E-Bike Sharing — Industry Analysis
    1. 7.1. E-Bike Sharing Market – Key Trends
      1. 7.1.1. Market Drivers
      2. 7.1.2. Market Restraints
      3. 7.1.3. Market Opportunities
    2. 7.2. Value Chain Analysis
    3. 7.3. Technology Roadmap and Timeline
    4. 7.4. E-Bike Sharing Market – Attractiveness Analysis
      1. 7.4.1. By Type
      2. 7.4.2. By Industry
      3. 7.4.3. By Region
  8. CHAPTER 8. Marketing Strategy Analysis, Distributors
    1. 8.1. Marketing Channel
    2. 8.2. Direct Marketing
    3. 8.3. Indirect Marketing
    4. 8.4. Marketing Channel Development Trend
    5. 8.5. Economic/Political Environmental Change
  9. CHAPTER 9. Report Conclusion
  10. CHAPTER 10. Research Approach & Methodology
    1. 10.1. Report Description
    2. 10.2. Research Scope
    3. 10.3. Research Methodology
      1. 10.3.1. Secondary Research
      2. 10.3.2. Primary Research
      3. 10.3.3. Models
        1. 10.3.3.1. Company Share Analysis Model
        2. 10.3.3.2. Revenue Based Modeling
        3. 10.3.3.3. Research Limitations

        List of Figures

        FIG. 1 Global E-Bike Sharing Market, 2016-2026 (USD Million)
        FIG. 2 Global E-Bike Sharing Market Share, by Type, 2018 & 2025 (USD Million)
        FIG. 3 Global Public Organization & Government E-Bike Sharing Market, 2016-2026 (USD Million)
        FIG. 4 Global Private Company E-Bike Sharing Market, 2016-2026 (USD Million)
        FIG. 5 Global E-Bike Sharing Market Share, by Industry, 2018 & 2025 (USD Million)
        FIG. 6 Global Internal Use E-Bike Sharing Market, 2016-2026 (USD Million)
        FIG. 7 Global Public Use E-Bike Sharing Market, 2016-2026 (USD Million)
        FIG. 8 Global E-Bike Sharing Market Share, by Region, 2018 & 2025
        FIG. 9 North America E-Bike Sharing Market, 2016-2026
        FIG. 10 U.S. E-Bike Sharing Market, 2016-2026
        FIG. 11 Canada E-Bike Sharing Market, 2016-2026
        FIG. 12 Europe E-Bike Sharing Market, 2016-2026
        FIG. 13 Germany E-Bike Sharing Market, 2016-2026
        FIG. 14 France E-Bike Sharing Market, 2016-2026
        FIG. 15 U.K. E-Bike Sharing Market, 2016-2026
        FIG. 16 Italy E-Bike Sharing Market, 2016-2026
        FIG. 17 Spain E-Bike Sharing Market, 2016-2026
        FIG. 18 Rest of Europe E-Bike Sharing Market, 2016-2026
        FIG. 19 Asia Pacific E-Bike Sharing Market, 2016-2026
        FIG. 20 China E-Bike Sharing Market, 2016-2026
        FIG. 21 Japan E-Bike Sharing Market, 2016-2026
        FIG. 22 India E-Bike Sharing Market, 2016-2026
        FIG. 23 South  Korea E-Bike Sharing Market, 2016-2026
        FIG. 24 South-East Asia E-Bike Sharing Market, 2016-2026
        FIG. 25 Rest of Asia Pacific E-Bike Sharing Market, 2016-2026
        FIG. 26 Latin America E-Bike Sharing Market, 2016-2026
        FIG. 27 Brazil E-Bike Sharing Market, 2016-2026
        FIG. 28 Mexico E-Bike Sharing Market, 2016-2026
        FIG. 29 Rest of Latin America E-Bike Sharing Market, 2016-2026
        FIG. 30 The Middle-East and Africa E-Bike Sharing Market, 2016-2026
        FIG. 31 GCC Countries E-Bike Sharing Market, 2016-2026
        FIG. 32 South Africa E-Bike Sharing Market, 2016-2026
        FIG. 33 Rest of Middle-East Africa E-Bike Sharing Market, 2016-2026
        FIG. 34 Competitor Market Share – Revenue
        FIG. 35 Bikeplus Revenue and Growth Rate
        FIG. 36 Bikeplus Market Share
        FIG. 37 Ofo Revenue and Growth Rate
        FIG. 38 Ofo Market Share
        FIG. 39 Co-bikes Revenue and Growth Rate
        FIG. 40 Co-bikes Market Share
        FIG. 41 Hellobike Revenue and Growth Rate
        FIG. 42 Hellobike Market Share
        FIG. 43 Lime Bike Revenue and Growth Rate
        FIG. 44 Lime Bike Market Share
        FIG. 45 BikeMi Revenue and Growth Rate
        FIG. 46 BikeMi Market Share
        FIG. 47 Obike Revenue and Growth Rate
        FIG. 48 Obike Market Share
        FIG. 49 Pedego Electric Bikes Revenue and Growth Rate
        FIG. 50 Pedego Electric Bikes Market Share
        FIG. 51 Mango Revenue and Growth Rate
        FIG. 52 Mango Market Share
        FIG. 53 Bonopark Revenue and Growth Rate
        FIG. 54 Bonopark Market Share
        FIG. 55 Citi Bike Revenue and Growth Rate
        FIG. 56 Citi Bike Market Share
        FIG. 57 Journey Matters Revenue and Growth Rate
        FIG. 58 Journey Matters Market Share
        FIG. 59 Mobike Revenue and Growth Rate
        FIG. 60 Mobike Market Share
        FIG. 61 Zoomcar Revenue and Growth Rate
        FIG. 62 Zoomcar Market Share
        FIG. 63 Gobike Revenue and Growth Rate
        FIG. 64 Gobike Market Share
        FIG. 65 Market Dynamics
        FIG. 66 Global E-Bike Sharing – Value Chain Analysis
        FIG. 67 Technology Roadmap and Timeline
        FIG. 68 Market Attractiveness Analysis – By Type
        FIG. 69 Market Attractiveness Analysis – By Industry
        FIG. 70 Market Attractiveness Analysis – By Region
        FIG. 71 Market Channel
        FIG. 72 Marketing Channel Development Trend
        FIG. 73 Growth in World Gross Product, 2008-2018

        List of Tables

        TABLE 1 Global E-Bike Sharing Market, 2018 & 2025 (USD Million)
        TABLE 2 Global e-bike sharing market, by Type, 2016-2026 (USD Million)
        TABLE 3 Global e-bike sharing market, by Industry, 2016-2026 (USD Million)
        TABLE 4 Global e-bike sharing market, by Region, 2016-2026 (USD Million)
        TABLE 5 North America E-Bike Sharing Market, by Type, 2016-2026 (USD Million)
        TABLE 6 North America E-Bike Sharing Market, by Industry, 2016-2026 (USD Million)
        TABLE 7 Europe E-Bike Sharing Market, by Type, 2016-2026 (USD Million)
        TABLE 8 Europe E-Bike Sharing Market, by Industry, 2016-2026 (USD Million)
        TABLE 9 Asia Pacific E-Bike Sharing Market, by Type, 2016-2026 (USD Million)
        TABLE 10 Asia Pacific E-Bike Sharing Market, by Industry, 2016-2026 (USD Million)
        TABLE 11 Latin America E-Bike Sharing Market, by Type, 2016-2026 (USD Million)
        TABLE 12 Latin America E-Bike Sharing Market, by Industry, 2016-2026 (USD Million)
        TABLE 13 The Middle-East and Africa E-Bike Sharing Market, by Type, 2016-2026 (USD Million)
        TABLE 14 The Middle-East and Africa E-Bike Sharing Market, by Industry, 2016-2026 (USD Million)
        TABLE 15 Global E-Bike Sharing Market - Company Revenue Analysis 2016-2019 (USD Million)
        TABLE 16 Global E-Bike Sharing Market - Company Revenue Share Analysis 2016-2019(%)
        TABLE 17 Acquisitions and Mergers
        TABLE 18 New Product/Service Launch
        TABLE 19 Research & Development Activities
        TABLE 20 Market Drivers
        TABLE 21 Market Restraints
        TABLE 22 Market Opportunities

Industry Major Market Players

  • Pedego Electric Bikes
  • Bikeplus
  • Ofo
  • Hellobike
  • Lime Bike
  • BikeMi
  • Obike
  • Mango
  • Co-bikes
  • Bonopark
  • Citi Bike
  • Journey Matters
  • Mobike
  • Zoomcar
  • and Gobike