Search Market Research Report

Discover Our Latest Reports
Discover Our Featured Reports
Discover Top Selling Reports

Dyes and Pigments Market Size, Share Global Analysis Report, 2020–2026

report img

Dyes and Pigments Market By Dyes (Reactive Dyes, Disperse Dyes, Vat Dyes, Direct Dyes, Acid Dyes, and Others), by Pigments(Inorganic, and Organic) and By Application (Textile, Construction, Leather, Plastics, Paper, and Paints & Coatings): Global Industry Outlook, Market Size, Business Intelligence, Consumer Preferences, Statistical Surveys, Comprehensive Analysis, Historical Developments, Current Trends, and Forecast 2020–2026

Industry Insights

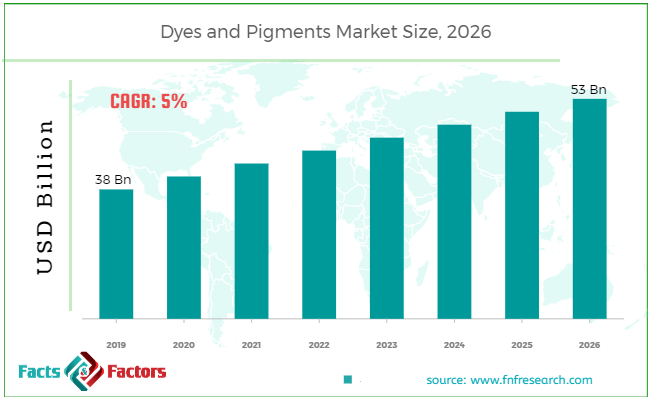
[185+ Pages Report] According to the report published by Facts Factors, the global dyes and pigments market size was worth around USD 38 billion in 2019 and is predicted to grow to around USD 53 billion by 2026 with a compound annual growth rate (CAGR) of roughly 5% between 2020 and 2026. The report analyzes the global dyes and pigments market drivers, restraints/challenges, and the effect they have on the demands during the projection period. In addition, the report explores emerging opportunities in the dyes and pigments market.

Dyes and Pigments Market Size

To know more about this report | Request Free Sample Copy

This specialized and expertise oriented industry research report scrutinizes the technical and commercial business outlook of the Dyes and Pigments industry. The report analyzes and declares the historical and current trends analysis of the Dyes and Pigments industry and subsequently recommends the projected trends anticipated to be observed in the Dyes and Pigments market during the upcoming years.


logoKey Insights from Primary Research

  • The Asia Pacific is expected to hold the largest market share of the Dyes and Pigments market in terms of revenue, in 2019.
  • The “Textile” category, on the basis of application segmentation, contributing to the highest revenue-generating category.
  • According to dyes based segmentation the “Reactive Dyes” category, was the leading revenue-generating category in 2019.
  • It was recognized through primary research that the Dyes and Pigments market was valued at around USD 38 Billion in 2019.
  • According to our primary respondents, the Dyes and Pigments market is set to grow annually at a rate of around 5%.

logoKey Recommendations from Analysts

  • With the growing infrastructure, the paint & coatings industry is growing considerably
  • Due to the growing population and infrastructure projects, Asia-Pacific is expected to be a major paint & coatings sector. The rapid growth of the construction market in the Asia Pacific is projected to augment the market.
  • Reactive dyes are anticipated to lead the market in the forecast period. The reactive dye is estimated to hold more than 50% of the market share owing to its wide use for coloring the textiles.
  • Few European companies are focused on expanding their production capacity which is projected to increase the share of European regions across the globe.
  • The moderate GDP of Latin America and the Middle East is estimated to generate moderate demand for the dyes and pigments in the forthcoming time.

The Dyes and Pigments market report analyzes and notifies the industry statistics at the global as well as regional and country levels in order to acquire a thorough perspective of the entire Dyes and Pigments market. The historical and past insights are provided for FY 2016 to FY 2019 whereas projected trends are delivered for FY 2020 to FY 2026. The quantitative and numerical data is represented in terms of both volume (Kilo Tons) and value (USD Million) from FY 2016 – 2026.

The quantitative data is further underlined and reinforced by comprehensive qualitative data which comprises various across-the-board market dynamics. The rationales which directly or indirectly impact the Dyes and Pigments industry are exemplified through parameters such as growth drivers, restraints, challenges, and opportunities among other impacting factors.

Throughout our research report, we have encompassed all the proven models and tools of industry analysis and extensively illustrated all the key business strategies and business models adopted in the Dyes and Pigments industry. The report provides an all-inclusive and detailed competitive landscape prevalent in the Dyes and Pigments market.

The report utilizes established industry analysis tools and models such as Porter’s Five Forces framework to analyze and recognize critical business strategies adopted by various stakeholders involved in the entire value chain of the Dyes and Pigments industry. The Dyes and Pigments market report additionally employs SWOT analysis and PESTLE analysis models for further in-depth analysis.

The report study further includes an in-depth analysis of industry players' market shares and provides an overview of leading players' market position in the Dyes and Pigments sector. Key strategic developments in the Dyes and Pigments market competitive landscape such as acquisitions & mergers, inaugurations of different products and services, partnerships & joint ventures, MoU agreements, VC & funding activities, R&D activities, and geographic expansion among other noteworthy activities by key players of the Dyes and Pigments market are appropriately highlighted in the report.

The Dyes and Pigments market research report delivers an acute valuation and taxonomy of the Dyes and Pigments industry by practically splitting the market on the basis of different types, applications, and regions. Through the analysis of the historical and projected trends, all the segments and sub-segments were evaluated through the bottom-up approach, and different market sizes have been projected for FY 2020 to FY 2026. The regional segmentation of the Dyes and Pigments industry includes the complete classification of all the major continents including North America, Latin America, Europe, Asia Pacific, and Middle East & Africa. Further, country-wise data for the Dyes and Pigments industry is provided for the leading economies of the world.

Based on segments dyes and pigments market is bifurcated such as dyes, pigments, and application. Based on dyes, market is categorized as reactive dyes, disperse dyes, vat dyes, direct dyes, acid dyes, and others. On the basis of Pigments market is split as inorganic, and organic. In terms of application, market is categorized as textile, construction, leather, plastics, paper, and paints & coatings.

logoReport Scope

Report Attribute

Details

Market Size in 2019

USD 38 Billion

Projected Market Size in 2026

USD 53 Billion

CAGR Growth Rate

5% CAGR

Base Year

2019

Forecast Years

2019-2026

Key Market Players

BASF SE, Lanxess AG, Clariant AG, Kronos Worldwide Inc., DIC Corporation, Kiri Industries Ltd., Sudarshan Chemical Industries Limited, Cabot Corp, Huntsman Corporation; and Atul Ltd.

Key Segment

By Dyes, By Pigments, By Region

Major Regions Covered

North America, Europe, Asia Pacific, Latin America, and the Middle East & Africa

Purchase Options

Request customized purchase options to meet your research needs. Explore purchase options

logoSome of the leading players in the global market include

  • BASF SE
  •  Lanxess AG
  •  Clariant AG
  •  Kronos Worldwide Inc.
  •  DIC Corporation
  •  Kiri Industries Ltd. 
  •  Sudarshan Chemical Industries Limited
  •  Cabot Corp
  •  Huntsman Corporation
  • Atul Ltd

The taxonomy of the Dyes and Pigments market by its scope and segmentation is as follows:

logoBy Dyes Segmentation Analysis

  • Reactive Dyes
  • Disperse Dyes
  • Vat Dyes
  • Direct Dyes
  • Acid Dyes
  • Others

logoBy Pigments Segmentation Analysis

  • Inorganic
  • Organic

logoBy Pigments Segmentation Analysis

  • Textile
  • Construction
  • Leather
  • Plastics
  • Paper
  • Paints & Coatings

logoBy Regional Segmentation Analysis

  • North America
    • The U.S.
    • Canada
  • Europe
    • Germany
    • The UK
    • France
    • Spain
    • Italy
    • Rest of Europe
  • Asia Pacific
    • China
    • Japan
    • India
    • South Korea
    • Southeast Asia
    • Rest of Asia Pacific
  • Latin America
    • Brazil
    • Mexico
    • Rest of Latin America
  • Middle East & Africa
    • GCC
    • South Africa
    • Rest of Middle East & Africa

Table of Content

  1. CHAPTER 1. Executive Summary
  2. CHAPTER 2. Dyes and Pigments market – Dyes Analysis
    1. 2.1. Global Dyes and Pigments Market – Dyes Overview
    2. 2.2. Global Dyes and Pigments Market Share, by Dyes, 2019 & 2026 (USD Million)
    3. 2.3. Global Dyes and Pigments Market share, by Dyes, 2019 & 2026 (Kilo Tons)
    4. 2.4. Reactive Dyes
      1. 2.4.1. Global Reactive Dyes Dyes and Pigments Market, 2019-2026 (USD Million)
      2. 2.4.2. Global Reactive Dyes Dyes and Pigments Market, 2019-2026 (Kilo Tons)
    5. 2.5. Disperse Dyes
      1. 2.5.1. Global Disperse Dyes Dyes and Pigments Market, 2019-2026 (USD Million)
      2. 2.5.2. Global Disperse Dyes Dyes and Pigments Market, 2019-2026 (Kilo Tons)
    6. 2.6. Vat Dyes
      1. 2.6.1. Global Vat Dyes Dyes and Pigments Market, 2019-2026 (USD Million)
      2. 2.6.2. Global Vat Dyes Dyes and Pigments Market, 2019-2026 (Kilo Tons)
    7. 2.7. Direct Dyes
      1. 2.7.1. Global Direct Dyes Dyes and Pigments Market, 2019-2026 (USD Million)
      2. 2.7.2. Global Direct Dyes Dyes and Pigments Market, 2019-2026 (Kilo Tons)
    8. 2.8. Acid Dyes
      1. 2.8.1. Global Acid Dyes Dyes and Pigments Market, 2019-2026 (USD Million)
      2. 2.8.2. Global Acid Dyes Dyes and Pigments Market, 2019-2026 (Kilo Tons)
    9. 2.9. Others
      1. 2.9.1. Global Others Dyes and Pigments Market, 2019-2026 (USD Million)
      2. 2.9.2. Global Others Dyes and Pigments Market, 2019-2026 (Kilo Tons)
  3. CHAPTER 3. Dyes and Pigments market – Pigments Analysis
    1. 3.1. Global Dyes and Pigments Market – Pigments Overview
    2. 3.2. Global Dyes and Pigments Market Share, by Pigments, 2019 & 2026 (USD Million)
    3. 3.3. Global Dyes and Pigments Market share, by Pigments, 2019 & 2026 (Kilo Tons)
    4. 3.4. Inorganic
      1. 3.4.1. Global Inorganic Dyes and Pigments Market, 2019-2026 (USD Million)
      2. 3.4.2. Global Inorganic Dyes and Pigments Market, 2019-2026 (Kilo Tons)
    5. 3.5. Organic
      1. 3.5.1. Global Organic Dyes and Pigments Market, 2019-2026 (USD Million)
      2. 3.5.2. Global Organic Dyes and Pigments Market, 2019-2026 (Kilo Tons)
  4. CHAPTER 4. Dyes and Pigments market – Application Analysis
    1. 4.1. Global Dyes and Pigments Market – Application Overview
    2. 4.2. Global Dyes and Pigments Market Share, by Application, 2019 & 2026 (USD Million)
    3. 4.3. Global Dyes and Pigments Market share, by Application, 2019 & 2026 (Kilo Tons)
    4. 4.4. Textile
      1. 4.4.1. Global Textile Dyes and Pigments Market, 2019-2026 (USD Million)
      2. 4.4.2. Global Textile Dyes and Pigments Market, 2019-2026 (Kilo Tons)
    5. 4.5. Construction
      1. 4.5.1. Global Construction Dyes and Pigments Market, 2019-2026 (USD Million)
      2. 4.5.2. Global Construction Dyes and Pigments Market, 2019-2026 (Kilo Tons)
    6. 4.6. Leather
      1. 4.6.1. Global Leather Dyes and Pigments Market, 2019-2026 (USD Million)
      2. 4.6.2. Global Leather Dyes and Pigments Market, 2019-2026 (Kilo Tons)
    7. 4.7. Plastics
      1. 4.7.1. Global Plastics Dyes and Pigments Market, 2019-2026 (USD Million)
      2. 4.7.2. Global Plastics Dyes and Pigments Market, 2019-2026 (Kilo Tons)
    8. 4.8. Paper
      1. 4.8.1. Global Paper Dyes and Pigments Market, 2019-2026 (USD Million)
      2. 4.8.2. Global Paper Dyes and Pigments Market, 2019-2026 (Kilo Tons)
    9. 4.9. Paints & Coatings
      1. 4.9.1. Global Paints & Coatings Dyes and Pigments Market, 2019-2026 (USD Million)
      2. 4.9.2. Global Paints & Coatings Dyes and Pigments Market, 2019-2026 (Kilo Tons)
  5. CHAPTER 5. Dyes and Pigments market – Regional Analysis
    1. 5.1. Global Dyes and Pigments Market Regional Overview
    2. 5.2. Global Dyes and Pigments Market Share, by Region, 2019 & 2026 (Value)
    3. 5.3. Global Dyes and Pigments Market Share, by Region, 2019 & 2026 (Volume)
    4. 5.4. North America
      1. 5.4.1. North America Dyes and Pigments Market size and forecast, 2019-2026
      2. 5.4.2. North America Dyes and Pigments Market, by Country, 2019 - 2026 (USD Million)
      3. 5.4.3. North America Market size and forecast, 2019-2026 (Kilo Tons)
      4. 5.4.4. North America Dyes and Pigments Market, by Country, 2019 - 2026 (Kilo Tons)
      5. 5.4.5. North America Dyes and Pigments Market, by Dyes, 2019-2026
        1. 5.4.5.1. North America Dyes and Pigments Market, by Dyes, 2019-2026 (USD Million)
        2. 5.4.5.2. North America Dyes and Pigments Market, by Dyes, 2019-2026 (Kilo Tons)
      6. 5.4.6. North America Dyes and Pigments Market, by Pigments, 2019-2026
        1. 5.4.6.1. North America Dyes and Pigments Market, by Pigments, 2019-2026 (USD Million)
        2. 5.4.6.2. North America Dyes and Pigments Market, by Pigments, 2019-2026 (Kilo Tons)
      7. 5.4.7. North America Dyes and Pigments Market, by Application, 2019-2026
        1. 5.4.7.1. North America Dyes and Pigments Market, by Application, 2019-2026 (USD Million)
        2. 5.4.7.2. North America Dyes and Pigments Market, by Application, 2019-2026 (Kilo Tons)
      8. 5.4.8. U.S.
        1. 5.4.8.1. U.S. Market size and forecast, 2019-2026 (USD Million)
        2. 5.4.8.2. U.S. Market size and forecast, 2019-2026 (Kilo Tons)
      9. 5.4.9. Canada
        1. 5.4.9.1. Canada Market size and forecast, 2019-2026 (USD Million)
        2. 5.4.9.2. Canada Market size and forecast, 2019-2026 (Kilo Tons)
    5. 5.5. Europe
      1. 5.5.1. Europe Dyes and Pigments Market size and forecast, 2019-2026
      2. 5.5.2. Europe Dyes and Pigments Market, by Country, 2019 - 2026 (USD Million)
      3. 5.5.3. Europe Market size and forecast, 2019-2026 (Kilo Tons)
      4. 5.5.4. Europe Dyes and Pigments Market, by Country, 2019 - 2026 (Kilo Tons)
      5. 5.5.5. Europe Dyes and Pigments Market, by Dyes, 2019-2026
        1. 5.5.5.1. Europe Dyes and Pigments Market, by Dyes, 2019-2026 (USD Million)
        2. 5.5.5.2. Europe Dyes and Pigments Market, by Dyes, 2019-2026 (Kilo Tons)
      6. 5.5.6. Europe Dyes and Pigments Market, by Pigments, 2019-2026
        1. 5.5.6.1. Europe Dyes and Pigments Market, by Pigments, 2019-2026 (USD Million)
        2. 5.5.6.2. Europe Dyes and Pigments Market, by Pigments, 2019-2026 (Kilo Tons)
      7. 5.5.7. Europe Dyes and Pigments Market, by Application, 2019-2026
        1. 5.5.7.1. Europe Dyes and Pigments Market, by Application, 2019-2026 (USD Million)
        2. 5.5.7.2. Europe Dyes and Pigments Market, by Application, 2019-2026 (Kilo Tons)
      8. 5.5.8. Germany
        1. 5.5.8.1. Germany Market size and forecast, 2019-2026 (USD Million)
        2. 5.5.8.2. Germany Market size and forecast, 2019-2026 (Kilo Tons)
      9. 5.5.9. France
        1. 5.5.9.1. France Market size and forecast, 2019-2026 (USD Million)
        2. 5.5.9.2. France Market size and forecast, 2019-2026 (Kilo Tons)
      10. 5.5.10. U.K.
        1. 5.5.10.1. U.K. Market size and forecast, 2019-2026 (USD Million)
        2. 5.5.10.2. U.K. Market size and forecast, 2019-2026 (Kilo Tons)
      11. 5.5.11. Italy
        1. 5.5.11.1. Italy Market size and forecast, 2019-2026 (USD Million)
        2. 5.5.11.2. Italy Market size and forecast, 2019-2026 (Kilo Tons)
      12. 5.5.12. Spain
        1. 5.5.12.1. Spain Market size and forecast, 2019-2026 (USD Million)
        2. 5.5.12.2. Spain Market size and forecast, 2019-2026 (Kilo Tons)
      13. 5.5.13. Rest of Europe
        1. 5.5.13.1. Rest of Europe Market size and forecast, 2019-2026 (USD Million)
        2. 5.5.13.2. Rest of Europe Market size and forecast, 2019-2026 (Kilo Tons)
    6. 5.6. Asia Pacific
      1. 5.6.1. Asia Pacific Dyes and Pigments Market size and forecast, 2019-2026
      2. 5.6.2. Asia Pacific Dyes and Pigments Market, by Country, 2019 - 2026 (USD Million)
      3. 5.6.3. Asia Pacific Market size and forecast, 2019-2026 (Kilo Tons)
      4. 5.6.4. Asia Pacific Dyes and Pigments Market, by Country, 2019 - 2026 (Kilo Tons)
      5. 5.6.5. Asia Pacific Dyes and Pigments Market, by Dyes, 2019-2026
        1. 5.6.5.1. Asia Pacific Dyes and Pigments Market, by Dyes, 2019-2026 (USD Million)
        2. 5.6.5.2. Asia Pacific Dyes and Pigments Market, by Dyes, 2019-2026 (Kilo Tons)
      6. 5.6.6. Asia Pacific Dyes and Pigments Market, by Pigments, 2019-2026
        1. 5.6.6.1. Asia Pacific Dyes and Pigments Market, by Pigments, 2019-2026 (USD Million)
        2. 5.6.6.2. Asia Pacific Dyes and Pigments Market, by Pigments, 2019-2026 (Kilo Tons)
      7. 5.6.7. Asia Pacific Dyes and Pigments Market, by Application, 2019-2026
        1. 5.6.7.1. Asia Pacific Dyes and Pigments Market, by Application, 2019-2026 (USD Million)
        2. 5.6.7.2. Asia Pacific Dyes and Pigments Market, by Application, 2019-2026 (Kilo Tons)
      8. 5.6.8. China
        1. 5.6.8.1. China Market size and forecast, 2019-2026 (USD Million)
        2. 5.6.8.2. China Market size and forecast, 2019-2026 (Kilo Tons)
      9. 5.6.9. Japan
        1. 5.6.9.1. Japan Market size and forecast, 2019-2026 (USD Million)
        2. 5.6.9.2. Japan Market size and forecast, 2019-2026 (Kilo Tons)
      10. 5.6.10. India
        1. 5.6.10.1. India Market size and forecast, 2019-2026 (USD Million)
        2. 5.6.10.2. India Market size and forecast, 2019-2026 (Kilo Tons)
      11. 5.6.11. South Korea
        1. 5.6.11.1. South Korea Market size and forecast, 2019-2026 (USD Million)
        2. 5.6.11.2. South Korea Market size and forecast, 2019-2026 (Kilo Tons)
      12. 5.6.12. South-East Asia
        1. 5.6.12.1. South-East Asia Market size and forecast, 2019-2026 (USD Million)
        2. 5.6.12.2. South-East Asia Market size and forecast, 2019-2026 (Kilo Tons)
      13. 5.6.13. Rest of Asia Pacific
        1. 5.6.13.1. Rest of Asia Pacific Market size and forecast, 2019-2026 (USD Million)
        2. 5.6.13.2. Rest of Asia Pacific Market size and forecast, 2019-2026 (Kilo Tons)
    7. 5.7. Latin America
      1. 5.7.1. Latin America Dyes and Pigments Market size and forecast, 2019-2026
      2. 5.7.2. Latin America Dyes and Pigments Market, by Country, 2019 - 2026 (USD Million)
      3. 5.7.3. Latin America Market size and forecast, 2019-2026 (Kilo Tons)
      4. 5.7.4. Latin America Dyes and Pigments Market, by Country, 2019 - 2026 (Kilo Tons)
      5. 5.7.5. Latin America Dyes and Pigments Market, by Dyes, 2019-2026
        1. 5.7.5.1. Latin America Dyes and Pigments Market, by Dyes, 2019-2026 (USD Million)
        2. 5.7.5.2. Latin America Dyes and Pigments Market, by Dyes, 2019-2026 (Kilo Tons)
      6. 5.7.6. Latin America Dyes and Pigments Market, by Pigments, 2019-2026
        1. 5.7.6.1. Latin America Dyes and Pigments Market, by Pigments, 2019-2026 (USD Million)
        2. 5.7.6.2. Latin America Dyes and Pigments Market, by Pigments, 2019-2026 (Kilo Tons)
      7. 5.7.7. Latin America Dyes and Pigments Market, by Application, 2019-2026
        1. 5.7.7.1. Latin America Dyes and Pigments Market, by Application, 2019-2026 (USD Million)
        2. 5.7.7.2. Latin America Dyes and Pigments Market, by Application, 2019-2026 (Kilo Tons)
      8. 5.7.8. Brazil
        1. 5.7.8.1. Brazil Market size and forecast, 2019-2026 (USD Million)
        2. 5.7.8.2. Brazil Market size and forecast, 2019-2026 (Kilo Tons)
      9. 5.7.9. Mexico
        1. 5.7.9.1. Mexico Market size and forecast, 2019-2026 (USD Million)
        2. 5.7.9.2. Mexico Market size and forecast, 2019-2026 (Kilo Tons)
      10. 5.7.10. Rest of Latin America
        1. 5.7.10.1. Rest of Latin America Market size and forecast, 2019-2026 (USD Million)
        2. 5.7.10.2. Rest of Latin America Market size and forecast, 2019-2026 (Kilo Tons)
    8. 5.8. The Middle-East and Africa
      1. 5.8.1. The Middle-East and Africa Dyes and Pigments Market size and forecast, 2019-2026
      2. 5.8.2. The Middle-East and Africa Dyes and Pigments Market, by Country, 2019 - 2026 (USD Million)
      3. 5.8.3. The Middle-East and Africa Market size and forecast, 2019-2026 (Kilo Tons)
      4. 5.8.4. The Middle-East and Africa Dyes and Pigments Market, by Country, 2019 - 2026 (Kilo Tons)
      5. 5.8.5. The Middle-East and Africa Dyes and Pigments Market, by Dyes, 2019-2026
        1. 5.8.5.1. The Middle-East and Africa Dyes and Pigments Market, by Dyes, 2019-2026 (USD Million)
        2. 5.8.5.2. The Middle-East and Africa Dyes and Pigments Market, by Dyes, 2019-2026 (Kilo Tons)
      6. 5.8.6. The Middle-East and Africa Dyes and Pigments Market, by Pigments, 2019-2026
        1. 5.8.6.1. The Middle-East and Africa Dyes and Pigments Market, by Pigments, 2019-2026 (USD Million)
        2. 5.8.6.2. The Middle-East and Africa Dyes and Pigments Market, by Pigments, 2019-2026 (Kilo Tons)
      7. 5.8.7. The Middle-East and Africa Dyes and Pigments Market, by Application, 2019-2026
        1. 5.8.7.1. The Middle-East and Africa Dyes and Pigments Market, by Application, 2019-2026 (USD Million)
        2. 5.8.7.2. The Middle-East and Africa Dyes and Pigments Market, by Application, 2019-2026 (Kilo Tons)
      8. 5.8.8. GCC Countries
        1. 5.8.8.1. GCC Countries Market size and forecast, 2019-2026 (USD Million)
        2. 5.8.8.2. GCC Countries Market size and forecast, 2019-2026 (Kilo Tons)
      9. 5.8.9. South Africa
        1. 5.8.9.1. South Africa Market size and forecast, 2019-2026 (USD Million)
        2. 5.8.9.2. South Africa Market size and forecast, 2019-2026 (Kilo Tons)
      10. 5.8.10. Rest of Middle-East Africa
        1. 5.8.10.1. Rest of Middle-East Africa Market size and forecast, 2019-2026 (USD Million)
        2. 5.8.10.2. Rest of Middle-East Africa Market size and forecast, 2019-2026 (Kilo Tons)
  6. CHAPTER 6. Dyes and Pigments Production, Consumption, Export, Import by Regions
    1. 6.1. Global Dyes and Pigments production and revenue, 2019-2026 (USD Million) (Kilo Tons)
    2. 6.2. Global Import and Export Analysis, by Region
  7. CHAPTER 7. Dyes and Pigments market – Competitive Landscape
    1. 7.1. Competitor Market Share – Revenue
    2. 7.2. Market Concentration Rate Analysis, Top 3 and Top 5 Players
    3. 7.3. Competitor Market Share – Volume
    4. 7.4. Strategic Development
      1. 7.4.1. Acquisitions and Mergers
      2. 7.4.2. New Products
      3. 7.4.3. Research & Development Activities
  8. CHAPTER 8. Company Profiles
    1. 8.1. BASF SE
      1. 8.1.1. Company Overview
      2. 8.1.2. BASF SE Sales, Revenue, Price, and Gross Margin
      3. 8.1.3. Product portfolio
      4. 8.1.4. Recent initiatives
    2. 8.2. Lanxess AG
      1. 8.2.1. Company Overview
      2. 8.2.2. Lanxess AG Sales, Revenue, Price, and Gross Margin
      3. 8.2.3. Product portfolio
      4. 8.2.4. Recent initiatives
    3. 8.3. Clariant AG
      1. 8.3.1. Company Overview
      2. 8.3.2. Clariant AG Sales, Revenue, Price, and Gross Margin
      3. 8.3.3. Product portfolio
      4. 8.3.4. Recent initiatives
    4. 8.4. Kronos Worldwide Inc.
      1. 8.4.1. Company Overview
      2. 8.4.2. Kronos Worldwide Inc. Sales, Revenue, Price, and Gross Margin
      3. 8.4.3. Product portfolio
      4. 8.4.4. Recent initiatives
    5. 8.5. DIC Corporation
      1. 8.5.1. Company Overview
      2. 8.5.2. DIC Corporation Sales, Revenue, Price, and Gross Margin
      3. 8.5.3. Product portfolio
      4. 8.5.4. Recent initiatives
    6. 8.6. Kiri Industries Ltd.
      1. 8.6.1. Company Overview
      2. 8.6.2. Kiri Industries Ltd. Sales, Revenue, Price, and Gross Margin
      3. 8.6.3. Product portfolio
      4. 8.6.4. Recent initiatives
    7. 8.7. Sudarshan Chemical Industries Limited
      1. 8.7.1. Company Overview
      2. 8.7.2. Sudarshan Chemical Industries Limited Sales, Revenue, Price, and Gross Margin
      3. 8.7.3. Product portfolio
      4. 8.7.4. Recent initiatives
    8. 8.8. Cabot Corp
      1. 8.8.1. Company Overview
      2. 8.8.2. Cabot Corp Sales, Revenue, Price, and Gross Margin
      3. 8.8.3. Product portfolio
      4. 8.8.4. Recent initiatives
    9. 8.9. Huntsman Corporation; Atul Ltd.
      1. 8.9.1. Company Overview
      2. 8.9.2. Huntsman Corporation; Atul Ltd. Sales, Revenue, Price, and Gross Margin
      3. 8.9.3. Product portfolio
      4. 8.9.4. Recent initiatives
  9. CHAPTER 9. Dyes and Pigments — Industry Analysis
    1. 9.1. Introduction and Taxonomy
    2. 9.2. Dyes and Pigments Market – Key Trends
      1. 9.2.1. Market Drivers
      2. 9.2.2. Market Restraints
      3. 9.2.3. Market Opportunities
    3. 9.3. Value Chain Analysis
    4. 9.4. Key Mandates and Regulations
    5. 9.5. Technology Roadmap and Timeline
    6. 9.6. Dyes and Pigments market – Attractiveness Analysis
      1. 9.6.1. By Dyes
      2. 9.6.2. By Pigments
      3. 9.6.3. By Application
      4. 9.6.4. By Region
  10. CHAPTER 10. Raw Material analysis
    1. 10.1. Dyes and Pigments Key Raw Material Analysis
      1. 10.1.1. Key Raw Materials
      2. 10.1.2. Price Trend of Key Raw Materials
    2. 10.2. Key Suppliers of Raw Materials
    3. 10.3. Proportion of Manufacturing Cost Structure
      1. 10.3.1. Raw Materials
      2. 10.3.2. Labor Cost
    4. 10.4. Manufacturing Expenses Analysis of Dyes and Pigments
  11. CHAPTER 11. Industrial Chain, Sourcing Strategy and Downstream Buyers
    1. 11.1. Dyes and Pigments Industrial Chain Analysis
    2. 11.2. Upstream Raw Materials Sourcing
      1. 11.2.1. Risk Mitigation:
      2. 11.2.2. Supplier Relationships:
      3. 11.2.3. Business Processes:
      4. 11.2.4. Securing the Product:
    3. 11.3. Raw Materials Sources of Dyes and Pigments Major Manufacturers in 2016
    4. 11.4. Downstream Buyers
    5. 11.5. Distributors/Traders List
  12. CHAPTER 12. Marketing Strategy Analysis, Distributors
    1. 12.1. Marketing Channel
    2. 12.2. Direct Marketing
    3. 12.3. Indirect Marketing
    4. 12.4. Marketing Channel Development Trend
    5. 12.5. Economic/Political Environmental Change
  13. CHAPTER 13. Report Conclusion
  14. CHAPTER 14. Research Approach & Methodology
    1. 14.1. Report Description
    2. 14.2. Research Scope
    3. 14.3. Research Methodology
      1. 14.3.1. Secondary Research
      2. 14.3.2. Primary Research
      3. 14.3.3. Models
        1. 14.3.3.1. Company Share Analysis Model
        2. 14.3.3.2. Revenue Based Modeling
        3. 14.3.3.3. Research Limitations

        List of Figures

        FIG. 1 Global Dyes and Pigments Market, 2019-2026 (USD Million)
        FIG. 2 Global Dyes and Pigments Market Share, by Dyes, 2019 & 2026 (USD Million)
        FIG. 3 Global Dyes and Pigments Market share, by Dyes, 2019 & 2026 (Kilo Tons)
        FIG. 4 Global Reactive Dyes Dyes and Pigments Market, 2019-2026 (USD Million)
        FIG. 5 Global Reactive Dyes Dyes and Pigments  Market, 2019-2026 (Kilo Tons)
        FIG. 6 Global Disperse Dyes Dyes and Pigments Market, 2019-2026 (USD Million)
        FIG. 7 Global Disperse Dyes Dyes and Pigments  Market, 2019-2026 (Kilo Tons)
        FIG. 8 Global Vat Dyes Dyes and Pigments Market, 2019-2026 (USD Million)
        FIG. 9 Global Vat Dyes Dyes and Pigments  Market, 2019-2026 (Kilo Tons)
        FIG. 10 Global Direct Dyes Dyes and Pigments Market, 2019-2026 (USD Million)
        FIG. 11 Global Direct Dyes Dyes and Pigments  Market, 2019-2026 (Kilo Tons)
        FIG. 12 Global Acid Dyes Dyes and Pigments Market, 2019-2026 (USD Million)
        FIG. 13 Global Acid Dyes Dyes and Pigments  Market, 2019-2026 (Kilo Tons)
        FIG. 14 Global Others Dyes and Pigments Market, 2019-2026 (USD Million)
        FIG. 15 Global Others Dyes and Pigments  Market, 2019-2026 (Kilo Tons)
        FIG. 16 Global Dyes and Pigments Market Share, by Pigments, 2019 & 2026 (USD Million)
        FIG. 17 Global Dyes and Pigments Market share, by Pigments, 2019 & 2026 (Kilo Tons)
        FIG. 18 Global Inorganic Dyes and Pigments Market, 2019-2026 (USD Million)
        FIG. 19 Global Inorganic Dyes and Pigments  Market, 2019-2026 (Kilo Tons)
        FIG. 20 Global Organic Dyes and Pigments Market, 2019-2026 (USD Million)
        FIG. 21 Global Organic Dyes and Pigments  Market, 2019-2026 (Kilo Tons)
        FIG. 22 Global Dyes and Pigments Market Share, by Application, 2019 & 2026 (USD Million)
        FIG. 23 Global Dyes and Pigments Market share, by Application, 2019 & 2026 (Kilo Tons)
        FIG. 24 Global Textile Dyes and Pigments Market, 2019-2026 (USD Million)
        FIG. 25 Global Textile Dyes and Pigments  Market, 2019-2026 (Kilo Tons)
        FIG. 26 Global Construction Dyes and Pigments Market, 2019-2026 (USD Million)
        FIG. 27 Global Construction Dyes and Pigments  Market, 2019-2026 (Kilo Tons)
        FIG. 28 Global Leather Dyes and Pigments Market, 2019-2026 (USD Million)
        FIG. 29 Global Leather Dyes and Pigments  Market, 2019-2026 (Kilo Tons)
        FIG. 30 Global Plastics Dyes and Pigments Market, 2019-2026 (USD Million)
        FIG. 31 Global Plastics Dyes and Pigments  Market, 2019-2026 (Kilo Tons)
        FIG. 32 Global Paper Dyes and Pigments Market, 2019-2026 (USD Million)
        FIG. 33 Global Paper Dyes and Pigments  Market, 2019-2026 (Kilo Tons)
        FIG. 34 Global Paints & Coatings Dyes and Pigments Market, 2019-2026 (USD Million)
        FIG. 35 Global Paints & Coatings Dyes and Pigments  Market, 2019-2026 (Kilo Tons)
        FIG. 36 Global Dyes and Pigments Market Share, by Region, 2019 & 2026
        FIG. 37 Global Dyes and Pigments Market Share, by Region, 2019 & 2026
        FIG. 38 North America Dyes and Pigments Market, 2019-2026
        FIG. 39 North America Dyes and Pigments  Market, 2019-2026 (Kilo Tons)
        FIG. 40 U.S. Dyes and Pigments Market, 2019-2026
        FIG. 41 U.S. Dyes and Pigments  Market, 2019-2026 (Kilo Tons)
        FIG. 42 Canada Dyes and Pigments Market, 2019-2026
        FIG. 43 Canada Dyes and Pigments  Market, 2019-2026 (Kilo Tons)
        FIG. 44 Europe Dyes and Pigments Market, 2019-2026
        FIG. 45 Europe Dyes and Pigments  Market, 2019-2026 (Kilo Tons)
        FIG. 46 Germany Dyes and Pigments Market, 2019-2026
        FIG. 47 Germany Dyes and Pigments  Market, 2019-2026 (Kilo Tons)
        FIG. 48 France Dyes and Pigments Market, 2019-2026
        FIG. 49 France Dyes and Pigments  Market, 2019-2026 (Kilo Tons)
        FIG. 50 U.K. Dyes and Pigments Market, 2019-2026
        FIG. 51 U.K. Dyes and Pigments  Market, 2019-2026 (Kilo Tons)
        FIG. 52 Italy Dyes and Pigments Market, 2019-2026
        FIG. 53 Italy Dyes and Pigments  Market, 2019-2026 (Kilo Tons)
        FIG. 54 Spain Dyes and Pigments Market, 2019-2026
        FIG. 55 Spain Dyes and Pigments  Market, 2019-2026 (Kilo Tons)
        FIG. 56 Rest of Europe Dyes and Pigments Market, 2019-2026
        FIG. 57 Rest of Europe Dyes and Pigments  Market, 2019-2026 (Kilo Tons)
        FIG. 58 Asia Pacific Dyes and Pigments Market, 2019-2026
        FIG. 59 Asia Pacific Dyes and Pigments  Market, 2019-2026 (Kilo Tons)
        FIG. 60 China Dyes and Pigments Market, 2019-2026
        FIG. 61 China Dyes and Pigments  Market, 2019-2026 (Kilo Tons)
        FIG. 62 Japan Dyes and Pigments Market, 2019-2026
        FIG. 63 Japan Dyes and Pigments  Market, 2019-2026 (Kilo Tons)
        FIG. 64 India Dyes and Pigments Market, 2019-2026
        FIG. 65 India Dyes and Pigments  Market, 2019-2026 (Kilo Tons)
        FIG. 66 South  Korea Dyes and Pigments Market, 2019-2026
        FIG. 67 South  Korea Dyes and Pigments  Market, 2019-2026 (Kilo Tons)
        FIG. 68 South-East Asia Dyes and Pigments Market, 2019-2026
        FIG. 69 South-East Asia Dyes and Pigments  Market, 2019-2026 (Kilo Tons)
        FIG. 70 Rest of Asia Pacific Dyes and Pigments Market, 2019-2026
        FIG. 71 Rest of Asia Pacific Dyes and Pigments  Market, 2019-2026 (Kilo Tons)
        FIG. 72 Latin America Dyes and Pigments Market, 2019-2026
        FIG. 73 Latin America Dyes and Pigments  Market, 2019-2026 (Kilo Tons)
        FIG. 74 Brazil Dyes and Pigments Market, 2019-2026
        FIG. 75 Brazil Dyes and Pigments  Market, 2019-2026 (Kilo Tons)
        FIG. 76 Mexico Dyes and Pigments Market, 2019-2026
        FIG. 77 Mexico Dyes and Pigments  Market, 2019-2026 (Kilo Tons)
        FIG. 78 Rest of Latin America Dyes and Pigments Market, 2019-2026
        FIG. 79 Rest of Latin America Dyes and Pigments  Market, 2019-2026 (Kilo Tons)
        FIG. 80 The Middle-East and Africa Dyes and Pigments Market, 2019-2026
        FIG. 81 The Middle-East and Africa Dyes and Pigments  Market, 2019-2026 (Kilo Tons)
        FIG. 82 GCC Countries Dyes and Pigments Market, 2019-2026
        FIG. 83 GCC Countries Dyes and Pigments  Market, 2019-2026 (Kilo Tons)
        FIG. 84 South Africa Dyes and Pigments Market, 2019-2026
        FIG. 85 South Africa Dyes and Pigments  Market, 2019-2026 (Kilo Tons)
        FIG. 86 Rest of Middle-East Africa Dyes and Pigments Market, 2019-2026
        FIG. 87 Rest of Middle-East Africa Dyes and Pigments  Market, 2019-2026 (Kilo Tons)
        FIG. 88 Global Dyes and Pigments production and revenue, 2019-2026 (USD Million) (Kilo Tons)
        FIG. 89 North America Dyes and Pigments production and revenue, 2019-2026 (USD Million) (Kilo Tons)
        FIG. 90 Europe Dyes and Pigments production and revenue, 2019-2026 (USD Million) (Kilo Tons)
        FIG. 91 Asia Pacific Dyes and Pigments production and revenue, 2019-2026 (USD Million) (Kilo Tons)
        FIG. 92 Latin America Dyes and Pigments production and revenue, 2019-2026 (USD Million) (Kilo Tons)
        FIG. 93 Middle East and Africa Dyes and Pigments production and revenue, 2019-2026 (USD Million) (Kilo Tons)
        FIG. 94 Competitor Market Share – Revenue
        FIG. 95 Competitor Market Share – Volume
        FIG. 96 BASF SE Revenue and Growth Rate
        FIG. 97 BASF SE Market Share
        FIG. 98 Lanxess AG Revenue and Growth Rate
        FIG. 99 Lanxess AG Market Share
        FIG. 100 Clariant AG Revenue and Growth Rate
        FIG. 101 Clariant AG Market Share
        FIG. 102 Kronos Worldwide Inc. Revenue and Growth Rate
        FIG. 103 Kronos Worldwide Inc. Market Share
        FIG. 104 DIC Corporation Revenue and Growth Rate
        FIG. 105 DIC Corporation Market Share
        FIG. 106 Kiri Industries Ltd. Revenue and Growth Rate
        FIG. 107 Kiri Industries Ltd. Market Share
        FIG. 108 Sudarshan Chemical Industries Limited Revenue and Growth Rate
        FIG. 109 Sudarshan Chemical Industries Limited Market Share
        FIG. 110 Cabot Corp Revenue and Growth Rate
        FIG. 111 Cabot Corp Market Share
        FIG. 112 Huntsman Corporation; Atul Ltd. Revenue and Growth Rate
        FIG. 113 Huntsman Corporation; Atul Ltd. Market Share
        FIG. 114 Market Dynamics
        FIG. 115 Global Dyes and Pigments – Value Chain Analysis
        FIG. 116 Key Mandates and Regulations
        FIG. 117 Technology Roadmap and Timeline
        FIG. 118 Market Attractiveness Analysis – By Dyes
        FIG. 119 Market Attractiveness Analysis – By Pigments
        FIG. 120 Market Attractiveness Analysis – By Application
        FIG. 121 Market Attractiveness Analysis – By Region
        FIG. 122 Manufacturing Cost Structure of Dyes and Pigments
        FIG. 123 Dyes and Pigments Industrial Chain Analysis
        FIG. 124 Market Channel
        FIG. 125 Marketing Channel Development Trend
        FIG. 126 Growth in World Gross Product, 2008-2019

        List of Tables

        TABLE 1 Global Dyes and Pigments market, 2019 & 2026 (USD Million)
        TABLE 2 Global Dyes and Pigments market, by Dyes, 2019-2026 (USD Million)
        TABLE 3 Global Dyes and Pigments market, by Dyes, 2019-2026 (Kilo Tons)
        TABLE 4 Global Dyes and Pigments market, by Pigments, 2019-2026 (USD Million)
        TABLE 5 Global Dyes and Pigments market, by Pigments, 2019-2026 (Kilo Tons)
        TABLE 6 Global Dyes and Pigments market, by Application, 2019-2026 (USD Million)
        TABLE 7 Global Dyes and Pigments market, by Application, 2019-2026 (Kilo Tons)
        TABLE 8 Global Dyes and Pigments market, by region, 2019-2026 (USD Million)
        TABLE 9 Global Dyes and Pigments market, by region, 2019-2026 (Kilo Tons)
        TABLE 10 North America Dyes and Pigments Market, by Dyes, 2019-2026 (USD Million)
        TABLE 11 North America Dyes and Pigments Market, by Dyes, 2019-2026 (Kilo Tons)
        TABLE 12 North America Dyes and Pigments Market, by Pigments, 2019-2026 (USD Million)
        TABLE 13 North America Dyes and Pigments Market, by Pigments, 2019-2026 (Kilo Tons)
        TABLE 14 North America Dyes and Pigments Market, by Application, 2019-2026 (USD Million)
        TABLE 15 North America Dyes and Pigments Market, by Application, 2019-2026 (Kilo Tons)
        TABLE 16 Europe Dyes and Pigments Market, by Dyes, 2019-2026 (USD Million)
        TABLE 17 Europe Dyes and Pigments Market, by Dyes, 2019-2026 (Kilo Tons)
        TABLE 18 Europe Dyes and Pigments Market, by Pigments, 2019-2026 (USD Million)
        TABLE 19 Europe Dyes and Pigments Market, by Pigments, 2019-2026 (Kilo Tons)
        TABLE 20 Europe Dyes and Pigments Market, by Application, 2019-2026 (USD Million)
        TABLE 21 Europe Dyes and Pigments Market, by Application, 2019-2026 (Kilo Tons)
        TABLE 22 Asia Pacific Dyes and Pigments Market, by Dyes, 2019-2026 (USD Million)
        TABLE 23 Asia Pacific Dyes and Pigments Market, by Dyes, 2019-2026 (Kilo Tons)
        TABLE 24 Asia Pacific Dyes and Pigments Market, by Pigments, 2019-2026 (USD Million)
        TABLE 25 Asia Pacific Dyes and Pigments Market, by Pigments, 2019-2026 (Kilo Tons)
        TABLE 26 Asia Pacific Dyes and Pigments Market, by Application, 2019-2026 (USD Million)
        TABLE 27 Asia Pacific Dyes and Pigments Market, by Application, 2019-2026 (Kilo Tons)
        TABLE 28 Latin America Dyes and Pigments Market, by Dyes, 2019-2026 (USD Million)
        TABLE 29 Latin America Dyes and Pigments Market, by Dyes, 2019-2026 (Kilo Tons)
        TABLE 30 Latin America Dyes and Pigments Market, by Pigments, 2019-2026 (USD Million)
        TABLE 31 Latin America Dyes and Pigments Market, by Pigments, 2019-2026 (Kilo Tons)
        TABLE 32 Latin America Dyes and Pigments Market, by Application, 2019-2026 (USD Million)
        TABLE 33 Latin America Dyes and Pigments Market, by Application, 2019-2026 (Kilo Tons)
        TABLE 34 The Middle-East and Africa Dyes and Pigments Market, by Dyes, 2019-2026 (USD Million)
        TABLE 35 The Middle-East and Africa Dyes and Pigments Market, by Dyes, 2019-2026 (Kilo Tons)
        TABLE 36 The Middle-East and Africa Dyes and Pigments Market, by Pigments, 2019-2026 (USD Million)
        TABLE 37 The Middle-East and Africa Dyes and Pigments Market, by Pigments, 2019-2026 (Kilo Tons)
        TABLE 38 The Middle-East and Africa Dyes and Pigments Market, by Application, 2019-2026 (USD Million)
        TABLE 39 The Middle-East and Africa Dyes and Pigments Market, by Application, 2019-2026 (Kilo Tons)
        TABLE 40 North America Dyes and Pigments Production, Consumption, Export, Import, 2019-2019
        TABLE 41 Europe Dyes and Pigments Production, Consumption, Export, Import, 2019-2019
        TABLE 42 Asia Pacific Dyes and Pigments Production, Consumption, Export, Import, 2019-2019
        TABLE 43 Latin America Dyes and Pigments Production, Consumption, Export, Import, 2019-2019
        TABLE 44 Middle East & Africa Dyes and Pigments Production, Consumption, Export, Import, 2019-2019
        TABLE 45 Global Dyes and Pigments Market - Company Revenue Analysis 2019-2019 (USD Million)
        TABLE 46 Global Dyes and Pigments Market - Company Revenue Share Analysis 2019-2019(%)
        TABLE 47 Global Dyes and Pigments Market - Company Volume Analysis 2019-2019 (Kilo Tons)
        TABLE 48 Global Dyes and Pigments Market - Company Volume Share Analysis 2019-2019(%)
        TABLE 49 Acquisitions and Mergers
        TABLE 50 New Product/Service Launch
        TABLE 51 Research & Development Activities
        TABLE 52 Market Drivers
        TABLE 53 Market Restraints
        TABLE 54 Market Opportunities
        TABLE 55 Production Base and Market Concentration Rate of Raw Material
        TABLE 56 Key Suppliers of Raw Materials
        TABLE 57 Raw Materials Sources of Dyes and Pigments Major Manufacturers in 2016
        TABLE 58 Major Buyers of Dyes and Pigments
        TABLE 59 Distributors/Traders of Dyes and Pigments by Region
        

Industry Major Market Players

  • BASF SE
  •  Lanxess AG
  •  Clariant AG
  •  Kronos Worldwide Inc.
  •  DIC Corporation
  •  Kiri Industries Ltd. 
  •  Sudarshan Chemical Industries Limited
  •  Cabot Corp
  •  Huntsman Corporation; and Atul Ltd