Search Market Research Report

Discover Our Latest Reports
Discover Our Featured Reports
Discover Top Selling Reports

Dry Concrete Market Size, Share Global Analysis Report, 2020–2026

report img

Dry Concrete Market By Type (High-Performance Concrete, Self-Consolidating Concrete, and Others) and By Application (Residential Building, Commercial Building, Industrial Building, and Infrastructure): Global Industry Outlook, Market Size, Business Intelligence, Consumer Preferences, Statistical Surveys, Comprehensive Analysis, Historical Developments, Current Trends, and Forecast 2020–2026

Industry Insights

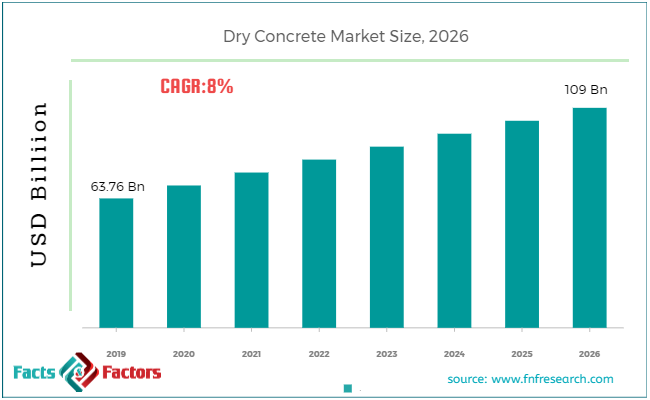
According to the report published by Facts & Factors, the global Dry Concrete market size was worth around USD 63.76 billion in 2019 and is predicted to grow around USD 109 billion by 2026 with a compound annual growth rate (CAGR) of roughly 8% between 2020 and 2026.

The dry concrete market report analyzes and notifies the industry statistics at the global as well as regional and country levels in order to acquire a thorough perspective of the entire dry concrete market. The historical and past insights are provided for FY 2016 to FY 2019 whereas projected trends are delivered for FY 2020 to FY 2026. The quantitative and numerical data is represented in value (USD Billion) and volume (Million Tons) from FY 2016 – 2026.

This specialized and expertise-oriented industry research report scrutinizes the technical and commercial business outlook of the dry concrete industry. The report analyzes and declares the historical and current trends analysis of the dry concrete industry and subsequently recommends the projected trends anticipated to be observed in the dry concrete market during the upcoming years.

Dry Concrete Market Size

To know more about this report | Request Free Sample Copy

logoKey Insights from Primary Research

  • After conducting primary research with industry experts, our analysts have estimated that the global dry concrete market is predicted to reach a market value of USD 109 billion in 2026 while registering a CAGR of nearly 8%.
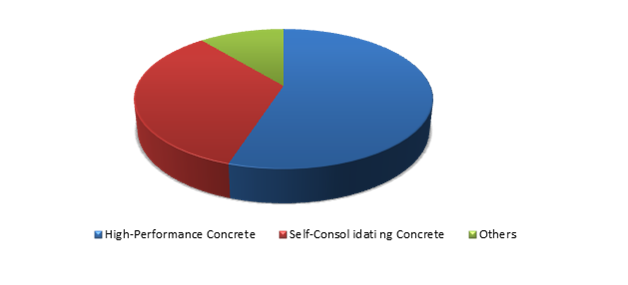
  • According to our primary respondents, the high-performance concrete segment dominated the global dry concrete market in 2019, the rising demand for the high-performance dry concrete market is due to an increase in the number of residential skyscrapers in urban areas which has influenced construction companies to opt for high-performance concrete.
  • Our primary interviewee also predicted the amount of high-performance dry concrete consumed in 2019 was approximately 340 million tons and is expected to reach a value of 575 million tons in 2026. 
  • On the basis of types, the self-consolidating dry concrete market was valued at approximately USD 22 billion in 2019 and is predicted to grow to record a CAGR of nearly 9% over the projected period.
  • The Asia Pacific dominated the global dry concrete market in 2019 while being valued at around 24 billion in 2019 and is expected to have the fastest growth over the projected period.

logoKey Recommendations from Analysts

  • According to our analysts, the growth in the global construction industry due to the rise in urbanization and soaring demand for necessary investment has been a key factor that has fueled the global dry concrete market.
  • According to our analysts, on the basis of geography, the North American region segment significantly contributed to the global dry concrete market in 2019. Soaring growth in commercial construction activities in the United States of America and Canada has contributed to the growth of the North American dry concrete market.
  • The demand for dry concrete is also bolstered by soaring investment in developing city infrastructure. Developing economies are expected to contribute significantly to market growth.
  • Our analysts also predict a significant rise in demand for the dry concrete markets from Europe. In terms of volume, the Europe dry concrete market was valued at nearly 150 million tons in 2019.
  • Dry concrete consumption in Asia pacific for residential buildings was around 80 million tons and revenue generated from Asia Pacific dry concrete for residential buildings was nearly USD 7 billion in 2019.

logoGlobal Dry Concrete Sales Volume Market Share (%) by Types in 2019

Dry Concrete Market

To know more about this report | Request Free Sample Copy

The quantitative data is further underlined and reinforced by comprehensive qualitative data which comprises various across-the-board market dynamics. The rationales which directly or indirectly impact the dry concrete industry are exemplified through parameters such as growth drivers, restraints, challenges, and opportunities among other impacting factors.

Throughout our research report, we have encompassed all the proven models and tools of industry analysis and extensively illustrated all the key business strategies and business models adopted in the dry concrete industry. The report provides an all-inclusive and detailed competitive landscape prevalent in the dry concrete market.

The report utilizes established industry analysis tools and models such as Porter’s Five Forces framework to analyze and recognize critical business strategies adopted by various stakeholders involved in the entire value chain of the dry concrete industry. The dry concrete market report additionally employs SWOT analysis and PESTLE analysis models for further in-depth analysis.

The report study further includes an in-depth analysis of industry players' market shares and provides an overview of leading players' market positions in the dry concrete sector. Key strategic developments in the dry concrete market competitive landscape such as acquisitions & mergers, inaugurations of different products and services, partnerships & joint ventures, MoU agreements, VC & funding activities, R&D activities, and geographic expansion among other noteworthy activities by key players of the dry concrete market are appropriately highlighted in the report.

Dry concrete is primarily used for offering suitable conditions to concrete to achieve a moisture condition for its intended use. Dry concrete is used for reducing shrinkage, increasing the strength of the structure, lowering water permeability, reduce hydrostatic pressures, etc. Apart from its uses in residential and commercial buildings, dry concrete is also used for the construction of sidewalks, building foundations, pavements, fence holes, etc. For dry-cast concrete, wet troweling is not required. Surface finishes and special shape requirements can be done by using hand tools. Other advantages offered by dry concrete over wet concrete is that dry concrete offers higher strength, reduced overall cost of construction, and fast curing rates.

A key factor that has wider adoption of dry concrete around the world is the rising commercial and residential construction market. In recent years, population growth in developing countries, especially in China and India, has augmented the demand for apartments, bungalows, etc., which has led to an increase in the consumption of dry concrete for residential applications. Further, rising investments in developing the necessary infrastructure have also fueled the dry concrete market. Moreover, rising investment in commercial and infrastructure construction activity is likely to create new avenues for the global dry concrete market.

The dry concrete market research report delivers an acute valuation and taxonomy of the dry concrete industry by practically splitting the market on the basis of different types, applications, and regions. Through the analysis of the historical and projected trends, all the segments and sub-segments were evaluated through the bottom-up approach, and different market sizes have been projected for FY 2020 to FY 2026. The regional segmentation of the dry concrete industry includes the complete classification of all the major continents including North America, Latin America, Europe, Asia Pacific, and the Middle East & Africa. Further, country-wise data for the dry concrete industry is provided for the leading economies of the world.

The dry concrete market is segmented based on type and application.  On the basis of type segmentation, the market is classified into high-performance concrete, self-consolidating concrete, and others. In terms of application segmentation, the market is bifurcated into residential buildings, commercial buildings, industrial buildings, and infrastructure.

logoReport Scope

Report Attribute

Details

Market Size in 2019

USD 63.76 Billion

Projected Market Size in 2026

USD 109 Billion

CAGR Growth Rate

8% CAGR

Base Year

2019

Forecast Years

2020-2026

Key Market Players

Wieser Concrete, Sika Corporation, Hannibal Concrete Products, Shope Concrete, FP McCann, ACP Limited, US Concrete Products, Standard Concrete, Rochester Concrete Products, Utility Concrete Products, MST Concrete Products Inc., Abbotsford Concrete Products, United Concrete Products, and others.

Key Segment

By Application, Type, and Region

Major Regions Covered

North America, Europe, Asia Pacific, Latin America, and the Middle East &, Africa

Purchase Options

Request customized purchase options to meet your research needs. Explore purchase options

logoSome of the essential players operating in the dry concrete market, but not restricted include:

  •  US Concrete Products
  •  Sika Corporation
  •  Rochester Concrete Products
  •  Shope Concrete
  •  MST Concrete Products Inc.
  •  United Concrete Products
  •  FP McCann
  •  Standard Concrete
  •  ACP Limited
  •  Utility Concrete Products
  •  Wieser Concrete
  •  Abbotsford Concrete Products
  •  Hannibal Concrete Products

The taxonomy of the dry concrete industry by its scope and segmentation is as follows:

logo By Type Segmentation Analysis

  • High-performance Concrete
  • Self-consolidating Concrete
  • Others

logo By Application Segmentation Analysis

  • Residential Building
  • Commercial Building
  • Industrial Building
  • Infrastructure

logo Regional Segmentation Analysis

  • North America
    • The U.S.
    • Canada
  • Europe
    • France
    • The UK
    • Spain
    • Germany
    • Italy
    • Rest of Europe
  • Asia Pacific
    • China
    • Japan
    • India
    • South Korea
    • Southeast Asia
    • Rest of Asia Pacific
  • Latin America
    • Brazil
    • Mexico
    • Rest of Latin America
  • Middle East & Africa
    • GCC
    • South Africa
    • Rest of the Middle East & Africa

logoKEY BUSINESS POINTERS ADDRESSED & FOREMOST REASONS TO PROCURE THE REPORT:

  • Statistical Analysis of the Past, Current, and Future Trends of the Industry with Validated Market Sizes Data
  • Direct and Indirect Rationales Impacting the Industry
  • In-depth and Micro Analysis of Viable Segments and Sub-segments
  • Companies and Vendors Market Share, Competitive Landscape, and Player Positioning Analysis
  • Demand Side (Consumption) and Supply Side (Production) Perspective and Analysis wherever applicable
  • Key Buyers and End-Users Analysis
  • Value Chain and Manufacturing Cost Structure Analysis wherever relevant
  • Key Marketing Strategies as well as Key Sales Channels adopted in the market
  • Investment Opportunity Analysis & Patents Analysis wherever feasible
  • Technological Road Map & Technical Analysis
  • Robust Research Methodology comprising a dynamic mix (65%~35%) of Extensive Primary Research (primary interviews, ad-hoc surveys, questionnaires) and Protracted Secondary Research (proprietary in-house database, paid external databases, publically available validated sources)

Table of Content

  1. CHAPTER 1. Executive Summary
  2. CHAPTER 2. Dry Concrete market – Type Analysis
    1. 2.1. Global Dry Concrete Market – Type Overview
    2. 2.2. Global Dry Concrete Market Share, by Type, 2019&2026 (USD Billion)
    3. 2.3. Global Dry Concrete Market share, by Type, 2019&2026 (Million Tons)
    4. 2.4. High-performance Concrete
      1. 2.4.1. Global High-performance Concrete Dry Concrete Market, 2016-2026 (USD Billion)
      2. 2.4.2. Global High-performance Concrete Dry Concrete Market, 2016-2026 (Million Tons)
    5. 2.5. Self-consolidating Concrete
      1. 2.5.1. Global Self-consolidating Concrete Dry Concrete Market, 2016-2026 (USD Billion)
      2. 2.5.2. Global Self-consolidating Concrete Dry Concrete Market, 2016-2026 (Million Tons)
    6. 2.6. Others
      1. 2.6.1. Global Others Dry Concrete Market, 2016-2026 (USD Billion)
      2. 2.6.2. Global Others Dry Concrete Market, 2016-2026 (Million Tons)
  3. CHAPTER 3. Dry Concrete market – Applications Analysis
    1. 3.1. Global Dry Concrete Market – Applications Overview
    2. 3.2. Global Dry Concrete Market Share, by Applications, 2019&2026 (USD Billion)
    3. 3.3. Global Dry Concrete Market share, by Applications, 2019&2026 (Million Tons)
    4. 3.4. Residential Building
      1. 3.4.1. Global Residential Building Dry Concrete Market, 2016-2026 (USD Billion)
      2. 3.4.2. Global Residential Building Dry Concrete Market, 2016-2026 (Million Tons)
    5. 3.5. Commercial Building
      1. 3.5.1. Global Commercial Building Dry Concrete Market, 2016-2026 (USD Billion)
      2. 3.5.2. Global Commercial Building Dry Concrete Market, 2016-2026 (Million Tons)
    6. 3.6. Industrial Building
      1. 3.6.1. Global Industrial Building Dry Concrete Market, 2016-2026 (USD Billion)
      2. 3.6.2. Global Industrial Building Dry Concrete Market, 2016-2026 (Million Tons)
    7. 3.7. Infrastructure
      1. 3.7.1. Global Infrastructure Dry Concrete Market, 2016-2026 (USD Billion)
      2. 3.7.2. Global Infrastructure Dry Concrete Market, 2016-2026 (Million Tons)
  4. CHAPTER 4. Dry Concrete market – Regional Analysis
    1. 4.1. Global Dry Concrete Market Regional Overview
    2. 4.2. Global Dry Concrete Market Share, by Region, 2019&2026 (Value)
    3. 4.3. Global Dry Concrete Market Share, by Region, 2019&2026 (Volume)
    4. 4.4. North America
      1. 4.4.1. North America Dry Concrete Market size and forecast, 2016-2026
      2. 4.4.2. North America Dry Concrete Market, by Country, 2019 - 2026 (USD Billion)
      3. 4.4.3. North America Market size and forecast, 2016-2026 (Million Tons)
      4. 4.4.4. North America Dry Concrete Market, by Country, 2019 - 2026 (Million Tons)
      5. 4.4.5. North America Dry Concrete Market, by Type, 2016-2026
        1. 4.4.5.1. North America Dry Concrete Market, by Type, 2016-2026 (USD Billion)
        2. 4.4.5.2. North America Dry Concrete Market, by Type, 2016-2026 (Million Tons)
      6. 4.4.6. North America Dry Concrete Market, by Applications, 2016-2026
        1. 4.4.6.1. North America Dry Concrete Market, by Applications, 2016-2026 (USD Billion)
        2. 4.4.6.2. North America Dry Concrete Market, by Applications, 2016-2026 (Million Tons)
      7. 4.4.7. U.S.
        1. 4.4.7.1. U.S. Market size and forecast, 2016-2026 (USD Billion)
        2. 4.4.7.2. U.S. Market size and forecast, 2016-2026 (Million Tons)
      8. 4.4.8. Canada
        1. 4.4.8.1. Canada Market size and forecast, 2016-2026 (USD Billion)
        2. 4.4.8.2. Canada Market size and forecast, 2016-2026 (Million Tons)
    5. 4.5. Europe
      1. 4.5.1. Europe Dry Concrete Market size and forecast, 2016-2026
      2. 4.5.2. Europe Dry Concrete Market, by Country, 2019 - 2026 (USD Billion)
      3. 4.5.3. Europe Market size and forecast, 2016-2026 (Million Tons)
      4. 4.5.4. Europe Dry Concrete Market, by Country, 2019 - 2026 (Million Tons)
      5. 4.5.5. Europe Dry Concrete Market, by Type, 2016-2026
        1. 4.5.5.1. Europe Dry Concrete Market, by Type, 2016-2026 (USD Billion)
        2. 4.5.5.2. Europe Dry Concrete Market, by Type, 2016-2026 (Million Tons)
      6. 4.5.6. Europe Dry Concrete Market, by Applications, 2016-2026
        1. 4.5.6.1. Europe Dry Concrete Market, by Applications, 2016-2026 (USD Billion)
        2. 4.5.6.2. Europe Dry Concrete Market, by Applications, 2016-2026 (Million Tons)
      7. 4.5.7. Germany
        1. 4.5.7.1. Germany Market size and forecast, 2016-2026 (USD Billion)
        2. 4.5.7.2. Germany Market size and forecast, 2016-2026 (Million Tons)
      8. 4.5.8. France
        1. 4.5.8.1. France Market size and forecast, 2016-2026 (USD Billion)
        2. 4.5.8.2. France Market size and forecast, 2016-2026 (Million Tons)
      9. 4.5.9. U.K.
        1. 4.5.9.1. U.K. Market size and forecast, 2016-2026 (USD Billion)
        2. 4.5.9.2. U.K. Market size and forecast, 2016-2026 (Million Tons)
      10. 4.5.10. Italy
        1. 4.5.10.1. Italy Market size and forecast, 2016-2026 (USD Billion)
        2. 4.5.10.2. Italy Market size and forecast, 2016-2026 (Million Tons)
      11. 4.5.11. Spain
        1. 4.5.11.1. Spain Market size and forecast, 2016-2026 (USD Billion)
        2. 4.5.11.2. Spain Market size and forecast, 2016-2026 (Million Tons)
      12. 4.5.12. Rest of Europe
        1. 4.5.12.1. Rest of Europe Market size and forecast, 2016-2026 (USD Billion)
        2. 4.5.12.2. Rest of Europe Market size and forecast, 2016-2026 (Million Tons)
    6. 4.6. Asia Pacific
      1. 4.6.1. Asia Pacific Dry Concrete Market size and forecast, 2016-2026
      2. 4.6.2. Asia Pacific Dry Concrete Market, by Country, 2019 - 2026 (USD Billion)
      3. 4.6.3. Asia Pacific Market size and forecast, 2016-2026 (Million Tons)
      4. 4.6.4. Asia Pacific Dry Concrete Market, by Country, 2019 - 2026 (Million Tons)
      5. 4.6.5. Asia Pacific Dry Concrete Market, by Type, 2016-2026
        1. 4.6.5.1. Asia Pacific Dry Concrete Market, by Type, 2016-2026 (USD Billion)
        2. 4.6.5.2. Asia Pacific Dry Concrete Market, by Type, 2016-2026 (Million Tons)
      6. 4.6.6. Asia Pacific Dry Concrete Market, by Applications, 2016-2026
        1. 4.6.6.1. Asia Pacific Dry Concrete Market, by Applications, 2016-2026 (USD Billion)
        2. 4.6.6.2. Asia Pacific Dry Concrete Market, by Applications, 2016-2026 (Million Tons)
      7. 4.6.7. China
        1. 4.6.7.1. China Market size and forecast, 2016-2026 (USD Billion)
        2. 4.6.7.2. China Market size and forecast, 2016-2026 (Million Tons)
      8. 4.6.8. Japan
        1. 4.6.8.1. Japan Market size and forecast, 2016-2026 (USD Billion)
        2. 4.6.8.2. Japan Market size and forecast, 2016-2026 (Million Tons)
      9. 4.6.9. India
        1. 4.6.9.1. India Market size and forecast, 2016-2026 (USD Billion)
        2. 4.6.9.2. India Market size and forecast, 2016-2026 (Million Tons)
      10. 4.6.10. South Korea
        1. 4.6.10.1. South Korea Market size and forecast, 2016-2026 (USD Billion)
        2. 4.6.10.2. South Korea Market size and forecast, 2016-2026 (Million Tons)
      11. 4.6.11. South-East Asia
        1. 4.6.11.1. South-East Asia Market size and forecast, 2016-2026 (USD Billion)
        2. 4.6.11.2. South-East Asia Market size and forecast, 2016-2026 (Million Tons)
      12. 4.6.12. Rest of Asia Pacific
        1. 4.6.12.1. Rest of Asia Pacific Market size and forecast, 2016-2026 (USD Billion)
        2. 4.6.12.2. Rest of Asia Pacific Market size and forecast, 2016-2026 (Million Tons)
    7. 4.7. Latin America
      1. 4.7.1. Latin America Dry Concrete Market size and forecast, 2016-2026
      2. 4.7.2. Latin America Dry Concrete Market, by Country, 2019 - 2026 (USD Billion)
      3. 4.7.3. Latin America Market size and forecast, 2016-2026 (Million Tons)
      4. 4.7.4. Latin America Dry Concrete Market, by Country, 2019 - 2026 (Million Tons)
      5. 4.7.5. Latin America Dry Concrete Market, by Type, 2016-2026
        1. 4.7.5.1. Latin America Dry Concrete Market, by Type, 2016-2026 (USD Billion)
        2. 4.7.5.2. Latin America Dry Concrete Market, by Type, 2016-2026 (Million Tons)
      6. 4.7.6. Latin America Dry Concrete Market, by Applications, 2016-2026
        1. 4.7.6.1. Latin America Dry Concrete Market, by Applications, 2016-2026 (USD Billion)
        2. 4.7.6.2. Latin 4.7.9. Rest of Latin America
        3. 4.7.9.1. Rest of Latin America Market size and forecast, 2016-2026 (USD Billion)
        4. 4.7.9.2. Rest of Latin America Market size and forecast, 2016-2026 (Million Tons)
    8. 4.8. The Middle-East and Africa
      1. 4.8.1. The Middle-East and Africa Dry Concrete Market size and forecast, 2016-2026
      2. 4.8.2. The Middle-East and Africa Dry Concrete Market, by Country, 2019 - 2026 (USD Billion)
      3. 4.8.3. The Middle-East and Africa Market size and forecast, 2016-2026 (Million Tons)
      4. 4.8.4. The Middle-East and Africa Dry Concrete Market, by Country, 2019 - 2026 (Million Tons)
      5. 4.8.5. The Middle-East and Africa Dry Concrete Market, by Type, 2016-2026
        1. 4.8.5.1. The Middle-East and Africa Dry Concrete Market, by Type, 2016-2026 (USD Billion)
        2. 4.8.5.2. The Middle-East and Africa Dry Concrete Market, by Type, 2016-2026 (Million Tons)
      6. 4.8.6. The Middle-East and Africa Dry Concrete Market, by Applications, 2016-2026
        1. 4.8.6.1. The Middle-East and Africa Dry Concrete Market, by Applications, 2016-2026 (USD Billion)
        2. 4.8.6.2. The Middle-East and Africa Dry Concrete Market, by Applications, 2016-2026 (Million Tons)
      7. 4.8.7. GCC Countries
        1. 4.8.7.1. GCC Countries Market size and forecast, 2016-2026 (USD Billion)
        2. 4.8.7.2. GCC Countries Market size and forecast, 2016-2026 (Million Tons)
      8. 4.8.8. South Africa
        1. 4.8.8.1. South Africa Market size and forecast, 2016-2026 (USD Billion)
        2. 4.8.8.2. South Africa Market size and forecast, 2016-2026 (Million Tons)
      9. 4.8.9. Rest of Middle-East Africa
        1. 4.8.9.1. Rest of Middle-East Africa Market size and forecast, 2016-2026 (USD Billion)
        2. 4.8.9.2. Rest of Middle-East Africa Market size and forecast, 2016-2026 (Million Tons)
  5. CHAPTER 5. Dry Concrete Production, Consumption, Export, Import by Regions
    1. 5.1. Global Dry Concrete production and revenue, 2016-2026 (USD Billion) (Million Tons)
    2. 5.2. Global Import and Export Analysis, by Region
  6. CHAPTER 6. Dry Concrete market – Competitive Landscape
    1. 6.1. Competitor Market Share – Revenue
    2. 6.2. Market Concentration Rate Analysis, Top 3 and Top 5 Players
    3. 6.3. Competitor Market Share – Volume
    4. 6.4. Strategic Development
      1. 6.4.1. Acquisitions and Mergers
      2. 6.4.2. New Products
      3. 6.4.3. Research & Development Activities
  7. CHAPTER 7. Company Profiles
    1. 7.1. US Concrete Products
      1. 7.1.1. Company Overview
      2. 7.1.2. US Concrete Products Sales, Revenue, Price, and Gross Margin
      3. 7.1.3. Product portfolio
      4. 7.1.4. Recent initiatives
    2. 7.2. Sika Corporation
      1. 7.2.1. Company Overview
      2. 7.2.2. Sika Corporation Sales, Revenue, Price, and Gross Margin
      3. 7.2.3. Product portfolio
      4. 7.2.4. Recent initiatives
    3. 7.3. Rochester Concrete Products
      1. 7.3.1. Company Overview
      2. 7.3.2. Rochester Concrete Products Sales, Revenue, Price, and Gross Margin
      3. 7.3.3. Product portfolio
      4. 7.3.4. Recent initiatives
    4. 7.4. Shope Concrete
      1. 7.4.1. Company Overview
      2. 7.4.2. Shope Concrete Sales, Revenue, Price, and Gross Margin
      3. 7.4.3. Product portfolio
      4. 7.4.4. Recent initiatives
    5. 7.5. MST Concrete Products Inc.
      1. 7.5.1. Company Overview
      2. 7.5.2. MST Concrete Products Inc. Sales, Revenue, Price, and Gross Margin
      3. 7.5.3. Product portfolio
      4. 7.5.4. Recent initiatives
    6. 7.6. United Concrete Products
      1. 7.6.1. Company Overview
      2. 7.6.2. United Concrete Products Sales, Revenue, Price, and Gross Margin
      3. 7.6.3. Product portfolio
      4. 7.6.4. Recent initiatives
    7. 7.7. FP McCann
      1. 7.7.1. Company Overview
      2. 7.7.2. FP McCann Sales, Revenue, Price, and Gross Margin
      3. 7.7.3. Product portfolio
      4. 7.7.4. Recent initiatives
    8. 7.8. Standard Concrete
      1. 7.8.1. Company Overview
      2. 7.8.2. Standard Concrete Sales, Revenue, Price, and Gross Margin
      3. 7.8.3. Product portfolio
      4. 7.8.4. Recent initiatives
    9. 7.9. ACP Limited
      1. 7.9.1. Company Overview
      2. 7.9.2. ACP Limited Sales, Revenue, Price, and Gross Margin
      3. 7.9.3. Product portfolio
      4. 7.9.4. Recent initiatives
    10. 7.10. Utility Concrete Products
      1. 7.10.1. Company Overview
      2. 7.10.2. Utility Concrete Products Sales, Revenue, Price, and Gross Margin
      3. 7.10.3. Product portfolio
      4. 7.10.4. Recent initiatives
    11. 7.11. Wieser Concrete
      1. 7.11.1. Company Overview
      2. 7.11.2. Wieser Concrete Sales, Revenue, Price, and Gross Margin
      3. 7.11.3. Product portfolio
      4. 7.11.4. Recent initiatives
    12. 7.12. Abbotsford Concrete Products
      1. 7.12.1. Company Overview
      2. 7.12.2. Abbotsford Concrete Products Sales, Revenue, Price, and Gross Margin
      3. 7.12.3. Product portfolio
      4. 7.12.4. Recent initiatives
    13. 7.13. Hannibal Concrete Products
      1. 7.13.1. Company Overview
      2. 7.13.2. Hannibal Concrete Products Sales, Revenue, Price, and Gross Margin
      3. 7.13.3. Product portfolio
      4. 7.13.4. Recent initiatives
  8. CHAPTER 8. Dry Concrete — Industry Analysis
    1. 8.1. Introduction and Taxonomy
    2. 8.2. Dry Concrete Market – Key Trends
      1. 8.2.1. Market Drivers
      2. 8.2.2. Market Restraints
      3. 8.2.3. Market Opportunities
    3. 8.3. Value Chain Analysis
    4. 8.4. Key Mandates and Regulations
    5. 8.5. Technology Roadmap and Timeline
    6. 8.6. Dry Concrete market – Attractiveness Analysis
      1. 8.6.1. By Type
      2. 8.6.2. By Applications
      3. 8.6.3. By Region
  9. CHAPTER 9. Raw Material analysis
    1. 9.1. Dry Concrete Key Raw Material Analysis
      1. 9.1.1. Key Raw Materials
      2. 9.1.2. Price Trend of Key Raw Materials
    2. 9.2. Key Suppliers of Raw Materials
    3. 9.3. Proportion of Manufacturing Cost Structure
      1. 9.3.1. Raw Materials
      2. 9.3.2. Labor Cost
    4. 9.4. Manufacturing Expenses Analysis of Dry Concrete
  10. CHAPTER 10. Industrial Chain, Sourcing Strategy and Downstream Buyers
    1. 10.1. Dry Concrete Industrial Chain Analysis
    2. 10.2. Upstream Raw Materials Sourcing
      1. 10.2.1. Risk Mitigation:
      2. 10.2.2. Supplier Relationships:
      3. 10.2.3. Business Processes:
      4. 10.2.4. Securing the Product:
    3. 10.3. Raw Materials Sources of Dry Concrete Major Manufacturers in 2016
    4. 10.4. Downstream Buyers
    5. 10.5. Distributors/Traders List
  11. CHAPTER 11. Marketing Strategy Analysis, Distributors
    1. 11.1. Marketing Channel
    2. 11.2. Direct Marketing
    3. 11.3. Indirect Marketing
    4. 11.4. Marketing Channel Development Trend
    5. 11.5. Economic/Political Environmental Change
  12. CHAPTER 12. Report Conclusion
  13. CHAPTER 13. Research Approach & Methodology
    1. 13.1. Report Description
    2. 13.2. Research Scope
    3. 13.3. Research Methodology
      1. 13.3.1. Secondary Research
      2. 13.3.2. Primary Research
      3. 13.3.3. Models
        1. 13.3.3.1. Company Share Analysis Model
        2. 13.3.3.2. Revenue Based Modeling
        3. 13.3.3.3. Research LimitationsAmerica Dry Concrete Market, by Applications, 2016-2026 (Million Tons)
      4. 4.7.7. Brazil
        1. 4.7.7.1. Brazil Market size and forecast, 2016-2026 (USD Billion)
        2. 4.7.7.2. Brazil Market size and forecast, 2016-2026 (Million Tons)
      5. 4.7.8. Mexico
        1. 4.7.8.1. Mexico Market size and forecast, 2016-2026 (USD Billion)
        2. 4.7.8.2. Mexico Market size and forecast, 2016-2026 (Million Tons)

        List of Figures

        FIG. 1 Global Dry Concrete Market, 2016-2026 (USD Billion)
        FIG. 2 Global Dry Concrete Market Share, by Type, 2019&2026 (USD Billion)
        FIG. 3 Global Dry Concrete Market share, by Type, 2019&2026 (Million Tons)
        FIG. 4 Global High-performance Concrete Dry Concrete Market, 2016-2026 (USD Billion)
        FIG. 5 Global High-performance Concrete Dry Concrete  Market, 2016-2026 (Million Tons)
        FIG. 6 Global Self-consolidating Concrete Dry Concrete Market, 2016-2026 (USD Billion)
        FIG. 7 Global Self-consolidating Concrete Dry Concrete  Market, 2016-2026 (Million Tons)
        FIG. 8 Global Others Dry Concrete Market, 2016-2026 (USD Billion)
        FIG. 9 Global Others Dry Concrete  Market, 2016-2026 (Million Tons)
        FIG. 10 Global Dry Concrete Market Share, by Applications, 2019&2026 (USD Billion)
        FIG. 11 Global Dry Concrete Market share, by Applications, 2019&2026 (Million Tons)
        FIG. 12 Global Residential Building Dry Concrete Market, 2016-2026 (USD Billion)
        FIG. 13 Global Residential Building Dry Concrete  Market, 2016-2026 (Million Tons)
        FIG. 14 Global Commercial Building Dry Concrete Market, 2016-2026 (USD Billion)
        FIG. 15 Global Commercial Building Dry Concrete  Market, 2016-2026 (Million Tons)
        FIG. 16 Global Industrial Building Dry Concrete Market, 2016-2026 (USD Billion)
        FIG. 17 Global Industrial Building Dry Concrete  Market, 2016-2026 (Million Tons)
        FIG. 18 Global Infrastructure Dry Concrete Market, 2016-2026 (USD Billion)
        FIG. 19 Global Infrastructure Dry Concrete  Market, 2016-2026 (Million Tons)
        FIG. 20 Global Dry Concrete Market Share, by Region, 2019&2026
        FIG. 21 Global Dry Concrete Market Share, by Region, 2019&2026
        FIG. 22 North America Dry Concrete Market, 2016-2026
        FIG. 23 North America Dry Concrete  Market, 2016-2026 (Million Tons)
        FIG. 24 U.S. Dry Concrete Market, 2016-2026
        FIG. 25 U.S. Dry Concrete  Market, 2016-2026 (Million Tons)
        FIG. 26 Canada Dry Concrete Market, 2016-2026
        FIG. 27 Canada Dry Concrete  Market, 2016-2026 (Million Tons)
        FIG. 28 Europe Dry Concrete Market, 2016-2026
        FIG. 29 Europe Dry Concrete  Market, 2016-2026 (Million Tons)
        FIG. 30 Germany Dry Concrete Market, 2016-2026
        FIG. 31 Germany Dry Concrete  Market, 2016-2026 (Million Tons)
        FIG. 32 France Dry Concrete Market, 2016-2026
        FIG. 33 France Dry Concrete  Market, 2016-2026 (Million Tons)
        FIG. 34 U.K. Dry Concrete Market, 2016-2026
        FIG. 35 U.K. Dry Concrete  Market, 2016-2026 (Million Tons)
        FIG. 36 Italy Dry Concrete Market, 2016-2026
        FIG. 37 Italy Dry Concrete  Market, 2016-2026 (Million Tons)
        FIG. 38 Spain Dry Concrete Market, 2016-2026
        FIG. 39 Spain Dry Concrete  Market, 2016-2026 (Million Tons)
        FIG. 40 Rest of Europe Dry Concrete Market, 2016-2026
        FIG. 41 Rest of Europe Dry Concrete  Market, 2016-2026 (Million Tons)
        FIG. 42 Asia Pacific Dry Concrete Market, 2016-2026
        FIG. 43 Asia Pacific Dry Concrete  Market, 2016-2026 (Million Tons)
        FIG. 44 China Dry Concrete Market, 2016-2026
        FIG. 45 China Dry Concrete  Market, 2016-2026 (Million Tons)
        FIG. 46 Japan Dry Concrete Market, 2016-2026
        FIG. 47 Japan Dry Concrete  Market, 2016-2026 (Million Tons)
        FIG. 48 India Dry Concrete Market, 2016-2026
        FIG. 49 India Dry Concrete  Market, 2016-2026 (Million Tons)
        FIG. 50 South  Korea Dry Concrete Market, 2016-2026
        FIG. 51 South  Korea Dry Concrete  Market, 2016-2026 (Million Tons)
        FIG. 52 South-East Asia Dry Concrete Market, 2016-2026
        FIG. 53 South-East Asia Dry Concrete  Market, 2016-2026 (Million Tons)
        FIG. 54 Rest of Asia Pacific Dry Concrete Market, 2016-2026
        FIG. 55 Rest of Asia Pacific Dry Concrete  Market, 2016-2026 (Million Tons)
        FIG. 56 Latin America Dry Concrete Market, 2016-2026
        FIG. 57 Latin America Dry Concrete  Market, 2016-2026 (Million Tons)
        FIG. 58 Brazil Dry Concrete Market, 2016-2026
        FIG. 59 Brazil Dry Concrete  Market, 2016-2026 (Million Tons)
        FIG. 60 Mexico Dry Concrete Market, 2016-2026
        FIG. 61 Mexico Dry Concrete  Market, 2016-2026 (Million Tons)
        FIG. 62 Rest of Latin America Dry Concrete Market, 2016-2026
        FIG. 63 Rest of Latin America Dry Concrete  Market, 2016-2026 (Million Tons)
        FIG. 64 The Middle-East and Africa Dry Concrete Market, 2016-2026
        FIG. 65 The Middle-East and Africa Dry Concrete  Market, 2016-2026 (Million Tons)
        FIG. 66 GCC Countries Dry Concrete Market, 2016-2026
        FIG. 67 GCC Countries Dry Concrete  Market, 2016-2026 (Million Tons)
        FIG. 68 South Africa Dry Concrete Market, 2016-2026
        FIG. 69 South Africa Dry Concrete  Market, 2016-2026 (Million Tons)
        FIG. 70 Rest of Middle-East Africa Dry Concrete Market, 2016-2026
        FIG. 71 Rest of Middle-East Africa Dry Concrete  Market, 2016-2026 (Million Tons)
        FIG. 72 Global Dry Concrete production and revenue, 2016-2026 (USD Billion) (Million Tons)
        FIG. 73 North America Dry Concrete production and revenue, 2016-2026 (USD Billion) (Million Tons)
        FIG. 74 Europe Dry Concrete production and revenue, 2016-2026 (USD Billion) (Million Tons)
        FIG. 75 Asia Pacific Dry Concrete production and revenue, 2016-2026 (USD Billion) (Million Tons)
        FIG. 76 Latin America Dry Concrete production and revenue, 2016-2026 (USD Billion) (Million Tons)
        FIG. 77 Middle East and Africa Dry Concrete production and revenue, 2016-2026 (USD Billion) (Million Tons)
        FIG. 78 Competitor Market Share – Revenue
        FIG. 79 Competitor Market Share – Volume
        FIG. 80 US Concrete Products Revenue and Growth Rate
        FIG. 81 US Concrete Products Market Share
        FIG. 82 Sika Corporation Revenue and Growth Rate
        FIG. 83 Sika Corporation Market Share
        FIG. 84 Rochester Concrete Products Revenue and Growth Rate
        FIG. 85 Rochester Concrete Products Market Share
        FIG. 86 Shope Concrete Revenue and Growth Rate
        FIG. 87 Shope Concrete Market Share
        FIG. 88 MST Concrete Products Inc. Revenue and Growth Rate
        FIG. 89 MST Concrete Products Inc. Market Share
        FIG. 90 United Concrete Products Revenue and Growth Rate
        FIG. 91 United Concrete Products Market Share
        FIG. 92 FP McCann Revenue and Growth Rate
        FIG. 93 FP McCann Market Share
        FIG. 94 Standard Concrete Revenue and Growth Rate
        FIG. 95 Standard Concrete Market Share
        FIG. 96 ACP Limited Revenue and Growth Rate
        FIG. 97 ACP Limited Market Share
        FIG. 98 Utility Concrete Products Revenue and Growth Rate
        FIG. 99 Utility Concrete Products Market Share
        FIG. 100 Wieser Concrete Revenue and Growth Rate
        FIG. 101 Wieser Concrete Market Share
        FIG. 102 Abbotsford Concrete Products Revenue and Growth Rate
        FIG. 103 Abbotsford Concrete Products Market Share
        FIG. 104 Hannibal Concrete Products Revenue and Growth Rate
        FIG. 105 Hannibal Concrete Products Market Share
        FIG. 106 Market Dynamics
        FIG. 107 Global Dry Concrete – Value Chain Analysis
        FIG. 108 Key Mandates and Regulations
        FIG. 109 Technology Roadmap and Timeline
        FIG. 110 Market Attractiveness Analysis – By Type
        FIG. 111 Market Attractiveness Analysis – By Applications
        FIG. 112 Market Attractiveness Analysis – By Region
        FIG. 113 Manufacturing Cost Structure of Dry Concrete
        FIG. 114 Dry Concrete Industrial Chain Analysis
        FIG. 115 Market Channel
        FIG. 116 Marketing Channel Development Trend
        FIG. 117 Growth in World Gross Product, 2008-2019

        List of Tables

        TABLE 1 Global Dry Concrete market, 2019&2026 (USD Billion)
        TABLE 2 Global Dry Concrete market, by Type, 2016-2026 (USD Billion)
        TABLE 3 Global Dry Concrete market, by Type, 2016-2026 (Million Tons)
        TABLE 4 Global Dry Concrete market, by Applications, 2016-2026 (USD Billion)
        TABLE 5 Global Dry Concrete market, by Applications, 2016-2026 (Million Tons)
        TABLE 6 Global Dry Concrete market, by region, 2016-2026 (USD Billion)
        TABLE 7 Global Dry Concrete market, by region, 2016-2026 (Million Tons)
        TABLE 8 North America Dry Concrete Market, by Type, 2016-2026 (USD Billion)
        TABLE 9 North America Dry Concrete Market, by Type, 2016-2026 (Million Tons)
        TABLE 10 North America Dry Concrete Market, by Applications, 2016-2026 (USD Billion)
        TABLE 11 North America Dry Concrete Market, by Applications, 2016-2026 (Million Tons)
        TABLE 12 Europe Dry Concrete Market, by Type, 2016-2026 (USD Billion)
        TABLE 13 Europe Dry Concrete Market, by Type, 2016-2026 (Million Tons)
        TABLE 14 Europe Dry Concrete Market, by Applications, 2016-2026 (USD Billion)
        TABLE 15 Europe Dry Concrete Market, by Applications, 2016-2026 (Million Tons)
        TABLE 16 Asia Pacific Dry Concrete Market, by Type, 2016-2026 (USD Billion)
        TABLE 17 Asia Pacific Dry Concrete Market, by Type, 2016-2026 (Million Tons)
        TABLE 18 Asia Pacific Dry Concrete Market, by Applications, 2016-2026 (USD Billion)
        TABLE 19 Asia Pacific Dry Concrete Market, by Applications, 2016-2026 (Million Tons)
        TABLE 20 Latin America Dry Concrete Market, by Type, 2016-2026 (USD Billion)
        TABLE 21 Latin America Dry Concrete Market, by Type, 2016-2026 (Million Tons)
        TABLE 22 Latin America Dry Concrete Market, by Applications, 2016-2026 (USD Billion)
        TABLE 23 Latin America Dry Concrete Market, by Applications, 2016-2026 (Million Tons)
        TABLE 24 The Middle-East and Africa Dry Concrete Market, by Type, 2016-2026 (USD Billion)
        TABLE 25 The Middle-East and Africa Dry Concrete Market, by Type, 2016-2026 (Million Tons)
        TABLE 26 The Middle-East and Africa Dry Concrete Market, by Applications, 2016-2026 (USD Billion)
        TABLE 27 The Middle-East and Africa Dry Concrete Market, by Applications, 2016-2026 (Million Tons)
        TABLE 28 North America Dry Concrete Production, Consumption, Export, Import, 2016-2019
        TABLE 29 Europe Dry Concrete Production, Consumption, Export, Import, 2016-2019
        TABLE 30 Asia Pacific Dry Concrete Production, Consumption, Export, Import, 2016-2019
        TABLE 31 Latin America Dry Concrete Production, Consumption, Export, Import, 2016-2019
        TABLE 32 Middle East & Africa Dry Concrete Production, Consumption, Export, Import, 2016-2019
        TABLE 33 Global Dry Concrete Market - Company Revenue Analysis 2016-2019 (USD Billion)
        TABLE 34 Global Dry Concrete Market - Company Revenue Share Analysis 2016-2019(%)
        TABLE 35 Global Dry Concrete Market - Company Volume Analysis 2016-2019 (Million Tons)
        TABLE 36 Global Dry Concrete Market - Company Volume Share Analysis 2016-2019(%)
        TABLE 37 Acquisitions and Mergers
        TABLE 38 New Product/Service Launch
        TABLE 39 Research & Development Activities
        TABLE 40 Market Drivers
        TABLE 41 Market Restraints
        TABLE 42 Market Opportunities
        TABLE 43 Production Base and Market Concentration Rate of Raw Material
        TABLE 44 Key Suppliers of Raw Materials
        TABLE 45 Raw Materials Sources of Dry Concrete Major Manufacturers in 2016
        TABLE 46 Major Buyers of Dry Concrete
        TABLE 47 Distributors/Traders of Dry Concrete by Region

Industry Major Market Players

  •  US Concrete Products
  •  Sika Corporation
  •  Rochester Concrete Products
  •  Shope Concrete
  •  MST Concrete Products Inc.
  •  United Concrete Products
  •  FP McCann
  •  Standard Concrete
  •  ACP Limited
  •  Utility Concrete Products
  •  Wieser Concrete
  •  Abbotsford Concrete Products
  •  Hannibal Concrete Products