Search Market Research Report

Discover Our Latest Reports
Discover Our Featured Reports
Discover Top Selling Reports

Direct Attach Cable Market Size, Share Global Analysis Report, 2020–2026

report img

Direct Attach Cable Market By Foam Factor (QSFP, SFP, CXP, CX4, CFP, and CDFP), By Product Type (Direct attach copper cables and Active optical cables) and By End-user (Networking, Telecommunications, Data storage, and High-performance computing (hpc) centers): Global Industry Outlook, Market Size, Business Intelligence, Consumer Preferences, Statistical Surveys, Comprehensive Analysis, Historical Developments, Current Trends, and Forecast 2020–2026

Industry Insights

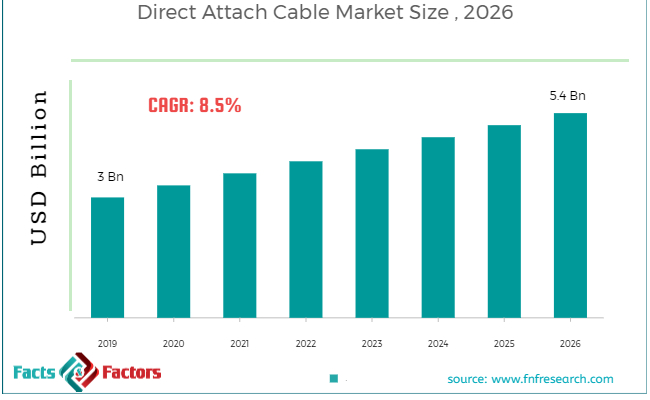
[179+ Pages Report] According to the report published by Facts Factors, the global direct attach cable market size was worth around USD 3 billion in 2019 and is predicted to grow to around USD 5.4 billion by 2026 with a compound annual growth rate (CAGR) of roughly 8.5% between 2020 and 2026. The report analyzes the global direct attach cable market drivers, restraints/challenges, and the effect they have on the demands during the projection period. In addition, the report explores emerging opportunities in the direct attach cable market.

Direct Attach Cable Market

To know more about this report | Request Free Sample Copy

This specialized and expertise-oriented industry research report scrutinizes the technical and commercial business outlook of the Direct Attach Cable industry. The report analyzes and declares the historical and current trends analysis of the Direct Attach Cable industry and subsequently recommends the projected trends anticipated to be observed in the Direct Attach Cable market during the upcoming years.

The direct attach cable market report analyzes and notifies the industry statistics at the global as well as regional and country levels in order to acquire a thorough perspective of the entire direct Attach Cable market. The historical and past insights are provided for FY 2016 to FY 2019 whereas projected trends are delivered for FY 2020 to FY 2026. The quantitative and numerical data is represented in terms of value (USD Billion) from FY 2016 – 2026.

The quantitative data is further underlined and reinforced by comprehensive qualitative data which comprises various across-the-board market dynamics. The rationales which directly or indirectly impact the Direct Attach Cableindustry are exemplified through parameters such as growth drivers, restraints, challenges, and opportunities among other impacting factors.


logoKey Insights from Primary Research

  • As per our primary respondents, the Direct Attach Cable market is set to grow annually at a rate of around 8.5%.
  • It was established through primary research that the Direct Attach Cable market was valued at around USD 3 billion in 2019.
  • After secondary research, we performed face to face interviews to validate our data. The insights interviewee’s declared that QSFP is the most used foam factor for the global Direct Attach Cable market.
  • On the basis of the product, Active optical cables dominated the global Direct Attach Cable market in 2019. It accounted for around a 68% share of the total market in 2019.
  • The Telecommunications segment, on the basis of end-user segmentation, was the leading revenue-generating category accounting for around 43% share, in 2019.

logoKey Recommendations from Analysts

  • Based on the exhaustive secondary research done by our team, the QSFP is anticipated to become the most demanding foam factor in the upcoming years, owing to the growing demand for Direct Attach Cable from networking and data storage industry for various end-use applications.
  • As per our analysts, North America recorded the highest market share of more than 39% by 2026, and the market is expected to bolster in this region, resulting in creating lucrative opportunities for new players.
  • Growing at a CAGR around 8.5%, the Direct Attach Cablemarket provides numerous opportunities for all of the involved stakeholders across the entire value chain.
  • Our analysts have identified Active optical cables and Telecommunicationscategories as the leading investment pockets for the Direct Attach Cable market in terms of product and end-user segmentation respectively.
  • Our analysts recommend the emerging players to focus on active optical cables owing to the substantial growth of the networking, telecommunication, and data storage industry, especially in APAC and Middle-eastern regions.

logo
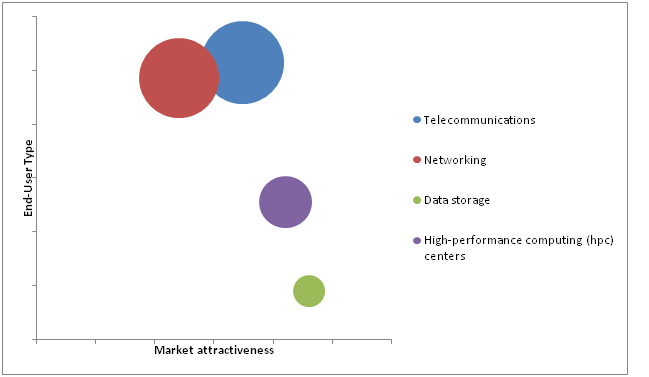
Market Attractiveness – By end-user

Direct Attach Cable Market

To know more about this report | Request Free Sample Copy


Throughout our research report, we have encompassed all the proven models and tools of industry analysis and extensively illustrated all the key business strategies and business models adopted in the Direct Attach Cable industry. The report provides an all-inclusive and detailed competitive landscape prevalent in the Direct Attach Cable market.

The report utilizes established industry analysis tools and models such as Porter’s Five Forces framework to analyze and recognize critical business strategies adopted by various stakeholders involved in the entire value chain of the Direct Attach Cable industry. The Direct Attach Cable market report additionally employs SWOT analysis and PESTLE analysis models for further in-depth analysis.

The report study further includes an in-depth analysis of industry players' market shares and provides an overview of leading players' market position in the Direct Attach Cable sector. Key strategic developments in the Direct Attach Cable market competitive landscape such as acquisitions & mergers, inaugurations of different products and services, partnerships & joint ventures, MoU agreements, VC & funding activities, R&D activities, and geographic expansion among other noteworthy activities by key players of the Direct Attach Cable market are appropriately highlighted in the report.

The worldwide direct attach cable market is valued at $3 billion by 2019 and will have a CAGR of 8.5% over the forecast period. The DAC is a shielded high-speed cable with an SFP plug-in on either side. Both wires are secured by electromagnetic high-speed field sensitive wires. DAC can be used for connection to the router and/or link to the server. AWG ratings such as 28AWG, 30AWG are written on the wires. The higher the cable ratings are, the larger the AWG. Basic forms of DAC used to network, store information and other communication methods include copper wires attached directly and optical wires enabled. The increasing demand for pluggable high-speed products of the next generation is boosting market growth over the forecast period.

The Direct Attach Cable market research report delivers an acutevaluationand taxonomy of the Direct Attach Cable industry by practically splitting the market on the basis of different types, applications, and regions. Through the analysis of the historical and projected trends, all the segments and sub-segments were evaluated through the bottom-up approach, and different market sizes have been projected for FY 2020 to FY 2026.

logoReport Scope

Report Attribute

Details

Market Size in 2019

USD 3 Billion

Projected Market Size in 2026

USD 5.4 Billion

CAGR Growth Rate

8.5% CAGR

Base Year

2019

Forecast Years

2020-2026

Key Market Players

Cleveland Cable Company, Shenzhen Gigalight Technology Co., Ltd, FCI Electronics, Finisar Corporation, Hitachi, Ltd., Juniper Networks, Methode Electronics, Emcore Corporation, Avago Technologies Ltd, Solid Optics, Molex, LLC, Nexans, 3M, ProLabs Ltd, and Others

Key Segment

By Foam, Product, End-User, and Region

Major Regions Covered

North America, Europe, Asia Pacific, Latin America, and the Middle East & Africa

Purchase Options

Request customized purchase options to meet your research needs.Explore purchase options

The regional segmentation of the Direct Attach Cable industry includes the complete classification of all the major continents including North America, Latin America, Europe, Asia Pacific, and Middle East & Africa. Further, country-wise data for the Direct Attach Cable industry is provided for the leading economies of the world.

The Direct Attach Cable market is segmented based on Foam Factor, Product, and End User.  On the basis of type segmentation, the market is classified into QSFP, SFP, CXP, CX4, CFP, and CDFP. In terms of product segmentation, the market is bifurcated into direct attach copper cables and active optical cables. Based on End-user, the market is bifurcated into Networking, Telecommunications, Data storage, and High-performance computing (hpc) centers

logoSome of the essential players operating in the Attach Cable Market, but not restricted to include

  • Clevel and Cable Company
  • Shenzhen Gigalight Technology Co. Ltd
  • FCI Electronics
  • Finisar Corporation
  • Hitachi Ltd.
  • Juniper Networks
  • Methode Electronics
  • Emcore Corporation
  • AvagoTechnologies Ltd
  • Solid Optics
  • Molex
  • LLC
  • Nexans
  • 3M
  • ProLabs Ltd

The taxonomy of the Direct Attach Cable Market by its scope and segmentation is as follows:

logoBy Foam Factor Segmentation Analysis

  • QSFP
  • SFP
  • CXP
  • CX4
  • CFP
  • CDFP

logoBy Product Segmentation Analysis

  • Direct attach copper cables
  • Active optical cables

logoBy End-User Segmentation Analysis

  • Networking
  • Telecommunications
  • Data storage
  • High-performance computing (hpc) centers

logoBy Regional Segmentation Analysis

  • North America
    • The U.S.
    • Canada
  • Europe
    • Germany
    • The UK
    • France
    • Spain
    • Italy
    • Rest of Europe
  • Asia Pacific
    • China
    • Japan
    • India
    • South Korea
    • Southeast Asia
    • Rest of Asia Pacific
  • Latin America
    • Brazil
    • Mexico
    • Rest of Latin America
  • Middle East & Africa
    • GCC
    • South Africa
    • Rest of Middle East & Africa

Table of Content

  1. CHAPTER 1. Executive Summary
  2. CHAPTER 2. Direct Attach Cable market – Foam Factor Analysis
    1. 2.1. Global Direct Attach Cable Market – Foam Factor Overview
    2. 2.2. Global Direct Attach Cable Market Share, by Foam Factor, 2019&2026 (USD Billion)
    3. 2.3. QSFP
      1. 2.3.1. Global QSFP Direct Attach Cable Market, 2016-2026 (USD Billion)
    4. 2.4. SFP
      1. 2.4.1. Global SFP Direct Attach Cable Market, 2016-2026 (USD Billion)
    5. 2.5. CXP
      1. 2.5.1. Global CXP Direct Attach Cable Market, 2016-2026 (USD Billion)
    6. 2.6. CX4
      1. 2.6.1. Global CX4 Direct Attach Cable Market, 2016-2026 (USD Billion)
    7. 2.7. CFP
      1. 2.7.1. Global CFP Direct Attach Cable Market, 2016-2026 (USD Billion)
    8. 2.8. CDFP
      1. 2.8.1. Global CDFP Direct Attach Cable Market, 2016-2026 (USD Billion)
  3. CHAPTER 3. Direct Attach Cable market – Product Analysis
    1. 3.1. Global Direct Attach Cable Market – Product Overview
    2. 3.2. Global Direct Attach Cable Market Share, by Product, 2019&2026 (USD Billion)
    3. 3.3. Direct attach copper cables
      1. 3.3.1. Global Direct attach copper cables Direct Attach Cable Market, 2016-2026 (USD Billion)
    4. 3.4. Active optical cables
      1. 3.4.1. Global Active optical cables Direct Attach Cable Market, 2016-2026 (USD Billion)
  4. CHAPTER 4. Direct Attach Cable market – End User Analysis
    1. 4.1. Global Direct Attach Cable Market – End User Overview
    2. 4.2. Global Direct Attach Cable Market Share, by End User, 2019&2026 (USD Billion)
    3. 4.3. Networking
      1. 4.3.1. Global Networking Direct Attach Cable Market, 2016-2026 (USD Billion)
    4. 4.4. Telecommunications
      1. 4.4.1. Global Telecommunications Direct Attach Cable Market, 2016-2026 (USD Billion)
    5. 4.5. Data storage
      1. 4.5.1. Global Data storage Direct Attach Cable Market, 2016-2026 (USD Billion)
    6. 4.6. High-performance computing (hpc) centers
      1. 4.6.1. Global High-performance computing (hpc) centers Direct Attach Cable Market, 2016-2026 (USD Billion)
  5. CHAPTER 5. Direct Attach Cable market – Regional Analysis
    1. 5.1. Global Direct Attach Cable Market Regional Overview
    2. 5.2. Global Direct Attach Cable Market Share, by Region, 2019&2026 (Value)
    3. 5.3. North America
      1. 5.3.1. North America Direct Attach Cable Market size and forecast, 2016-2026
      2. 5.3.2. North America Direct Attach Cable Market, by Country, 2019&2026 (USD Billion)
      3. 5.3.3. North America Direct Attach Cable Market, by Foam Factor, 2016-2026
        1. 5.3.3.1. North America Direct Attach Cable Market, by Foam Factor, 2016-2026 (USD Billion)
      4. 5.3.4. North America Direct Attach Cable Market, by Product, 2016-2026
        1. 5.3.4.1. North America Direct Attach Cable Market, by Product, 2016-2026 (USD Billion)
      5. 5.3.5. North America Direct Attach Cable Market, by End User, 2016-2026
        1. 5.3.5.1. North America Direct Attach Cable Market, by End User, 2016-2026 (USD Billion)
      6. 5.3.6. U.S.
        1. 5.3.6.1. U.S. Market size and forecast, 2016-2026 (USD Billion)
      7. 5.3.7. Canada
        1. 5.3.7.1. Canada Market size and forecast, 2016-2026 (USD Billion)
    4. 5.4. Europe
      1. 5.4.1. Europe Direct Attach Cable Market size and forecast, 2016-2026
      2. 5.4.2. Europe Direct Attach Cable Market, by Country, 2019&2026 (USD Billion)
      3. 5.4.3. Europe Direct Attach Cable Market, by Foam Factor, 2016-2026
        1. 5.4.3.1. Europe Direct Attach Cable Market, by Foam Factor, 2016-2026 (USD Billion)
      4. 5.4.4. Europe Direct Attach Cable Market, by Product, 2016-2026
        1. 5.4.4.1. Europe Direct Attach Cable Market, by Product, 2016-2026 (USD Billion)
      5. 5.4.5. Europe Direct Attach Cable Market, by End User, 2016-2026
        1. 5.4.5.1. Europe Direct Attach Cable Market, by End User, 2016-2026 (USD Billion)
      6. 5.4.6. Germany
        1. 5.4.6.1. Germany Market size and forecast, 2016-2026 (USD Billion)
      7. 5.4.7. France
        1. 5.4.7.1. France Market size and forecast, 2016-2026 (USD Billion)
      8. 5.4.8. U.K.
        1. 5.4.8.1. U.K. Market size and forecast, 2016-2026 (USD Billion)
      9. 5.4.9. Italy
        1. 5.4.9.1. Italy Market size and forecast, 2016-2026 (USD Billion)
      10. 5.4.10. Spain
        1. 5.4.10.1. Spain Market size and forecast, 2016-2026 (USD Billion)
      11. 5.4.11. Rest of Europe
        1. 5.4.11.1. Rest of Europe Market size and forecast, 2016-2026 (USD Billion)
    5. 5.5. Asia Pacific
      1. 5.5.1. Asia Pacific Direct Attach Cable Market size and forecast, 2016-2026
      2. 5.5.2. Asia Pacific Direct Attach Cable Market, by Country, 2019&2026 (USD Billion)
      3. 5.5.3. Asia Pacific Direct Attach Cable Market, by Foam Factor, 2016-2026
        1. 5.5.3.1. Asia Pacific Direct Attach Cable Market, by Foam Factor, 2016-2026 (USD Billion)
      4. 5.5.4. Asia Pacific Direct Attach Cable Market, by Product, 2016-2026
        1. 5.5.4.1. Asia Pacific Direct Attach Cable Market, by Product, 2016-2026 (USD Billion)
      5. 5.5.5. Asia Pacific Direct Attach Cable Market, by End User, 2016-2026
        1. 5.5.5.1. Asia Pacific Direct Attach Cable Market, by End User, 2016-2026 (USD Billion)
      6. 5.5.6. China
        1. 5.5.6.1. China Market size and forecast, 2016-2026 (USD Billion)
      7. 5.5.7. Japan
        1. 5.5.7.1. Japan Market size and forecast, 2016-2026 (USD Billion)
      8. 5.5.8. India
        1. 5.5.8.1. India Market size and forecast, 2016-2026 (USD Billion)
      9. 5.5.9. South Korea
        1. 5.5.9.1. South Korea Market size and forecast, 2016-2026 (USD Billion)
      10. 5.5.10. South-East Asia
        1. 5.5.10.1. South-East Asia Market size and forecast, 2016-2026 (USD Billion)
      11. 5.5.11. Rest of Asia Pacific
        1. 5.5.11.1. Rest of Asia Pacific Market size and forecast, 2016-2026 (USD Billion)
    6. 5.6. Latin America
      1. 5.6.1. Latin America Direct Attach Cable Market size and forecast, 2016-2026
      2. 5.6.2. Latin America Direct Attach Cable Market, by Country, 2019&2026 (USD Billion)
      3. 5.6.3. Latin America Direct Attach Cable Market, by Foam Factor, 2016-2026
        1. 5.6.3.1. Latin America Direct Attach Cable Market, by Foam Factor, 2016-2026 (USD Billion)
      4. 5.6.4. Latin America Direct Attach Cable Market, by Product, 2016-2026
        1. 5.6.4.1. Latin America Direct Attach Cable Market, by Product, 2016-2026 (USD Billion)
      5. 5.6.5. Latin America Direct Attach Cable Market, by End User, 2016-2026
        1. 5.6.5.1. Latin America Direct Attach Cable Market, by End User, 2016-2026 (USD Billion)
      6. 5.6.6. Brazil
        1. 5.6.6.1. Brazil Market size and forecast, 2016-2026 (USD Billion)
      7. 5.6.7. Mexico
        1. 5.6.7.1. Mexico Market size and forecast, 2016-2026 (USD Billion)
      8. 5.6.8. Rest of Latin America
        1. 5.6.8.1. Rest of Latin America Market size and forecast, 2016-2026 (USD Billion)
    7. 5.7. The Middle-East and Africa
      1. 5.7.1. The Middle-East and Africa Direct Attach Cable Market size and forecast, 2016-2026
      2. 5.7.2. The Middle-East and Africa Direct Attach Cable Market, by Country, 2019&2026 (USD Billion)
      3. 5.7.3. The Middle-East and Africa Direct Attach Cable Market, by Foam Factor, 2016-2026
        1. 5.7.3.1. The Middle-East and Africa Direct Attach Cable Market, by Foam Factor, 2016-2026 (USD Billion)
      4. 5.7.4. The Middle-East and Africa Direct Attach Cable Market, by Product, 2016-2026
        1. 5.7.4.1. The Middle-East and Africa Direct Attach Cable Market, by Product, 2016-2026 (USD Billion)
      5. 5.7.5. The Middle-East and Africa Direct Attach Cable Market, by End User, 2016-2026
        1. 5.7.5.1. The Middle-East and Africa Direct Attach Cable Market, by End User, 2016-2026 (USD Billion)
      6. 5.7.6. GCC Countries
        1. 5.7.6.1. GCC Countries Market size and forecast, 2016-2026 (USD Billion)
      7. 5.7.7. South Africa
        1. 5.7.7.1. South Africa Market size and forecast, 2016-2026 (USD Billion)
      8. 5.7.8. Rest of Middle-East Africa
        1. 5.7.8.1. Rest of Middle-East Africa Market size and forecast, 2016-2026 (USD Billion)
  6. CHAPTER 6. Direct Attach Cable market – Competitive Landscape
    1. 6.1. Competitor Market Share – Revenue
    2. 6.2. Market Concentration Rate Analysis, Top 3 and Top 5 Players
    3. 6.3. Strategic Development
      1. 6.3.1. Acquisitions and Mergers
      2. 6.3.2. New Products
      3. 6.3.3. Research & Development Activities
  7. CHAPTER 7. Company Profiles
    1. 7.1. TE Connectivity Ltd
      1. 7.1.1. Company Overview
      2. 7.1.2. TE Connectivity Ltd Revenue and Gross Margin
      3. 7.1.3. Product portfolio
      4. 7.1.4. Recent initiatives
    2. 7.2. Sumitomo Electric Industries, Ltd
      1. 7.2.1. Company Overview
      2. 7.2.2. Sumitomo Electric Industries, Ltd Revenue and Gross Margin
      3. 7.2.3. Product portfolio
      4. 7.2.4. Recent initiatives
    3. 7.3. Arista Networks, Inc.
      1. 7.3.1. Company Overview
      2. 7.3.2. Arista Networks, Inc. Revenue and Gross Margin
      3. 7.3.3. Product portfolio
      4. 7.3.4. Recent initiatives
    4. 7.4. Cisco Systems, Inc.
      1. 7.4.1. Company Overview
      2. 7.4.2. Cisco Systems, Inc. Revenue and Gross Margin
      3. 7.4.3. Product portfolio
      4. 7.4.4. Recent initiatives
    5. 7.5. Cleveland Cable Company
      1. 7.5.1. Company Overview
      2. 7.5.2. Cleveland Cable Company Revenue and Gross Margin
      3. 7.5.3. Product portfolio
      4. 7.5.4. Recent initiatives
    6. 7.6. Shenzhen Gigalight Technology Co., Ltd
      1. 7.6.1. Company Overview
      2. 7.6.2. Shenzhen Gigalight Technology Co., Ltd Revenue and Gross Margin
      3. 7.6.3. Product portfolio
      4. 7.6.4. Recent initiatives
    7. 7.7. FCI Electronics
      1. 7.7.1. Company Overview
      2. 7.7.2. FCI Electronics Revenue and Gross Margin
      3. 7.7.3. Product portfolio
      4. 7.7.4. Recent initiatives
    8. 7.8. Finisar Corporation
      1. 7.8.1. Company Overview
      2. 7.8.2. Finisar Corporation Revenue and Gross Margin
      3. 7.8.3. Product portfolio
      4. 7.8.4. Recent initiatives
    9. 7.9. Hitachi, Ltd.
      1. 7.9.1. Company Overview
      2. 7.9.2. Hitachi, Ltd. Revenue and Gross Margin
      3. 7.9.3. Product portfolio
      4. 7.9.4. Recent initiatives
    10. 7.10. Juniper Networks
      1. 7.10.1. Company Overview
      2. 7.10.2. Juniper Networks Revenue and Gross Margin
      3. 7.10.3. Product portfolio
      4. 7.10.4. Recent initiatives
    11. 7.11. Methode Electronics
      1. 7.11.1. Company Overview
      2. 7.11.2. Methode Electronics Revenue and Gross Margin
      3. 7.11.3. Product portfolio
      4. 7.11.4. Recent initiatives
    12. 7.12. Emcore Corporation
      1. 7.12.1. Company Overview
      2. 7.12.2. Emcore Corporation Revenue and Gross Margin
      3. 7.12.3. Product portfolio
      4. 7.12.4. Recent initiatives
    13. 7.13. Avago Technologies Ltd
      1. 7.13.1. Company Overview
      2. 7.13.2. Avago Technologies Ltd Revenue and Gross Margin
      3. 7.13.3. Product portfolio
      4. 7.13.4. Recent initiatives
    14. 7.14. Solid Optics
      1. 7.14.1. Company Overview
      2. 7.14.2. Solid Optics Revenue and Gross Margin
      3. 7.14.3. Product portfolio
      4. 7.14.4. Recent initiatives
    15. 7.15. Molex, LLC
      1. 7.15.1. Company Overview
      2. 7.15.2. Molex, LLC Revenue and Gross Margin
      3. 7.15.3. Product portfolio
      4. 7.15.4. Recent initiatives
    16. 7.16. Nexans
      1. 7.16.1. Company Overview
      2. 7.16.2. Nexans Revenue and Gross Margin
      3. 7.16.3. Product portfolio
      4. 7.16.4. Recent initiatives
    17. 7.17. 3M
      1. 7.17.1. Company Overview
      2. 7.17.2. 3M Revenue and Gross Margin
      3. 7.17.3. Product portfolio
      4. 7.17.4. Recent initiatives
    18. 7.18. ProLabs Ltd
      1. 7.18.1. Company Overview
      2. 7.18.2. ProLabs Ltd Revenue and Gross Margin
      3. 7.18.3. Product portfolio
      4. 7.18.4. Recent initiatives
  8. CHAPTER 8. Direct Attach Cable — Industry Analysis
    1. 8.1. Direct Attach Cable Market – Key Trends
      1. 8.1.1. Market Drivers
      2. 8.1.2. Market Restraints
      3. 8.1.3. Market Opportunities
    2. 8.2. Value Chain Analysis
    3. 8.3. Technology Roadmap and Timeline
    4. 8.4. Direct Attach Cable Market – Attractiveness Analysis
      1. 8.4.1. By Foam Factor
      2. 8.4.2. By Product
      3. 8.4.3. By End User
      4. 8.4.4. By Region
  9. CHAPTER 9. Marketing Strategy Analysis, Distributors
    1. 9.1. Marketing Channel
    2. 9.2. Direct Marketing
    3. 9.3. Indirect Marketing
    4. 9.4. Marketing Channel Development Trend
    5. 9.5. Economic/Political Environmental Change
  10. CHAPTER 10. Report Conclusion
  11. CHAPTER 11. Research Approach & Methodology
    1. 11.1. Report Description
    2. 11.2. Research Scope
    3. 11.3. Research Methodology
      1. 11.3.1. Secondary Research
      2. 11.3.2. Primary Research
      3. 11.3.3. Models
        1. 11.3.3.1. Company Share Analysis Model
        2. 11.3.3.2. Revenue Based Modeling
        3. 11.3.3.3. Research Limitations

        List of Figures

        FIG. 1 Global Direct Attach Cable Market, 2016-2026 (USD Billion)
        FIG. 2 Global Direct Attach Cable Market Share, by Foam Factor, 2019&2026 (USD Billion)
        FIG. 3 Global QSFP Direct Attach Cable Market, 2016-2026 (USD Billion)
        FIG. 4 Global SFP Direct Attach Cable Market, 2016-2026 (USD Billion)
        FIG. 5 Global CXP Direct Attach Cable Market, 2016-2026 (USD Billion)
        FIG. 6 Global CX4 Direct Attach Cable Market, 2016-2026 (USD Billion)
        FIG. 7 Global CFP Direct Attach Cable Market, 2016-2026 (USD Billion)
        FIG. 8 Global CDFP Direct Attach Cable Market, 2016-2026 (USD Billion)
        FIG. 9 Global Direct Attach Cable Market Share, by Product, 2019&2026 (USD Billion)
        FIG. 10 Global Direct attach copper cables Direct Attach Cable Market, 2016-2026 (USD Billion)
        FIG. 11 Global Active optical cables Direct Attach Cable Market, 2016-2026 (USD Billion)
        FIG. 12 Global Direct Attach Cable Market Share, by End User, 2019&2026 (USD Billion)
        FIG. 13 Global Networking Direct Attach Cable Market, 2016-2026 (USD Billion)
        FIG. 14 Global Telecommunications Direct Attach Cable Market, 2016-2026 (USD Billion)
        FIG. 15 Global Data storage Direct Attach Cable Market, 2016-2026 (USD Billion)
        FIG. 16 Global High-performance computing (hpc) centers Direct Attach Cable Market, 2016-2026 (USD Billion)
        FIG. 17 Global Direct Attach Cable Market Share, by Region, 2019&2026
        FIG. 18 North America Direct Attach Cable Market, 2016-2026
        FIG. 19 U.S. Direct Attach Cable Market, 2016-2026
        FIG. 20 Canada Direct Attach Cable Market, 2016-2026
        FIG. 21 Europe Direct Attach Cable Market, 2016-2026
        FIG. 22 Germany Direct Attach Cable Market, 2016-2026
        FIG. 23 France Direct Attach Cable Market, 2016-2026
        FIG. 24 U.K. Direct Attach Cable Market, 2016-2026
        FIG. 25 Italy Direct Attach Cable Market, 2016-2026
        FIG. 26 Spain Direct Attach Cable Market, 2016-2026
        FIG. 27 Rest of Europe Direct Attach Cable Market, 2016-2026
        FIG. 28 Asia Pacific Direct Attach Cable Market, 2016-2026
        FIG. 29 China Direct Attach Cable Market, 2016-2026
        FIG. 30 Japan Direct Attach Cable Market, 2016-2026
        FIG. 31 India Direct Attach Cable Market, 2016-2026
        FIG. 32 South  Korea Direct Attach Cable Market, 2016-2026
        FIG. 33 South-East Asia Direct Attach Cable Market, 2016-2026
        FIG. 34 Rest of Asia Pacific Direct Attach Cable Market, 2016-2026
        FIG. 35 Latin America Direct Attach Cable Market, 2016-2026
        FIG. 36 Brazil Direct Attach Cable Market, 2016-2026
        FIG. 37 Mexico Direct Attach Cable Market, 2016-2026
        FIG. 38 Rest of Latin America Direct Attach Cable Market, 2016-2026
        FIG. 39 The Middle-East and Africa Direct Attach Cable Market, 2016-2026
        FIG. 40 GCC Countries Direct Attach Cable Market, 2016-2026
        FIG. 41 South Africa Direct Attach Cable Market, 2016-2026
        FIG. 42 Rest of Middle-East Africa Direct Attach Cable Market, 2016-2026
        FIG. 43 Competitor Market Share – Revenue
        FIG. 44 TE Connectivity Ltd Revenue and Growth Rate
        FIG. 45 TE Connectivity Ltd Market Share
        FIG. 46 Sumitomo Electric Industries, Ltd Revenue and Growth Rate
        FIG. 47 Sumitomo Electric Industries, Ltd Market Share
        FIG. 48 Arista Networks, Inc. Revenue and Growth Rate
        FIG. 49 Arista Networks, Inc. Market Share
        FIG. 50 Cisco Systems, Inc. Revenue and Growth Rate
        FIG. 51 Cisco Systems, Inc. Market Share
        FIG. 52 Cleveland Cable Company Revenue and Growth Rate
        FIG. 53 Cleveland Cable Company Market Share
        FIG. 54 Shenzhen Gigalight Technology Co., Ltd Revenue and Growth Rate
        FIG. 55 Shenzhen Gigalight Technology Co., Ltd Market Share
        FIG. 56 FCI Electronics Revenue and Growth Rate
        FIG. 57 FCI Electronics Market Share
        FIG. 58 Finisar Corporation Revenue and Growth Rate
        FIG. 59 Finisar Corporation Market Share
        FIG. 60 Hitachi, Ltd. Revenue and Growth Rate
        FIG. 61 Hitachi, Ltd. Market Share
        FIG. 62 Juniper Networks Revenue and Growth Rate
        FIG. 63 Juniper Networks Market Share
        FIG. 64 Methode Electronics Revenue and Growth Rate
        FIG. 65 Methode Electronics Market Share
        FIG. 66 Emcore Corporation Revenue and Growth Rate
        FIG. 67 Emcore Corporation Market Share
        FIG. 68 Avago Technologies Ltd Revenue and Growth Rate
        FIG. 69 Avago Technologies Ltd Market Share
        FIG. 70 Solid Optics Revenue and Growth Rate
        FIG. 71 Solid Optics Market Share
        FIG. 72 Molex, LLC Revenue and Growth Rate
        FIG. 73 Molex, LLC Market Share
        FIG. 74 Nexans Revenue and Growth Rate
        FIG. 75 Nexans Market Share
        FIG. 76 3M Revenue and Growth Rate
        FIG. 77 3M Market Share
        FIG. 78 ProLabs Ltd Revenue and Growth Rate
        FIG. 79 ProLabs Ltd Market Share
        FIG. 80 Market Dynamics
        FIG. 81 Global Direct Attach Cable – Value Chain Analysis
        FIG. 82 Technology Roadmap and Timeline
        FIG. 83 Market Attractiveness Analysis – By Foam Factor
        FIG. 84 Market Attractiveness Analysis – By Product
        FIG. 85 Market Attractiveness Analysis – By End User
        FIG. 86 Market Attractiveness Analysis – By Region
        FIG. 87 Market Channel
        FIG. 88 Marketing Channel Development Trend
        FIG. 89 Growth in World Gross Product, 2008-2019

        List of Tables

        TABLE 1 Global Direct Attach Cable Market, 2019&2026 (USD Billion)
        TABLE 2 Global Direct Attach Cable market, by Foam Factor, 2016-2026 (USD Billion)
        TABLE 3 Global Direct Attach Cable market, by Product, 2016-2026 (USD Billion)
        TABLE 4 Global Direct Attach Cable market, by End User, 2016-2026 (USD Billion)
        TABLE 5 Global Direct Attach Cable market, by Region, 2016-2026 (USD Billion)
        TABLE 6 North America Direct Attach Cable Market, by Foam Factor, 2016-2026 (USD Billion)
        TABLE 7 North America Direct Attach Cable Market, by Product, 2016-2026 (USD Billion)
        TABLE 8 North America Direct Attach Cable Market, by End User, 2016-2026 (USD Billion)
        TABLE 9 Europe Direct Attach Cable Market, by Foam Factor, 2016-2026 (USD Billion)
        TABLE 10 Europe Direct Attach Cable Market, by Product, 2016-2026 (USD Billion)
        TABLE 11 Europe Direct Attach Cable Market, by End User, 2016-2026 (USD Billion)
        TABLE 12 Asia Pacific Direct Attach Cable Market, by Foam Factor, 2016-2026 (USD Billion)
        TABLE 13 Asia Pacific Direct Attach Cable Market, by Product, 2016-2026 (USD Billion)
        TABLE 14 Asia Pacific Direct Attach Cable Market, by End User, 2016-2026 (USD Billion)
        TABLE 15 Latin America Direct Attach Cable Market, by Foam Factor, 2016-2026 (USD Billion)
        TABLE 16 Latin America Direct Attach Cable Market, by Product, 2016-2026 (USD Billion)
        TABLE 17 Latin America Direct Attach Cable Market, by End User, 2016-2026 (USD Billion)
        TABLE 18 The Middle-East and Africa Direct Attach Cable Market, by Foam Factor, 2016-2026 (USD Billion)
        TABLE 19 The Middle-East and Africa Direct Attach Cable Market, by Product, 2016-2026 (USD Billion)
        TABLE 20 The Middle-East and Africa Direct Attach Cable Market, by End User, 2016-2026 (USD Billion)
        TABLE 21 Global Direct Attach Cable Market - Company Revenue Analysis 2016-2019 (USD Billion)
        TABLE 22 Global Direct Attach Cable Market - Company Revenue Share Analysis 2016-2019(%)
        TABLE 23 Acquisitions and Mergers
        TABLE 24 New Product/Service Launch
        TABLE 25 Research & Development Activities
        TABLE 26 Market Drivers
        TABLE 27 Market Restraints
        TABLE 28 Market Opportunities

Industry Major Market Players

  • Clevel and Cable Company
  • Shenzhen Gigalight Technology Co. Ltd
  • FCI Electronics
  • Finisar Corporation
  • Hitachi Ltd.
  • Juniper Networks
  • Methode Electronics
  • Emcore Corporation
  • AvagoTechnologies Ltd
  • Solid Optics
  • Molex
  • LLC
  • Nexans
  • 3M
  • ProLabs Ltd