Search Market Research Report

Discover Our Latest Reports
Discover Our Featured Reports
Discover Top Selling Reports

Dimethyl Disulfide Market Size, Share Global Analysis Report, 2019–2026

report img

Dimethyl Disulfide Market By Application (By Application: Food Use and Industrial Use): Global Industry Perspective, Market Size, Statistical Research, Market Intelligence, Comprehensive Analysis, Historical Trends, and Forecast 2019–2026

Industry Insights

This professional and specialized report study examines the technical and business perspective of the Dimethyl Disulfide industry. The report provides a historical analysis of the industry as well as the projected trends expected to be witnessed in the Dimethyl Disulfide Market. The report study analyzes the market statistics at the global as well as regional levels to gain an in-depth perspective of the overall Dimethyl Disulfide Market. The historical insights are provided from 2016 to 2019 and projected trends are provided from 2020 to 2026. The quantitative data is provided in terms of both volumes (Kilo Tons) and value (USD Million) for 2016 – 2026. The qualitative data is reinforced by analyzing and providing numerous market dynamics (directly or indirectly affecting the industry) such as growth drivers, restraints, challenges, and opportunities.

We have included various industry analysis models in our report and extensively demonstrated the key business strategies and competitive landscape of the Dimethyl Disulfide Market in our study.

Dimethyl Disulfide Market Size

To know more about this report | Request Free Sample Copy


logoKey Insights from Primary Research

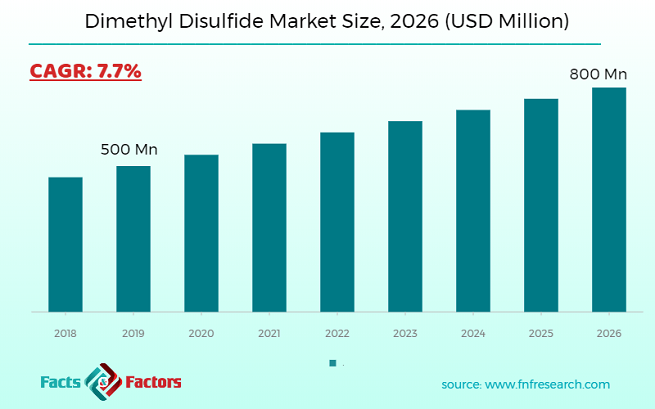
  • Our primary respondents believe the market to witness a rapid growth of 7.7% over the forecast period on account of the rising packaged food and beverage industry around the globe.
  • Some of the CXOs predict the industrial use segment to maintain its dominance throughout 2026 as dimethyl disulfide is most effective in specific manufacturing and production processes. Furthermore, the manufacturers operating in this market are expanding their presence through mergers and acquisitions across various industry verticals.
  • Some of the industry experts interviewed in the Asia Pacific revealed that increasing the agricultural industry has propelled the use of the Dimethyl Disulfide market globally.
  • Regionally, the Europe region is expected to contribute largely to the global Dimethyl Disulfide market. Some of the interviewees said that their future plans are to focus majorly on Dimethyl Disulfide application areas. The manufacturers operating in countries such as the U.S. and Canada are expected to create higher adoption opportunities for the Dimethyl Disulfide market.
  • The research and development subject matter experts suggest investing in R&D activities to come up with newer and more efficient Dimethyl Disulfide end-use sectors. They believe advanced technology in the chemical industry will witness widespread acceptance across the value chain of the Dimethyl Disulfide market.

logoKey Recommendations from Analysts

  • Our analysts recommend focusing on the Asia Pacific dimethyl disulfide market since their calculations revealed that this region turned out to be the top investment pocket across the globe owing to greater opportunities in emerging countries such as India and China.
  • The major reason behind the upsurge in growth and lucrative opportunities underlying in this region is the introduction of dimethyl disulfide as peptides in agricultural application areas.
  • North America, on the other hand, is expected to foresee robust growth accounting for USD 132 Mn in 2019. This is majorly attributed to the rising adoption of high-performing chemicals in the manufacturing industry across the U.S. and Canada.
  • The strategic mergers and acquisitions by key industry players and high demand across application areas are anticipated to fuel the market growth
  • The executive summary of the report reads the total opportunity underlying the global Dimethyl Disulfide market is nearly USD 800 Mn between 2020 and 2026.

logo
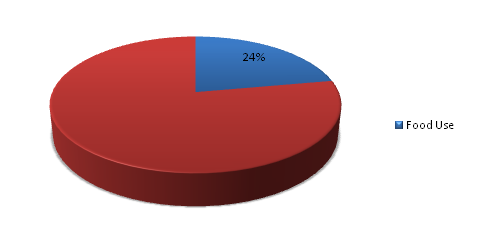
Global Dimethyl Disulfide (DMDS) Market Volume Share by Application in 2019

Dimethyl Disulfide Market

To know more about this report | Request Free Sample Copy

logo
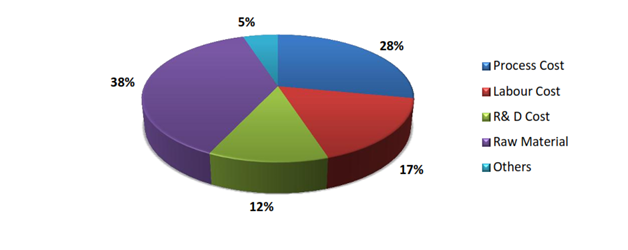
Dimethyl Disulfide – Cost Structure

Dimethyl Disulfide Market

To know more about this report | Request Free Sample Copy


Our study also includes an analysis of Porter’s Five Forces framework for understanding the competitive strategies adopted by various stakeholders involved in the entire value chain of the Dimethyl Disulfide Market. It also encompasses PESTLE analysis and SWOT analysis.

The report also offers an in-depth analysis of the market shares of each industry player and gives an outline of the market position of key players in the Dimethyl Disulfide Market. Moreover, the study offers wide coverage of key strategic advances witnessed in the market such as new product launches, acquisitions & mergers, collaborations & joint ventures, funding & VC activities, agreements, partnerships, R&D activities, and regional expansion of key players of the Dimethyl Disulfide Market.

The research study provides a critical assessment of the Dimethyl Disulfide industry by logically segmenting the market on the basis of product type, connectivity, port, distribution channel, and regions. Based on the past, present, and future trends, all the segments were analyzed from the bottom up, and the market sizes have been estimated from 2020 to 2026. The regional segmentation of the Dimethyl Disulfide industry includes the holistic bifurcation of all five major continents including North America, Europe, Asia Pacific, Latin America, and the Middle East & Africa.

Dimethyl disulfide is a colorless compound widely used in food and industrial applications. It has a higher density than water dimethyl disulfide is soluble in water making it highly suitable in various end-use verticals. It is stored away from potential ignition sources; however, it is easy to pack in bulk and transport. Dimethyl disulfide is used as a food additive to enrich the aroma and flavor of specific food products such as garlic, onion, fruit flavors, soups, meats, cheese, and others. Furthermore, it is used during the preparation of various pesticides. A growing trend in agriculture to use Dimethyl disulfide instead of other substitutes is expected to be one of the primary reasons for the growth of the dimethyl disulfide market globally.

The market has witnessed growth owing to increasing packaged food such as cheese, oil, and others have increased use of dimethyl disulfide in the packaged food industry around the globe. The need for safe and side effects industrial chemicals requirements have propelled the growth of the Dimethyl Disulfide market over the forecast period.

The Dimethyl Disulfide Market is categorized by application into Food Use and Industrial Use.

logoReport Scope

Report Attribute

Details

Market Size in 2019

USD 500 Million

Projected Market Size in 2026

USD 800 Million

CAGR Growth Rate

7.7% CAGR

Base Year

2019

Forecast Years

2020-2026

Key Market Players

Chevron Phillips Chemical Company LLC., IRO Group Inc., Shinya Chem Co., Ltd., Arkema S.A., Hangzhou Rongshunjia Technology Co., Ltd., Haihang Industry Co., Ltd., Varsal, Inc., Penta International Corporation, Alpha Chemika, Tianjin TopGlobal Co., Ltd., and Others.

Key Segment

By Application, By Region

Major Regions Covered

North America, Europe, Asia Pacific, Latin America, and the Middle East & Africa

Purchase Options

Request customized purchase options to meet your research needs. Explore purchase options

logoCompetitive Players

Some of the key players operating in the Dimethyl Disulfide Market around the globe include :

  •  Chevron Phillips Chemical Company LLC.
  •  IRO Group Inc.
  •  Shinya Chem Co.Ltd.
  •  Arkema S.A.
  •  Hangzhou Rongshunjia Technology Co.Ltd.
  •  Haihang Industry Co.Ltd.
  •  Varsal Inc.
  •  Penta International Corporation
  •  Alpha Chemika
  •  Tianjin TopGlobal Co.Ltd.

The taxonomy of the Dimethyl Disulfide industry by its scope and segmentation is as follows:

logo By Application Segmentation Analysis

  • Food Use
  • Industrial Use

logo Regional Segmentation Analysis

  • North America
    • The U.S.
    • Canada
  • Europe
    • France
    • The UK
    • Spain
    • Germany
    • Italy
    • Rest of Europe
  • Asia Pacific
    • China
    • Japan
    • India
    • South Korea
    • Southeast Asia
    • Rest of Asia Pacific
  • Latin America
    • Brazil
    • Mexico
    • Rest of Latin America
  • Middle East & Africa
    • GCC
    • South Africa
    • Rest of the Middle East & Africa

logoKEY BUSINESS POINTERS ADDRESSED & FOREMOST REASONS TO PROCURE THE REPORT:

  • Statistical Analysis of the Past, Current, and Future Trends of the Industry with Validated Market Sizes Data
  • Direct and Indirect Rationales Impacting the Industry
  • In-depth and Micro Analysis of Viable Segments and Sub-segments
  • Companies and Vendors Market Share, Competitive Landscape, and Player Positioning Analysis
  • Demand Side (Consumption) and Supply Side (Production) Perspective and Analysis wherever applicable
  • Key Buyers and End-Users Analysis
  • Value Chain and Manufacturing Cost Structure Analysis wherever relevant
  • Key Marketing Strategies as well as Key Sales Channels adopted in the market
  • Investment Opportunity Analysis & Patents Analysis wherever feasible
  • Technological Road Map & Technical Analysis
  • Robust Research Methodology comprising dynamic mix (65%~35%) of Extensive Primary Research (primary interviews, ad-hoc surveys, questionnaires) and Protracted Secondary Research (proprietary in-house database, paid external databases, publically available validated sources)

Table of Content

  1. CHAPTER 1. Executive Summary
  2. CHAPTER 2. Dimethyl Disulfide market – Application Analysis
    1. 2.1. Global Dimethyl Disulfide Market – Application Overview
    2. 2.2. Global Dimethyl Disulfide Market Share, by Application, 2018 & 2025 (USD Million)
    3. 2.3. Global Dimethyl Disulfide Market share, by Application, 2018 & 2025 (Kilo Tons)
    4. 2.4. Food Use
      1. 2.4.1. Global Food Use Dimethyl Disulfide Market, 2016-2026 (USD Million)
      2. 2.4.2. Global Food Use Dimethyl Disulfide Market, 2016-2026 (Kilo Tons)
    5. 2.5. Industrial Use
      1. 2.5.1. Global Industrial Use Dimethyl Disulfide Market, 2016-2026 (USD Million)
      2. 2.5.2. Global Industrial Use Dimethyl Disulfide Market, 2016-2026 (Kilo Tons)
  3. CHAPTER 3. Dimethyl Disulfide market – Regional Analysis
    1. 3.1. Global Dimethyl Disulfide Market Regional Overview
    2. 3.2. Global Dimethyl Disulfide Market Share, by Region, 2018 & 2025 (Value)
    3. 3.3. Global Dimethyl Disulfide Market Share, by Region, 2018 & 2025 (Volume)
    4. 3.4. North America
      1. 3.4.1. North America Dimethyl Disulfide Market size and forecast, 2016-2026
      2. 3.4.2. North America Dimethyl Disulfide Market, by Country, 2018 - 2025 (USD Million)
      3. 3.4.3. North America Market size and forecast, 2016-2026 (Kilo Tons)
      4. 3.4.4. North America Dimethyl Disulfide Market, by Country, 2018 - 2025 (Kilo Tons)
      5. 3.4.5. North America Dimethyl Disulfide Market, by Application, 2016-2026
        1. 3.4.5.1. North America Dimethyl Disulfide Market, by Application, 2016-2026 (USD Million)
        2. 3.4.5.2. North America Dimethyl Disulfide Market, by Application, 2016-2026 (Kilo Tons)
      6. 3.4.6. U.S.
        1. 3.4.6.1. U.S. Market size and forecast, 2016-2026 (USD Million)
        2. 3.4.6.2. U.S. Market size and forecast, 2016-2026 (Kilo Tons)
      7. 3.4.7. Canada
        1. 3.4.7.1. Canada Market size and forecast, 2016-2026 (USD Million)
        2. 3.4.7.2. Canada Market size and forecast, 2016-2026 (Kilo Tons)
    5. 3.5. Europe
      1. 3.5.1. Europe Dimethyl Disulfide Market size and forecast, 2016-2026
      2. 3.5.2. Europe Dimethyl Disulfide Market, by Country, 2018 - 2025 (USD Million)
      3. 3.5.3. Europe Market size and forecast, 2016-2026 (Kilo Tons)
      4. 3.5.4. Europe Dimethyl Disulfide Market, by Country, 2018 - 2025 (Kilo Tons)
      5. 3.5.5. Europe Dimethyl Disulfide Market, by Application, 2016-2026
        1. 3.5.5.1. Europe Dimethyl Disulfide Market, by Application, 2016-2026 (USD Million)
        2. 3.5.5.2. Europe Dimethyl Disulfide Market, by Application, 2016-2026 (Kilo Tons)
      6. 3.5.6. Germany
        1. 3.5.6.1. Germany Market size and forecast, 2016-2026 (USD Million)
        2. 3.5.6.2. Germany Market size and forecast, 2016-2026 (Kilo Tons)
      7. 3.5.7. France
        1. 3.5.7.1. France Market size and forecast, 2016-2026 (USD Million)
        2. 3.5.7.2. France Market size and forecast, 2016-2026 (Kilo Tons)
      8. 3.5.8. U.K.
        1. 3.5.8.1. U.K. Market size and forecast, 2016-2026 (USD Million)
        2. 3.5.8.2. U.K. Market size and forecast, 2016-2026 (Kilo Tons)
      9. 3.5.9. Italy
        1. 3.5.9.1. Italy Market size and forecast, 2016-2026 (USD Million)
        2. 3.5.9.2. Italy Market size and forecast, 2016-2026 (Kilo Tons)
      10. 3.5.10. Spain
        1. 3.5.10.1. Spain Market size and forecast, 2016-2026 (USD Million)
        2. 3.5.10.2. Spain Market size and forecast, 2016-2026 (Kilo Tons)
      11. 3.5.11. Rest of Europe
        1. 3.5.11.1. Rest of Europe Market size and forecast, 2016-2026 (USD Million)
        2. 3.5.11.2. Rest of Europe Market size and forecast, 2016-2026 (Kilo Tons)
    6. 3.6. Asia Pacific
      1. 3.6.1. Asia Pacific Dimethyl Disulfide Market size and forecast, 2016-2026
      2. 3.6.2. Asia Pacific Dimethyl Disulfide Market, by Country, 2018 - 2025 (USD Million)
      3. 3.6.3. Asia Pacific Market size and forecast, 2016-2026 (Kilo Tons)
      4. 3.6.4. Asia Pacific Dimethyl Disulfide Market, by Country, 2018 - 2025 (Kilo Tons)
      5. 3.6.5. Asia Pacific Dimethyl Disulfide Market, by Application, 2016-2026
        1. 3.6.5.1. Asia Pacific Dimethyl Disulfide Market, by Application, 2016-2026 (USD Million)
        2. 3.6.5.2. Asia Pacific Dimethyl Disulfide Market, by Application, 2016-2026 (Kilo Tons)
      6. 3.6.6. China
        1. 3.6.6.1. China Market size and forecast, 2016-2026 (USD Million)
        2. 3.6.6.2. China Market size and forecast, 2016-2026 (Kilo Tons)
      7. 3.6.7. Japan
        1. 3.6.7.1. Japan Market size and forecast, 2016-2026 (USD Million)
        2. 3.6.7.2. Japan Market size and forecast, 2016-2026 (Kilo Tons)
      8. 3.6.8. India
        1. 3.6.8.1. India Market size and forecast, 2016-2026 (USD Million)
        2. 3.6.8.2. India Market size and forecast, 2016-2026 (Kilo Tons)
      9. 3.6.9. South Korea
        1. 3.6.9.1. South Korea Market size and forecast, 2016-2026 (USD Million)
        2. 3.6.9.2. South Korea Market size and forecast, 2016-2026 (Kilo Tons)
      10. 3.6.10. South-East Asia
        1. 3.6.10.1. South-East Asia Market size and forecast, 2016-2026 (USD Million)
        2. 3.6.10.2. South-East Asia Market size and forecast, 2016-2026 (Kilo Tons)
      11. 3.6.11. Rest of Asia Pacific
        1. 3.6.11.1. Rest of Asia Pacific Market size and forecast, 2016-2026 (USD Million)
        2. 3.6.11.2. Rest of Asia Pacific Market size and forecast, 2016-2026 (Kilo Tons)
    7. 3.7. Latin America
      1. 3.7.1. Latin America Dimethyl Disulfide Market size and forecast, 2016-2026
      2. 3.7.2. Latin America Dimethyl Disulfide Market, by Country, 2018 - 2025 (USD Million)
      3. 3.7.3. Latin America Market size and forecast, 2016-2026 (Kilo Tons)
      4. 3.7.4. Latin America Dimethyl Disulfide Market, by Country, 2018 - 2025 (Kilo Tons)
      5. 3.7.5. Latin America Dimethyl Disulfide Market, by Application, 2016-2026
        1. 3.7.5.1. Latin America Dimethyl Disulfide Market, by Application, 2016-2026 (USD Million)
        2. 3.7.5.2. Latin America Dimethyl Disulfide Market, by Application, 2016-2026 (Kilo Tons)
      6. 3.7.6. Brazil
        1. 3.7.6.1. Brazil Market size and forecast, 2016-2026 (USD Million)
        2. 3.7.6.2. Brazil Market size and forecast, 2016-2026 (Kilo Tons)
      7. 3.7.7. Mexico
        1. 3.7.7.1. Mexico Market size and forecast, 2016-2026 (USD Million)
        2. 3.7.7.2. Mexico Market size and forecast, 2016-2026 (Kilo Tons)
      8. 3.7.8. Rest of Latin America
        1. 3.7.8.1. Rest of Latin America Market size and forecast, 2016-2026 (USD Million)
        2. 3.7.8.2. Rest of Latin America Market size and forecast, 2016-2026 (Kilo Tons)
    8. 3.8. The Middle-East and Africa
      1. 3.8.1. The Middle-East and Africa Dimethyl Disulfide Market size and forecast, 2016-2026
      2. 3.8.2. The Middle-East and Africa Dimethyl Disulfide Market, by Country, 2018 - 2025 (USD Million)
      3. 3.8.3. The Middle-East and Africa Market size and forecast, 2016-2026 (Kilo Tons)
      4. 3.8.4. The Middle-East and Africa Dimethyl Disulfide Market, by Country, 2018 - 2025 (Kilo Tons)
      5. 3.8.5. The Middle-East and Africa Dimethyl Disulfide Market, by Application, 2016-2026
        1. 3.8.5.1. The Middle-East and Africa Dimethyl Disulfide Market, by Application, 2016-2026 (USD Million)
        2. 3.8.5.2. The Middle-East and Africa Dimethyl Disulfide Market, by Application, 2016-2026 (Kilo Tons)
      6. 3.8.6. GCC Countries
        1. 3.8.6.1. GCC Countries Market size and forecast, 2016-2026 (USD Million)
        2. 3.8.6.2. GCC Countries Market size and forecast, 2016-2026 (Kilo Tons)
      7. 3.8.7. South Africa
        1. 3.8.7.1. South Africa Market size and forecast, 2016-2026 (USD Million)
        2. 3.8.7.2. South Africa Market size and forecast, 2016-2026 (Kilo Tons)
      8. 3.8.8. Rest of Middle-East Africa
        1. 3.8.8.1. Rest of Middle-East Africa Market size and forecast, 2016-2026 (USD Million)
        2. 3.8.8.2. Rest of Middle-East Africa Market size and forecast, 2016-2026 (Kilo Tons)
  4. CHAPTER 4. Dimethyl Disulfide Production, Consumption, Export, Import by Regions
    1. 4.1. Global Dimethyl Disulfide production and revenue, 2015-2025 (USD Million) (Kilo Tons)
    2. 4.2. Global Import and Export Analysis, by Region
  5. CHAPTER 5. Dimethyl Disulfide market – Competitive Landscape
    1. 5.1. Competitor Market Share – Revenue
    2. 5.2. Market Concentration Rate Analysis, Top 3 and Top 5 Players
    3. 5.3. Competitor Market Share – Volume
    4. 5.4. Strategic Development
      1. 5.4.1. Acquisitions and Mergers
      2. 5.4.2. New Products
      3. 5.4.3. Research & Development Activities
  6. CHAPTER 6. Company Profiles
    1. 6.1. Chevron Phillips Chemical Company LLC.
      1. 6.1.1. Company Overview
      2. 6.1.2. Chevron Phillips Chemical Company LLC. Sales, Revenue, Price, and Gross Margin
      3. 6.1.3. Product portfolio
      4. 6.1.4. Recent initiatives
    2. 6.2. IRO Group Inc.
      1. 6.2.1. Company Overview
      2. 6.2.2. IRO Group Inc. Sales, Revenue, Price, and Gross Margin
      3. 6.2.3. Product portfolio
      4. 6.2.4. Recent initiatives
    3. 6.3. Shinya Chem Co.
      1. 6.3.1. Company Overview
      2. 6.3.2. Shinya Chem Co. Sales, Revenue, Price, and Gross Margin
      3. 6.3.3. Product portfolio
      4. 6.3.4. Recent initiatives
    4. 6.4. Ltd.
      1. 6.4.1. Company Overview
      2. 6.4.2. Ltd. Sales, Revenue, Price, and Gross Margin
      3. 6.4.3. Product portfolio
      4. 6.4.4. Recent initiatives
    5. 6.5. Arkema S.A.
      1. 6.5.1. Company Overview
      2. 6.5.2. Arkema S.A. Sales, Revenue, Price, and Gross Margin
      3. 6.5.3. Product portfolio
      4. 6.5.4. Recent initiatives
    6. 6.6. Hangzhou Rongshunjia Technology Co.
      1. 6.6.1. Company Overview
      2. 6.6.2. Hangzhou Rongshunjia Technology Co. Sales, Revenue, Price, and Gross Margin
      3. 6.6.3. Product portfolio
      4. 6.6.4. Recent initiatives
    7. 6.7. Ltd.
      1. 6.7.1. Company Overview
      2. 6.7.2. Ltd. Sales, Revenue, Price, and Gross Margin
      3. 6.7.3. Product portfolio
      4. 6.7.4. Recent initiatives
    8. 6.8. Haihang Industry Co.
      1. 6.8.1. Company Overview
      2. 6.8.2. Haihang Industry Co. Sales, Revenue, Price, and Gross Margin
      3. 6.8.3. Product portfolio
      4. 6.8.4. Recent initiatives
    9. 6.9. Ltd.
      1. 6.9.1. Company Overview
      2. 6.9.2. Ltd. Sales, Revenue, Price, and Gross Margin
      3. 6.9.3. Product portfolio
      4. 6.9.4. Recent initiatives
    10. 6.10. Varsal
      1. 6.10.1. Company Overview
      2. 6.10.2. Varsal Sales, Revenue, Price, and Gross Margin
      3. 6.10.3. Product portfolio
      4. 6.10.4. Recent initiatives
    11. 6.11. Inc.
      1. 6.11.1. Company Overview
      2. 6.11.2. Inc. Sales, Revenue, Price, and Gross Margin
      3. 6.11.3. Product portfolio
      4. 6.11.4. Recent initiatives
    12. 6.12. Penta International Corporation
      1. 6.12.1. Company Overview
      2. 6.12.2. Penta International Corporation Sales, Revenue, Price, and Gross Margin
      3. 6.12.3. Product portfolio
      4. 6.12.4. Recent initiatives
    13. 6.13. Alpha Chemika
      1. 6.13.1. Company Overview
      2. 6.13.2. Alpha Chemika Sales, Revenue, Price, and Gross Margin
      3. 6.13.3. Product portfolio
      4. 6.13.4. Recent initiatives
    14. 6.14. Tianjin TopGlobal Co.
      1. 6.14.1. Company Overview
      2. 6.14.2. Tianjin TopGlobal Co. Sales, Revenue, Price, and Gross Margin
      3. 6.14.3. Product portfolio
      4. 6.14.4. Recent initiatives
    15. 6.15. Ltd.
      1. 6.15.1. Company Overview
      2. 6.15.2. Ltd. Sales, Revenue, Price, and Gross Margin
      3. 6.15.3. Product portfolio
      4. 6.15.4. Recent initiatives
  7. CHAPTER 7. Dimethyl Disulfide — Industry Analysis
    1. 7.1. Introduction and Taxonomy
    2. 7.2. Dimethyl Disulfide Market – Key Trends
      1. 7.2.1. Market Drivers
      2. 7.2.2. Market Restraints
      3. 7.2.3. Market Opportunities
    3. 7.3. Value Chain Analysis
    4. 7.4. Key Mandates and Regulations
    5. 7.5. Technology Roadmap and Timeline
    6. 7.6. Dimethyl Disulfide market – Attractiveness Analysis
      1. 7.6.1. By Application
      2. 7.6.2. By Region
  8. CHAPTER 8. Raw Material analysis
    1. 8.1. Dimethyl Disulfide Key Raw Material Analysis
      1. 8.1.1. Key Raw Materials
      2. 8.1.2. Price Trend of Key Raw Materials
    2. 8.2. Key Suppliers of Raw Materials
    3. 8.3. Proportion of Manufacturing Cost Structure
      1. 8.3.1. Raw Materials
      2. 8.3.2. Labor Cost
    4. 8.4. Manufacturing Expenses Analysis of Dimethyl Disulfide
  9. CHAPTER 9. Industrial Chain, Sourcing Strategy and Downstream Buyers
    1. 9.1. Dimethyl Disulfide Industrial Chain Analysis
    2. 9.2. Upstream Raw Materials Sourcing
      1. 9.2.1. Risk Mitigation:
      2. 9.2.2. Supplier Relationships:
      3. 9.2.3. Business Processes:
      4. 9.2.4. Securing the Product:
    3. 9.3. Raw Materials Sources of Dimethyl Disulfide Major Manufacturers in 2016
    4. 9.4. Downstream Buyers
    5. 9.5. Distributors/Traders List
  10. CHAPTER 10. Marketing Strategy Analysis, Distributors
    1. 10.1. Marketing Channel
    2. 10.2. Direct Marketing
    3. 10.3. Indirect Marketing
    4. 10.4. Marketing Channel Development Trend
    5. 10.5. Economic/Political Environmental Change
  11. CHAPTER 11. Report Conclusion
  12. CHAPTER 12. Research Approach & Methodology
    1. 12.1. Report Description
    2. 12.2. Research Scope
    3. 12.3. Research Methodology
      1. 12.3.1. Secondary Research
      2. 12.3.2. Primary Research
      3. 12.3.3. Models
        1. 12.3.3.1. Company Share Analysis Model
        2. 12.3.3.2. Revenue Based Modeling
        3. 12.3.3.3. Research Limitations

        List of Figures

        FIG. 1 Global Dimethyl Disulfide Market, 2016-2026 (USD Million)
        FIG. 2 Global Dimethyl Disulfide Market Share, by Application, 2018 & 2025 (USD Million)
        FIG. 3 Global Dimethyl Disulfide Market share, by Application, 2018 & 2025 (Kilo Tons)
        FIG. 4 Global Food Use Dimethyl Disulfide Market, 2016-2026 (USD Million)
        FIG. 5 Global Food Use Dimethyl Disulfide  Market, 2016-2026 (Kilo Tons)
        FIG. 6 Global Industrial Use Dimethyl Disulfide Market, 2016-2026 (USD Million)
        FIG. 7 Global Industrial Use Dimethyl Disulfide  Market, 2016-2026 (Kilo Tons)
        FIG. 8 Global Dimethyl Disulfide Market Share, by Region, 2018 & 2025
        FIG. 9 Global Dimethyl Disulfide Market Share, by Region, 2018 & 2025
        FIG. 10 North America Dimethyl Disulfide Market, 2016-2026
        FIG. 11 North America Dimethyl Disulfide  Market, 2016-2026 (Kilo Tons)
        FIG. 12 U.S. Dimethyl Disulfide Market, 2016-2026
        FIG. 13 U.S. Dimethyl Disulfide  Market, 2016-2026 (Kilo Tons)
        FIG. 14 Canada Dimethyl Disulfide Market, 2016-2026
        FIG. 15 Canada Dimethyl Disulfide  Market, 2016-2026 (Kilo Tons)
        FIG. 16 Europe Dimethyl Disulfide Market, 2016-2026
        FIG. 17 Europe Dimethyl Disulfide  Market, 2016-2026 (Kilo Tons)
        FIG. 18 Germany Dimethyl Disulfide Market, 2016-2026
        FIG. 19 Germany Dimethyl Disulfide  Market, 2016-2026 (Kilo Tons)
        FIG. 20 France Dimethyl Disulfide Market, 2016-2026
        FIG. 21 France Dimethyl Disulfide  Market, 2016-2026 (Kilo Tons)
        FIG. 22 U.K. Dimethyl Disulfide Market, 2016-2026
        FIG. 23 U.K. Dimethyl Disulfide  Market, 2016-2026 (Kilo Tons)
        FIG. 24 Italy Dimethyl Disulfide Market, 2016-2026
        FIG. 25 Italy Dimethyl Disulfide  Market, 2016-2026 (Kilo Tons)
        FIG. 26 Spain Dimethyl Disulfide Market, 2016-2026
        FIG. 27 Spain Dimethyl Disulfide  Market, 2016-2026 (Kilo Tons)
        FIG. 28 Rest of Europe Dimethyl Disulfide Market, 2016-2026
        FIG. 29 Rest of Europe Dimethyl Disulfide  Market, 2016-2026 (Kilo Tons)
        FIG. 30 Asia Pacific Dimethyl Disulfide Market, 2016-2026
        FIG. 31 Asia Pacific Dimethyl Disulfide  Market, 2016-2026 (Kilo Tons)
        FIG. 32 China Dimethyl Disulfide Market, 2016-2026
        FIG. 33 China Dimethyl Disulfide  Market, 2016-2026 (Kilo Tons)
        FIG. 34 Japan Dimethyl Disulfide Market, 2016-2026
        FIG. 35 Japan Dimethyl Disulfide  Market, 2016-2026 (Kilo Tons)
        FIG. 36 India Dimethyl Disulfide Market, 2016-2026
        FIG. 37 India Dimethyl Disulfide  Market, 2016-2026 (Kilo Tons)
        FIG. 38 South  Korea Dimethyl Disulfide Market, 2016-2026
        FIG. 39 South  Korea Dimethyl Disulfide  Market, 2016-2026 (Kilo Tons)
        FIG. 40 South-East Asia Dimethyl Disulfide Market, 2016-2026
        FIG. 41 South-East Asia Dimethyl Disulfide  Market, 2016-2026 (Kilo Tons)
        FIG. 42 Rest of Asia Pacific Dimethyl Disulfide Market, 2016-2026
        FIG. 43 Rest of Asia Pacific Dimethyl Disulfide  Market, 2016-2026 (Kilo Tons)
        FIG. 44 Latin America Dimethyl Disulfide Market, 2016-2026
        FIG. 45 Latin America Dimethyl Disulfide  Market, 2016-2026 (Kilo Tons)
        FIG. 46 Brazil Dimethyl Disulfide Market, 2016-2026
        FIG. 47 Brazil Dimethyl Disulfide  Market, 2016-2026 (Kilo Tons)
        FIG. 48 Mexico Dimethyl Disulfide Market, 2016-2026
        FIG. 49 Mexico Dimethyl Disulfide  Market, 2016-2026 (Kilo Tons)
        FIG. 50 Rest of Latin America Dimethyl Disulfide Market, 2016-2026
        FIG. 51 Rest of Latin America Dimethyl Disulfide  Market, 2016-2026 (Kilo Tons)
        FIG. 52 The Middle-East and Africa Dimethyl Disulfide Market, 2016-2026
        FIG. 53 The Middle-East and Africa Dimethyl Disulfide  Market, 2016-2026 (Kilo Tons)
        FIG. 54 GCC Countries Dimethyl Disulfide Market, 2016-2026
        FIG. 55 GCC Countries Dimethyl Disulfide  Market, 2016-2026 (Kilo Tons)
        FIG. 56 South Africa Dimethyl Disulfide Market, 2016-2026
        FIG. 57 South Africa Dimethyl Disulfide  Market, 2016-2026 (Kilo Tons)
        FIG. 58 Rest of Middle-East Africa Dimethyl Disulfide Market, 2016-2026
        FIG. 59 Rest of Middle-East Africa Dimethyl Disulfide  Market, 2016-2026 (Kilo Tons)
        FIG. 60 Global Dimethyl Disulfide production and revenue, 2015-2025 (USD Million) (Kilo Tons)
        FIG. 61 North America Dimethyl Disulfide production and revenue, 2015-2025 (USD Million) (Kilo Tons)
        FIG. 62 Europe Dimethyl Disulfide production and revenue, 2015-2025 (USD Million) (Kilo Tons)
        FIG. 63 Asia Pacific Dimethyl Disulfide production and revenue, 2015-2025 (USD Million) (Kilo Tons)
        FIG. 64 Latin America Dimethyl Disulfide production and revenue, 2015-2025 (USD Million) (Kilo Tons)
        FIG. 65 Middle East and Africa Dimethyl Disulfide production and revenue, 2015-2025 (USD Million) (Kilo Tons)
        FIG. 66 Competitor Market Share – Revenue
        FIG. 67 Competitor Market Share – Volume
        FIG. 68 Chevron Phillips Chemical Company LLC. Revenue and Growth Rate
        FIG. 69 Chevron Phillips Chemical Company LLC. Market Share
        FIG. 70 IRO Group Inc. Revenue and Growth Rate
        FIG. 71 IRO Group Inc. Market Share
        FIG. 72 Shinya Chem Co. Revenue and Growth Rate
        FIG. 73 Shinya Chem Co. Market Share
        FIG. 74 Ltd. Revenue and Growth Rate
        FIG. 75 Ltd. Market Share
        FIG. 76 Arkema S.A. Revenue and Growth Rate
        FIG. 77 Arkema S.A. Market Share
        FIG. 78 Hangzhou Rongshunjia Technology Co. Revenue and Growth Rate
        FIG. 79 Hangzhou Rongshunjia Technology Co. Market Share
        FIG. 80 Ltd. Revenue and Growth Rate
        FIG. 81 Ltd. Market Share
        FIG. 82 Haihang Industry Co. Revenue and Growth Rate
        FIG. 83 Haihang Industry Co. Market Share
        FIG. 84 Ltd. Revenue and Growth Rate
        FIG. 85 Ltd. Market Share
        FIG. 86 Varsal Revenue and Growth Rate
        FIG. 87 Varsal Market Share
        FIG. 88 Inc. Revenue and Growth Rate
        FIG. 89 Inc. Market Share
        FIG. 90 Penta International Corporation Revenue and Growth Rate
        FIG. 91 Penta International Corporation Market Share
        FIG. 92 Alpha Chemika Revenue and Growth Rate
        FIG. 93 Alpha Chemika Market Share
        FIG. 94 Tianjin TopGlobal Co. Revenue and Growth Rate
        FIG. 95 Tianjin TopGlobal Co. Market Share
        FIG. 96 Ltd. Revenue and Growth Rate
        FIG. 97 Ltd. Market Share
        FIG. 98 Market Dynamics
        FIG. 99 Global Dimethyl Disulfide – Value Chain Analysis
        FIG. 100 Key Mandates and Regulations
        FIG. 101 Technology Roadmap and Timeline
        FIG. 102 Market Attractiveness Analysis – By Application
        FIG. 103 Market Attractiveness Analysis – By Region
        FIG. 104 Manufacturing Cost Structure of Dimethyl Disulfide
        FIG. 105 Dimethyl Disulfide Industrial Chain Analysis
        FIG. 106 Market Channel
        FIG. 107 Marketing Channel Development Trend
        FIG. 108 Growth in World Gross Product, 2008-2018

        List of Tables

        TABLE 1 Global Dimethyl Disulfide market, 2018 & 2025 (USD Million)
        TABLE 2 Global Dimethyl Disulfide market, by Application, 2016-2026 (USD Million)
        TABLE 3 Global Dimethyl Disulfide market, by Application, 2016-2026 (Kilo Tons)
        TABLE 4 Global Dimethyl Disulfide market, by region, 2016-2026 (USD Million)
        TABLE 5 Global Dimethyl Disulfide market, by region, 2016-2026 (Kilo Tons)
        TABLE 6 North America Dimethyl Disulfide Market, by Application, 2016-2026 (USD Million)
        TABLE 7 North America Dimethyl Disulfide Market, by Application, 2016-2026 (Kilo Tons)
        TABLE 8 Europe Dimethyl Disulfide Market, by Application, 2016-2026 (USD Million)
        TABLE 9 Europe Dimethyl Disulfide Market, by Application, 2016-2026 (Kilo Tons)
        TABLE 10 Asia Pacific Dimethyl Disulfide Market, by Application, 2016-2026 (USD Million)
        TABLE 11 Asia Pacific Dimethyl Disulfide Market, by Application, 2016-2026 (Kilo Tons)
        TABLE 12 Latin America Dimethyl Disulfide Market, by Application, 2016-2026 (USD Million)
        TABLE 13 Latin America Dimethyl Disulfide Market, by Application, 2016-2026 (Kilo Tons)
        TABLE 14 The Middle-East and Africa Dimethyl Disulfide Market, by Application, 2016-2026 (USD Million)
        TABLE 15 The Middle-East and Africa Dimethyl Disulfide Market, by Application, 2016-2026 (Kilo Tons)
        TABLE 16 North America Dimethyl Disulfide Production, Consumption, Export, Import, 2016-2019
        TABLE 17 Europe Dimethyl Disulfide Production, Consumption, Export, Import, 2016-2019
        TABLE 18 Asia Pacific Dimethyl Disulfide Production, Consumption, Export, Import, 2016-2019
        TABLE 19 Latin America Dimethyl Disulfide Production, Consumption, Export, Import, 2016-2019
        TABLE 20 Middle East & Africa Dimethyl Disulfide Production, Consumption, Export, Import, 2016-2019
        TABLE 21 Global Dimethyl Disulfide Market - Company Revenue Analysis 2016-2019 (USD Million)
        TABLE 22 Global Dimethyl Disulfide Market - Company Revenue Share Analysis 2016-2019(%)
        TABLE 23 Global Dimethyl Disulfide Market - Company Volume Analysis 2016-2019 (Kilo Tons)
        TABLE 24 Global Dimethyl Disulfide Market - Company Volume Share Analysis 2016-2019(%)
        TABLE 25 Acquisitions and Mergers
        TABLE 26 New Product/Service Launch
        TABLE 27 Research & Development Activities
        TABLE 28 Market Drivers
        TABLE 29 Market Restraints
        TABLE 30 Market Opportunities
        TABLE 31 Production Base and Market Concentration Rate of Raw Material
        TABLE 32 Key Suppliers of Raw Materials
        TABLE 33 Raw Materials Sources of Dimethyl Disulfide Major Manufacturers in 2016
        TABLE 34 Major Buyers of Dimethyl Disulfide
        TABLE 35 Distributors/Traders of Dimethyl Disulfide by Region
        

Industry Major Market Players

  •  Chevron Phillips Chemical Company LLC.
  •  IRO Group Inc.
  •  Shinya Chem Co.Ltd.
  •  Arkema S.A.
  •  Hangzhou Rongshunjia Technology Co.Ltd.
  •  Haihang Industry Co.Ltd.
  •  Varsal Inc.
  •  Penta International Corporation
  •  Alpha Chemika
  •  Tianjin TopGlobal Co.Ltd.