Search Market Research Report

Discover Our Latest Reports
Discover Our Featured Reports
Discover Top Selling Reports

Digital Oscilloscope Market Size, Share Global Analysis Report, 2020–2026

report img

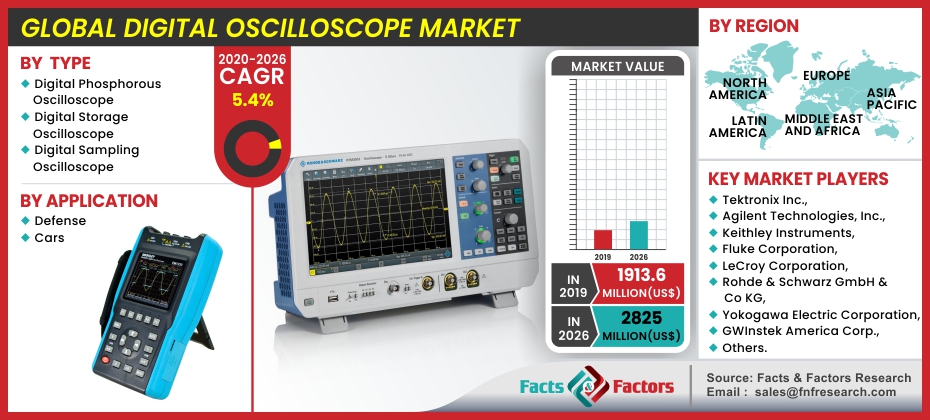
Digital Oscilloscope Market By Type (Digital Phosphorous Oscilloscope, Digital Storage Oscilloscope, and Digital Sampling Oscilloscope), and Application (Defence and Cars): Global Industry Outlook, Market Size, Business Intelligence, Consumer Preferences, Statistical Surveys, Comprehensive Analysis, Historical Developments, Current Trends, and Forecast 2020–2026

Industry Insights

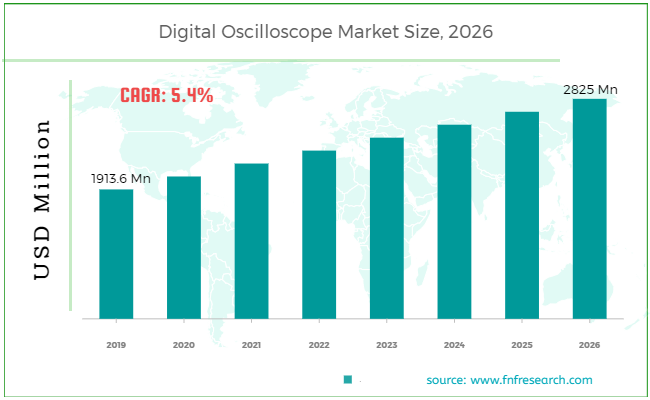
[185+ Pages Report] According to the report published by Facts Factors, the global digital oscilloscope market size was worth around USD 1913.6 million in 2019 and is predicted to grow to around USD 2825 million by 2026 with a compound annual growth rate (CAGR) of roughly 5.4% between 2020 and 2026. The report analyzes the global digital oscilloscope market drivers, restraints/challenges, and the effect they have on the demands during the projection period. In addition, the report explores emerging opportunities in the digital oscilloscope market.

Digital Oscilloscope Market Size

To know more about this report | Request Free Sample Copy

This specialized and expertise oriented industry research report scrutinizes the technical and commercial business outlook of the digital oscilloscope industry. The report analyzes and declares the historical and current trends analysis of the digital oscilloscope industry and subsequently recommends the projected trends anticipated to be observed in the digital oscilloscope market during the upcoming years.


logoKey Insights from Primary Research

  • As per our primary respondents, the global digital oscilloscope market was valued at around USD 1.9 Billion in 2019.
  • It was established through primary research that the Asia Pacific was the leading target market region in 2019.
  • Augmentation in demand for signal storage facilities and rising demand for safety features in automotive vehicles are the key factors boosting the target market growth.
  • Cars category of application segment majorly augmented the target market growth in 2019.
  • Rise in demand for safety features in automotive vehicles has compelled automotive OEMs to add safety features in their vehicles. This accelerated the target market demand.

logoKey Recommendations from Analysts

  • The digital oscilloscope market is projected to reach around USD 2825 Million by 2026
  • The target market is anticipated to grow at a CAGR of 5.4% between 2020 and 2026
  • The Asia Pacific is anticipated to continue its dominance in terms of the target market over the forecast period.
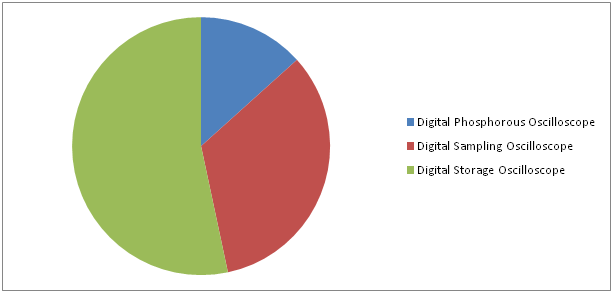
  • Digital storage oscilloscope category of type segment in terms of the target market is projected to continue its lead over the forecast period.
  • A huge amount of manufacturing of component electronics as well as semiconductors in Asia Pacific countries such as China and India are projected to propel the target market in the region.

logoGlobal Digital Oscilloscope Market Revenue Share In 2019– By Type

Digital Oscilloscope Market

To know more about this report | Request Free Sample Copy


The digital oscilloscope market report analyzes and notifies the industry statistics at the global as well as regional and country levels in order to acquire a thorough perspective of the entire digital oscilloscope market. The historical and past insights are provided for FY 2016 to FY 2019 whereas projected trends are delivered for FY 2020 to FY 2026. The quantitative and numerical data is represented in terms of value (USD Million) and volume (Units) from FY 2016 – 2026.

The quantitative data is further underlined and reinforced by comprehensive qualitative data which comprises various across-the-board market dynamics. The rationales which directly or indirectly impact the digital oscilloscope industry are exemplified through parameters such as growth drivers, restraints, challenges, and opportunities among other impacting factors.

Throughout our research report, we have encompassed all the proven models and tools of industry analysis and extensively illustrated all the key business strategies and business models adopted in the digital oscilloscope industry. The report provides an all-inclusive and detailed competitive landscape prevalent in the digital oscilloscope market.

The report utilizes established industry analysis tools and models such as Porter’s Five Forces framework to analyze and recognize critical business strategies adopted by various stakeholders involved in the entire value chain of the digital oscilloscope industry. The digital oscilloscope market report additionally employs SWOT analysis and PESTLE analysis models for further in-depth analysis.

Digital Oscilloscope Market

To know more about this report | Request Free Sample Copy

The report study further includes an in-depth analysis of industry players' market shares and provides an overview of leading players' market position in the digital oscilloscope sector. Key strategic developments in the digital oscilloscope market competitive landscape such as acquisitions & mergers, inaugurations of different products and services, partnerships & joint ventures, MoU agreements, VC & funding activities, R&D activities, and geographic expansion among other noteworthy activities by key players of the digital oscilloscope market are appropriately highlighted in the report.

The global digital oscilloscope market is experiencing important growth that is predicted to continue over the upcoming years. Increasing demand for safety and protection features in terms of automotive vehicles is likely to act as a key driver of the global digital oscilloscope market.

The digital oscilloscope market research report delivers an acute valuation and taxonomy of the digital oscilloscope industry by practically splitting the market on the basis of a different type, application, and region. Through the analysis of the historical and projected trends, all the segments and sub-segments were evaluated through the bottom-up approach, and different market sizes have been projected for FY 2020 to FY 2026. The regional segmentation of the digital oscilloscope industry includes the complete classification of all the major continents including North America, Latin America, Europe, Asia Pacific, and the Middle East & Africa. Further, country-wise data for the digital oscilloscope industry is provided for the leading economies of the world.

The digital oscilloscope market is segmented based on type and application. On the basis of type segmentation, the market is classified into the digital phosphorous oscilloscope, digital storage oscilloscope, and digital sampling oscilloscope. On the basis of application segmentation, the market is classified as defense and cars.

logoReport Scope

Report Attribute

Details

Market Size in 2019

USD 1913.6 Million

Projected Market Size in 2026

USD 2825 Million

CAGR Growth Rate

5.4% CAGR

Base Year

2021

Forecast Years

2022-2028

Key Market Players

Tektronix Inc., Agilent Technologies, Inc., Keithley Instruments, Fluke Corporation, LeCroy Corporation, Rohde & Schwarz GmbH & Co KG, Yokogawa Electric Corporation, GWInstek America Corp., ZTEC Instruments, Inc., among others.

Key Segment

By Type,By Application, By Region

Major Regions Covered

North America, Europe, Asia Pacific, Latin America, and the Middle East & Africa

Purchase Options

Request customized purchase options to meet your research needs. Explore purchase options

logoSome of the essential players operating in the digital oscilloscope market, but not restricted to include

  • Tektronix Inc.
  • Agilent Technologies Inc.
  • Keithley Instruments
  • Fluke Corporation
  • LeCroy Corporation
  • Rohde & Schwarz GmbH & Co KG
  • Yokogawa Electric Corporation
  • GWInstek America Corp.
  • ZTEC Instruments Inc.

The taxonomy of the digital oscilloscope market by its scope and segmentation is as follows:

logoBy Type Segmentation Analysis

  • Digital Phosphorous Oscilloscope
  • Digital Storage Oscilloscope
  • Digital Sampling Oscilloscope

logoBy Application Segmentation Analysis

  • Defense
  • Cars

logoBy Regional Segmentation Analysis

  • North America
    • The U.S.
    • Canada
  • Europe
    • Germany
    • The UK
    • France
    • Spain
    • Italy
    • Rest of Europe
  • Asia Pacific
    • China
    • Japan
    • India
    • South Korea
    • Southeast Asia
    • Rest of Asia Pacific
  • Latin America
    • Brazil
    • Mexico
    • Rest of Latin America
  • Middle East & Africa
    • GCC
    • South Africa
    • Rest of Middle East & Africa

Table of Content

  1. Chapter 1 Executive Summary
    1. 1.1. Introduction of Digital Oscilloscope
    2. 1.2. Global Digital Oscilloscope Market, 2019 & 2026 (USD Million)
    3. 1.3. Global Digital Oscilloscope Market, 2016 – 2026 (USD Million) (Units)
    4. 1.4. Global Digital Oscilloscope Market Absolute Revenue Opportunity, 2016 – 2026 (USD Million)
    5. 1.5. Global Digital Oscilloscope Market Incremental Revenue Opportunity, 2020 – 2026 (USD Million)
  2. Chapter 2 Digital Oscilloscope Market – Type Analysis
    1. 2.1. Global Digital Oscilloscope Market – Type Overview
    2. 2.2. Global Digital Oscilloscope Market Share, by Type, 2019 & 2026 (USD Million)
    3. 2.3. Global Digital Oscilloscope Market share, by Type, 2019 & 2026 (Units)
    4. 2.4. Digital Phosphorous Oscilloscope
      1. 2.4.1. Global Digital Phosphorous Oscilloscope Digital Oscilloscope Market, 2016 – 2026 (USD Million)
      2. 2.4.2. Global Digital Phosphorous Oscilloscope Digital Oscilloscope Market, 2016 – 2026 (Units)
    5. 2.5. Digital Storage Oscilloscope
      1. 2.5.1. Global Digital Storage Oscilloscope Digital Oscilloscope Market, 2016 – 2026 (USD Million)
      2. 2.5.2. Global Digital Storage Oscilloscope Digital Oscilloscope Market, 2016 – 2026 (Units)
    6. 2.6. Digital Sampling Oscilloscope
      1. 2.6.1. Global Digital Sampling Oscilloscope Digital Oscilloscope Market, 2016 – 2026 (USD Million)
      2. 2.6.2. Global Digital Sampling Oscilloscope Digital Oscilloscope Market, 2016 – 2026 (Units)
  3. Chapter 3 Digital Oscilloscope Market – Application Analysis
    1. 3.1. Global Digital Oscilloscope Market – Application Overview
    2. 3.2. Global Digital Oscilloscope Market Share, by Application, 2019 & 2026 (USD Million)
    3. 3.3. Global Digital Oscilloscope Market share, by Application, 2019 & 2026 (Units)
    4. 3.4. Defense
      1. 3.4.1. Global Defense Digital Oscilloscope Market, 2016 – 2026 (USD Million)
      2. 3.4.2. Global Defense Digital Oscilloscope Market, 2016 – 2026 (Units)
    5. 3.5. Cars
      1. 3.5.1. Global Cars Digital Oscilloscope Market, 2016 – 2026 (USD Million)
      2. 3.5.2. Global Cars Digital Oscilloscope Market, 2016 – 2026 (Units)
  4. Chapter 4 Digital Oscilloscope Market – Regional Analysis
    1. 4.1. Global Digital Oscilloscope Market Regional Overview
    2. 4.2. Global Digital Oscilloscope Market Share, by Region, 2019 & 2026 (USD Million)
    3. 4.3. Global Digital Oscilloscope Market Share, by Region, 2019 & 2026 (Units)
    4. 4.4. North America
      1. 4.4.1. North America Digital Oscilloscope Market, 2016 – 2026 (USD Million)
      2. 4.4.2. North America Market, 2016 – 2026 (Units)
      3. 4.4.3. North America Digital Oscilloscope Market, by Type, 2016 – 2026
      4. 4.4.4. North America Digital Oscilloscope Market, by Application, 2016 – 2026
      5. 4.4.5. U.S.
      6. 4.4.6. Canada
    5. 4.5. Europe
      1. 4.5.1. Europe Digital Oscilloscope Market, 2016 – 2026 (USD Million)
      2. 4.5.2. Europe Market, 2016 – 2026 (Units)
      3. 4.5.3. Europe Digital Oscilloscope Market, by Type, 2016 – 2026
      4. 4.5.4. Europe Digital Oscilloscope Market, by Application, 2016 – 2026
      5. 4.5.5. Germany
      6. 4.5.6. France
      7. 4.5.7. U.K.
      8. 4.5.8. Italy
      9. 4.5.9. Spain
      10. 4.5.10. Rest of Europe
    6. 4.6. Asia Pacific
      1. 4.6.1. Asia Pacific Digital Oscilloscope Market, 2016 – 2026 (USD Million)
      2. 4.6.2. Asia Pacific Market, 2016 – 2026 (Units)
      3. 4.6.3. Asia Pacific Digital Oscilloscope Market, by Type, 2016 – 2026
      4. 4.6.4. Asia Pacific Digital Oscilloscope Market, by Application, 2016 – 2026
      5. 4.6.5. China
      6. 4.6.6. Japan
      7. 4.6.7. India
      8. 4.6.8. South Korea
      9. 4.6.9. South-East Asia
      10. 4.6.10. Rest of Asia Pacific
    7. 4.7. Latin America
      1. 4.7.1. Latin America Digital Oscilloscope Market, 2016 – 2026 (USD Million)
      2. 4.7.2. Latin America Market, 2016 – 2026 (Units)
      3. 4.7.3. Latin America Digital Oscilloscope Market, by Type, 2016 – 2026
      4. 4.7.4. Latin America Digital Oscilloscope Market, by Application, 2016 – 2026
      5. 4.7.5. Brazil
      6. 4.7.6. Mexico
      7. 4.7.7. Rest of Latin America
    8. 4.8. The Middle-East and Africa
      1. 4.8.1. The Middle-East and Africa Digital Oscilloscope Market, 2016 – 2026 (USD Million)
      2. 4.8.2. The Middle-East and Africa Market, 2016 – 2026 (Units)
      3. 4.8.3. The Middle-East and Africa Digital Oscilloscope Market, by Type, 2016 – 2026
      4. 4.8.4. The Middle-East and Africa Digital Oscilloscope Market, by Application, 2016 – 2026
      5. 4.8.5. GCC Countries
      6. 4.8.6. South Africa
      7. 4.8.7. Rest of Middle-East Africa
  5. Chapter 5 Digital Oscilloscope Production, Consumption, Export, Import by Regions
    1. 5.1. Global Digital Oscilloscope Production and Consumption, 2016 – 2026 (Units)
    2. 5.2. Global Import and Export Analysis, by Region
  6. Chapter 6 Digital Oscilloscope Market – Competitive Landscape
    1. 6.1. Competitor Market Share – Revenue
    2. 6.2. Market Concentration Rate Analysis, Top 3 and Top 5 Players
    3. 6.3. Competitor Market Share – Volume
    4. 6.4. Strategic Developments
      1. 6.4.1. Acquisitions and Mergers
      2. 6.4.2. New Products
      3. 6.4.3. Research & Development Activities
  7. Chapter 7 Company Profiles
    1. 7.1. Tektronix Inc.
      1. 7.1.1. Company Overview
      2. 7.1.2. Product/Service Portfolio
      3. 7.1.3. Tektronix Inc. Sales, Revenue, Price, and Gross Margin
      4. 7.1.4. Tektronix Inc. Revenue and Growth Rate
      5. 7.1.5. Tektronix Inc. Market Share
      6. 7.1.6. Recent Initiatives, Funding/VC Activities, and Technological Innovations
    2. 7.2. Agilent Technologies Inc.
      1. 7.2.1. Company Overview
      2. 7.2.2. Product/Service Portfolio
      3. 7.2.3. Agilent Technologies Inc. Sales, Revenue, Price, and Gross Margin
      4. 7.2.4. Agilent Technologies Inc. Revenue and Growth Rate
      5. 7.2.5. Agilent Technologies Inc. Market Share
      6. 7.2.6. Recent Initiatives, Funding/VC Activities, and Technological Innovations
    3. 7.3. Keithley Instruments
      1. 7.3.1. Company Overview
      2. 7.3.2. Product/Service Portfolio
      3. 7.3.3. Keithley Instruments Sales, Revenue, Price, and Gross Margin
      4. 7.3.4. Keithley Instruments Revenue and Growth Rate
      5. 7.3.5. Keithley Instruments Market Share
      6. 7.3.6. Recent Initiatives, Funding/VC Activities, and Technological Innovations
    4. 7.4. Fluke Corporation
      1. 7.4.1. Company Overview
      2. 7.4.2. Product/Service Portfolio
      3. 7.4.3. Fluke Corporation Sales, Revenue, Price, and Gross Margin
      4. 7.4.4. Fluke Corporation Revenue and Growth Rate
      5. 7.4.5. Fluke Corporation Market Share
      6. 7.4.6. Recent Initiatives, Funding/VC Activities, and Technological Innovations
    5. 7.5. LeCroy Corporation
      1. 7.5.1. Company Overview
      2. 7.5.2. Product/Service Portfolio
      3. 7.5.3. LeCroy Corporation Sales, Revenue, Price, and Gross Margin
      4. 7.5.4. LeCroy Corporation Revenue and Growth Rate
      5. 7.5.5. LeCroy Corporation Market Share
      6. 7.5.6. Recent Initiatives, Funding/VC Activities, and Technological Innovations
    6. 7.6. Rohde & Schwarz GmbH & Co KG
      1. 7.6.1. Company Overview
      2. 7.6.2. Product/Service Portfolio
      3. 7.6.3. Rohde & Schwarz GmbH & Co KG Sales, Revenue, Price, and Gross Margin
      4. 7.6.4. Rohde & Schwarz GmbH & Co KG Revenue and Growth Rate
      5. 7.6.5. Rohde & Schwarz GmbH & Co KG Market Share
      6. 7.6.6. Recent Initiatives, Funding/VC Activities, and Technological Innovations
    7. 7.7. Yokogawa Electric Corporation
      1. 7.7.1. Company Overview
      2. 7.7.2. Product/Service Portfolio
      3. 7.7.3. Yokogawa Electric Corporation Sales, Revenue, Price, and Gross Margin
      4. 7.7.4. Yokogawa Electric Corporation Revenue and Growth Rate
      5. 7.7.5. Yokogawa Electric Corporation Market Share
      6. 7.7.6. Recent Initiatives, Funding/VC Activities, and Technological Innovations
    8. 7.8. GWInstek America Corp.
      1. 7.8.1. Company Overview
      2. 7.8.2. Product/Service Portfolio
      3. 7.8.3. GWInstek America Corp. Sales, Revenue, Price, and Gross Margin
      4. 7.8.4. GWInstek America Corp. Revenue and Growth Rate
      5. 7.8.5. GWInstek America Corp. Market Share
      6. 7.8.6. Recent Initiatives, Funding/VC Activities, and Technological Innovations
    9. 7.9. ZTEC Instruments Inc.
      1. 7.9.1. Company Overview
      2. 7.9.2. Product/Service Portfolio
      3. 7.9.3. ZTEC Instruments Inc. Sales, Revenue, Price, and Gross Margin
      4. 7.9.4. ZTEC Instruments Inc. Revenue and Growth Rate
      5. 7.9.5. ZTEC Instruments Inc. Market Share
      6. 7.9.6. Recent Initiatives, Funding/VC Activities, and Technological Innovations
    10. 7.10. Others
      1. 7.10.1. Company Overview
      2. 7.10.2. Product/Service Portfolio
      3. 7.10.3. Others Sales, Revenue, Price, and Gross Margin
      4. 7.10.4. Others Revenue and Growth Rate
      5. 7.10.5. Others Market Share
      6. 7.10.6. Recent Initiatives, Funding/VC Activities, and Technological Innovations
  8. Chapter 8 Digital Oscilloscope — Industry Analysis
    1. 8.1. Introduction and Taxonomy
    2. 8.2. Digital Oscilloscope Market – Key Trends
      1. 8.2.1. Market Drivers
      2. 8.2.2. Market Restraints
      3. 8.2.3. Market Opportunities
    3. 8.3. Value Chain Analysis
    4. 8.4. Key Mandates and Regulations
    5. 8.5. Technology Roadmap and Timeline
    6. 8.6. Digital Oscilloscope Market – Attractiveness Analysis
      1. 8.6.1. By Type
      2. 8.6.2. By Application
      3. 8.6.3. By Region
  9. Chapter 9 Raw Material Analysis
    1. 9.1. Digital Oscilloscope Key Raw Material Analysis
      1. 9.1.1. Key Raw Materials
      2. 9.1.2. Price Trend of Key Raw Materials
    2. 9.2. Key Suppliers of Raw Materials
    3. 9.3. Proportion of Manufacturing Cost Structure
      1. 9.3.1. Raw Materials Cost
      2. 9.3.2. Labor Cost
      3. 9.3.3. Manufacturing Expenses
      4. 9.3.4. Miscellaneous Expenses
    4. 9.4. Manufacturing Cost Analysis of Digital Oscilloscope
  10. Chapter 10 Industrial Chain, Sourcing Strategy, and Downstream Buyers
    1. 10.1. Digital Oscilloscope Industrial Chain Analysis
    2. 10.2. Upstream Raw Materials Sourcing
      1. 10.2.1. Risk Mitigation:
      2. 10.2.2. Supplier Relationships:
      3. 10.2.3. Business Processes:
      4. 10.2.4. Securing the Product:
    3. 10.3. Raw Materials Sources of Digital Oscilloscope Major Manufacturers
    4. 10.4. Downstream Buyers
    5. 10.5. Distributors/Traders List
  11. Chapter 11 Marketing Strategy Analysis, Distributors
    1. 11.1. Marketing Channel
    2. 11.2. Direct Marketing
    3. 11.3. Indirect Marketing
    4. 11.4. Marketing Channel Development Trends
    5. 11.5. Economic/Political Environmental Change
  12. Chapter 12 Report Conclusion & Key Insights
    1. 12.1. Key Insights from Primary Interviews & Surveys Respondents
    2. 12.2. Key Takeaways from Analysts, Consultants, and Industry Leaders
  13. Chapter 13 Research Approach & Methodology
    1. 13.1. Report Description
    2. 13.2. Research Scope
    3. 13.3. Research Methodology
      1. 13.3.1. Secondary Research
      2. 13.3.2. Primary Research
      3. 13.3.3. Statistical Models
      4. 13.3.4. Research Limitations

      List of Figures

      Fig.1 Product Picture of Digital Oscilloscope
      Fig.2 Global Digital Oscilloscope Market, 2016 – 2026 (USD Million)
      Fig.3 Global Digital Oscilloscope Market, 2016 – 2026 (Units)
      Fig.4 Global Digital Oscilloscope Market Absolute Revenue Opportunity, 2016 – 2026 (USD Million)
      Fig.5 Global Digital Oscilloscope Market Incremental Revenue Opportunity, 2020 – 2026 (USD Million)
      Fig.6 Global Digital Oscilloscope Market Share, by Type, 2019 & 2026 (USD Million)
      Fig.7 Global Digital Oscilloscope Market Share, by Type, 2019 & 2026 (Units)
      Fig.8 Global Digital Phosphorous Oscilloscope Digital Oscilloscope Market, 2016 – 2026 (USD Million)
      Fig.9 Global Digital Phosphorous Oscilloscope Digital Oscilloscope Market, 2016 – 2026 (Units)
      Fig.10 Global Digital Storage Oscilloscope Digital Oscilloscope Market, 2016 – 2026 (USD Million)
      Fig.11 Global Digital Storage Oscilloscope Digital Oscilloscope Market, 2016 – 2026 (Units)
      Fig.12 Global Digital Sampling Oscilloscope Digital Oscilloscope Market, 2016 – 2026 (USD Million)
      Fig.13 Global Digital Sampling Oscilloscope Digital Oscilloscope Market, 2016 – 2026 (Units)
      Fig.14 Global Digital Oscilloscope Market Share, by Application, 2019 & 2026 (USD Million)
      Fig.15 Global Digital Oscilloscope Market Share, by Application, 2019 & 2026 (Units)
      Fig.16 Global Defense Digital Oscilloscope Market, 2016 – 2026 (USD Million)
      Fig.17 Global Defense Digital Oscilloscope Market, 2016 – 2026 (Units)
      Fig.18 Global Cars Digital Oscilloscope Market, 2016 – 2026 (USD Million)
      Fig.19 Global Cars Digital Oscilloscope Market, 2016 – 2026 (Units)
      Fig.20 Global Digital Oscilloscope Market Share, by Region, 2019 & 2026 (USD Million)
      Fig.21 Global Digital Oscilloscope Market Share, by Region, 2019 & 2026 (Units)
      Fig.22 North America Digital Oscilloscope Market, 2016 – 2026 (USD Million)
      Fig.23 North America Digital Oscilloscope Market, 2016 – 2026 (Units)
      Fig.24 U.S. Digital Oscilloscope Market, 2016 – 2026 (USD Million)
      Fig.25 U.S. Digital Oscilloscope  Market, 2016 – 2026 (Units)
      Fig.26 Canada Digital Oscilloscope Market, 2016 – 2026 (USD Million)
      Fig.27 Canada Digital Oscilloscope  Market, 2016 – 2026 (Units)
      Fig.28 Europe Digital Oscilloscope Market, 2016 – 2026 (USD Million)
      Fig.29 Europe Digital Oscilloscope Market, 2016 – 2026 (Units)
      Fig.30 Germany Digital Oscilloscope Market, 2016 – 2026 (USD Million)
      Fig.31 Germany Digital Oscilloscope  Market, 2016 – 2026 (Units)
      Fig.32 France Digital Oscilloscope Market, 2016 – 2026 (USD Million)
      Fig.33 France Digital Oscilloscope  Market, 2016 – 2026 (Units)
      Fig.34 U.K. Digital Oscilloscope Market, 2016 – 2026 (USD Million)
      Fig.35 U.K. Digital Oscilloscope  Market, 2016 – 2026 (Units)
      Fig.36 Italy Digital Oscilloscope Market, 2016 – 2026 (USD Million)
      Fig.37 Italy Digital Oscilloscope  Market, 2016 – 2026 (Units)
      Fig.38 Spain Digital Oscilloscope Market, 2016 – 2026 (USD Million)
      Fig.39 Spain Digital Oscilloscope  Market, 2016 – 2026 (Units)
      Fig.40 Rest of Europe Digital Oscilloscope Market, 2016 – 2026 (USD Million)
      Fig.41 Rest of Europe Digital Oscilloscope  Market, 2016 – 2026 (Units)
      Fig.42 Asia Pacific Digital Oscilloscope Market, 2016 – 2026 (USD Million)
      Fig.43 Asia Pacific Digital Oscilloscope Market, 2016 – 2026 (Units)
      Fig.44 China Digital Oscilloscope Market, 2016 – 2026 (USD Million)
      Fig.45 China Digital Oscilloscope  Market, 2016 – 2026 (Units)
      Fig.46 Japan Digital Oscilloscope Market, 2016 – 2026 (USD Million)
      Fig.47 Japan Digital Oscilloscope  Market, 2016 – 2026 (Units)
      Fig.48 India Digital Oscilloscope Market, 2016 – 2026 (USD Million)
      Fig.49 India Digital Oscilloscope  Market, 2016 – 2026 (Units)
      Fig.50 South  Korea Digital Oscilloscope Market, 2016 – 2026 (USD Million)
      Fig.51 South  Korea Digital Oscilloscope  Market, 2016 – 2026 (Units)
      Fig.52 South-East Asia Digital Oscilloscope Market, 2016 – 2026 (USD Million)
      Fig.53 South-East Asia Digital Oscilloscope  Market, 2016 – 2026 (Units)
      Fig.54 Rest of Asia Pacific Digital Oscilloscope Market, 2016 – 2026 (USD Million)
      Fig.55 Rest of Asia Pacific Digital Oscilloscope  Market, 2016 – 2026 (Units)
      Fig.56 Latin America Digital Oscilloscope Market, 2016 – 2026 (USD Million)
      Fig.57 Latin America Digital Oscilloscope Market, 2016 – 2026 (Units)
      Fig.58 Brazil Digital Oscilloscope Market, 2016 – 2026 (USD Million)
      Fig.59 Brazil Digital Oscilloscope  Market, 2016 – 2026 (Units)
      Fig.60 Mexico Digital Oscilloscope Market, 2016 – 2026 (USD Million)
      Fig.61 Mexico Digital Oscilloscope  Market, 2016 – 2026 (Units)
      Fig.62 Rest of Latin America Digital Oscilloscope Market, 2016 – 2026 (USD Million)
      Fig.63 Rest of Latin America Digital Oscilloscope  Market, 2016 – 2026 (Units)
      Fig.64 The Middle-East and Africa Digital Oscilloscope Market, 2016 – 2026 (USD Million)
      Fig.65 The Middle-East and Africa Digital Oscilloscope Market, 2016 – 2026 (Units)
      Fig.66 GCC Countries Digital Oscilloscope Market, 2016 – 2026 (USD Million)
      Fig.67 GCC Countries Digital Oscilloscope  Market, 2016 – 2026 (Units)
      Fig.68 South Africa Digital Oscilloscope Market, 2016 – 2026 (USD Million)
      Fig.69 South Africa Digital Oscilloscope  Market, 2016 – 2026 (Units)
      Fig.70 Rest of Middle-East Africa Digital Oscilloscope Market, 2016 – 2026 (USD Million)
      Fig.71 Rest of Middle-East Africa Digital Oscilloscope  Market, 2016 – 2026 (Units)
      Fig.72 Global Digital Oscilloscope Production and Consumption, 2016 – 2026 (Units)
      Fig.73 North America Digital Oscilloscope Production and Consumption, 2016 – 2026 (USD Million) (Units)
      Fig.74 Europe Digital Oscilloscope Production and Consumption, 2016 – 2026 (USD Million) (Units)
      Fig.75 Asia Pacific Digital Oscilloscope Production and Consumption, 2016 – 2026 (USD Million) (Units)
      Fig.76 Latin America Digital Oscilloscope Production and Consumption, 2016 – 2026 (USD Million) (Units)
      Fig.77 The Middle-East and Africa Digital Oscilloscope Production and Consumption, 2016 – 2026 (USD Million) (Units)
      Fig.78 Competitor Market Share – Revenue
      Fig.79 Competitor Market Share – Volume
      Fig.80 Tektronix Inc. Revenue and Growth Rate
      Fig.81 Tektronix Inc. Market Share
      Fig.82 Agilent Technologies Inc. Revenue and Growth Rate
      Fig.83 Agilent Technologies Inc. Market Share
      Fig.84 Keithley Instruments Revenue and Growth Rate
      Fig.85 Keithley Instruments Market Share
      Fig.86 Fluke Corporation Revenue and Growth Rate
      Fig.87 Fluke Corporation Market Share
      Fig.88 LeCroy Corporation Revenue and Growth Rate
      Fig.89 LeCroy Corporation Market Share
      Fig.90 Rohde & Schwarz GmbH & Co KG Revenue and Growth Rate
      Fig.91 Rohde & Schwarz GmbH & Co KG Market Share
      Fig.92 Yokogawa Electric Corporation Revenue and Growth Rate
      Fig.93 Yokogawa Electric Corporation Market Share
      Fig.94 GWInstek America Corp. Revenue and Growth Rate
      Fig.95 GWInstek America Corp. Market Share
      Fig.96 ZTEC Instruments Inc. Revenue and Growth Rate
      Fig.97 ZTEC Instruments Inc. Market Share
      Fig.98 Others Revenue and Growth Rate
      Fig.99 Others Market Share
      Fig.100 Market Dynamics
      Fig.101 Global Digital Oscilloscope – Value Chain Analysis
      Fig.102 Key Mandates and Regulations
      Fig.103 Technology Roadmap and Timeline
      Fig.104 Market Attractiveness Analysis – By Type
      Fig.105 Market Attractiveness Analysis – By Application
      Fig.106 Market Attractiveness Analysis – By Region
      Fig.107 Manufacturing Cost Structure of Digital Oscilloscope
      Fig.108 Digital Oscilloscope Industrial Chain Analysis
      Fig.109 Market Channels
      Fig.110 Marketing Channel Development Trend
      Fig.111 Growth in World Gross Product, 2008-2018
      

      List of Tables

      Table 1 Global Digital Oscilloscope Market, 2019 & 2026 (USD Million)
      Table 2 Global Digital Oscilloscope Market, by Type, 2016 – 2026 (USD Million)
      Table 3 Global Digital Oscilloscope Market, by Type, 2016 – 2026 (Units)
      Table 4 Global Digital Oscilloscope Market, by Application, 2016 – 2026 (USD Million)
      Table 5 Global Digital Oscilloscope Market, by Application, 2016 – 2026 (Units)
      Table 6 Global Digital Oscilloscope Market, by Region, 2016 – 2026 (USD Million)
      Table 7 Global Digital Oscilloscope Market, by Region, 2016 – 2026 (Units)
      Table 8 North America Digital Oscilloscope Market, by Country, 2016 – 2026 (USD Million)
      Table 9 North America Digital Oscilloscope Market, by Country, 2016 – 2026 (Units)
      Table 10 North America Digital Oscilloscope Market, by Type, 2016 – 2026 (USD Million)
      Table 11 North America Digital Oscilloscope Market, by Type, 2016 – 2026 (Units)
      Table 12 North America Digital Oscilloscope Market, by Application, 2016 – 2026 (USD Million)
      Table 13 North America Digital Oscilloscope Market, by Application, 2016 – 2026 (Units)
      Table 14 Europe Digital Oscilloscope Market, by Country, 2016 – 2026 (USD Million)
      Table 15 Europe Digital Oscilloscope Market, by Country, 2016 – 2026 (Units)
      Table 16 Europe Digital Oscilloscope Market, by Type, 2016 – 2026 (USD Million)
      Table 17 Europe Digital Oscilloscope Market, by Type, 2016 – 2026 (Units)
      Table 18 Europe Digital Oscilloscope Market, by Application, 2016 – 2026 (USD Million)
      Table 19 Europe Digital Oscilloscope Market, by Application, 2016 – 2026 (Units)
      Table 20 Asia Pacific Digital Oscilloscope Market, by Country, 2016 – 2026 (USD Million)
      Table 21 Asia Pacific Digital Oscilloscope Market, by Country, 2016 – 2026 (Units)
      Table 22 Asia Pacific Digital Oscilloscope Market, by Type, 2016 – 2026 (USD Million)
      Table 23 Asia Pacific Digital Oscilloscope Market, by Type, 2016 – 2026 (Units)
      Table 24 Asia Pacific Digital Oscilloscope Market, by Application, 2016 – 2026 (USD Million)
      Table 25 Asia Pacific Digital Oscilloscope Market, by Application, 2016 – 2026 (Units)
      Table 26 Latin America Digital Oscilloscope Market, by Country, 2016 – 2026 (USD Million)
      Table 27 Latin America Digital Oscilloscope Market, by Country, 2016 – 2026 (Units)
      Table 28 Latin America Digital Oscilloscope Market, by Type, 2016 – 2026 (USD Million)
      Table 29 Latin America Digital Oscilloscope Market, by Type, 2016 – 2026 (Units)
      Table 30 Latin America Digital Oscilloscope Market, by Application, 2016 – 2026 (USD Million)
      Table 31 Latin America Digital Oscilloscope Market, by Application, 2016 – 2026 (Units)
      Table 32 The Middle-East and Africa Digital Oscilloscope Market, by Country, 2016 – 2026 (USD Million)
      Table 33 The Middle-East and Africa Digital Oscilloscope Market, by Country, 2016 – 2026 (Units)
      Table 34 The Middle-East and Africa Digital Oscilloscope Market, by Type, 2016 – 2026 (USD Million)
      Table 35 The Middle-East and Africa Digital Oscilloscope Market, by Type, 2016 – 2026 (Units)
      Table 36 The Middle-East and Africa Digital Oscilloscope Market, by Application, 2016 – 2026 (USD Million)
      Table 37 The Middle-East and Africa Digital Oscilloscope Market, by Application, 2016 – 2026 (Units)
      Table 38 North America Digital Oscilloscope Production, Consumption, Export, Import, 2016 – 2019
      Table 39 Europe Digital Oscilloscope Production, Consumption, Export, Import, 2016 – 2019
      Table 40 Asia Pacific Digital Oscilloscope Production, Consumption, Export, Import, 2016 – 2019
      Table 41 Latin America Digital Oscilloscope Production, Consumption, Export, Import, 2016 – 2019
      Table 42 The Middle-East and Africa Digital Oscilloscope Production, Consumption, Export, Import, 2016 – 2019
      Table 43 Global Digital Oscilloscope Market - Company Revenue Analysis, 2016 – 2019 (USD Million)
      Table 44 Global Digital Oscilloscope Market - Company Revenue Share Analysis, 2016 – 2019 (%)
      Table 45 Global Digital Oscilloscope Market - Company Volume Analysis, 2016 – 2019 (Units)
      Table 46 Global Digital Oscilloscope Market - Company Volume Share Analysis, 2016 – 2019 (%)
      Table 47 Acquisitions and Mergers
      Table 48 Market Drivers – Impact Analysis
      Table 49 Market Restraints
      Table 50 Market Opportunities
      Table 51 Production Base and Market Concentration Rate of Raw Material
      Table 52 Key Suppliers of Raw Materials
      Table 53 Raw Materials Sources of Digital Oscilloscope Major Manufacturers
      Table 54 Major Buyers of Digital Oscilloscope
      Table 55 Distributors/Traders of Digital Oscilloscope by Region
      

Industry Major Market Players

  • Tektronix Inc.
  • Agilent Technologies Inc.
  • Keithley Instruments
  • Fluke Corporation
  • LeCroy Corporation
  • Rohde & Schwarz GmbH & Co KG
  • Yokogawa Electric Corporation
  • GWInstek America Corp.
  • ZTEC Instruments Inc.