![]()
Search Market Research Report
Delta-3-Carene Market Size, Share Global Analysis Report, 2020–2026

Delta-3-Carene Market By Type (Purity =90%, Purity =95%, and Purity <90%), By Application (Flavor Material, Solvents, and Others), and By End-Use Industries (Personal Care, Cosmetic & Perfumes, Food & Beverages, and Pharmaceuticals): Global Industry Outlook, Market Size, Business Intelligence, Consumer Preferences, Statistical Surveys, Comprehensive Analysis, Historical Developments, Current Trends, and Forecast 2020–2026
Industry Insights
The Delta-3-Carene market report analyzes and notifies the industry statistics at the global as well as regional and country levels in order to acquire a thorough perspective of the entire delta-3-Carene market. The historical and past insights are provided for FY 2016 to FY 2019 whereas projected trends are delivered for FY 2020 to FY 2026. The quantitative and numerical data is represented in terms of both volume (Tons) and value (USD Million) from FY 2016 – 2026.
This specialized and expertise-oriented industry research report scrutinizes the technical and commercial business outlook of the Delta-3-Carene industry. The report analyzes and declares the historical and current trends analysis of the Delta-3-Careneindustry and subsequently recommends the projected trends anticipated to be observed in the Delta-3-Carene market during the upcoming years.
 Key Insights from Primary Research
- According to the interview with industry participants, growing incidents of arthritis have been propelling the target market growth as delta-3-carene is effective in treating the disease as it relieves pain
- It helps in the reduction of acute inflammation, which has been boosting the target market growth
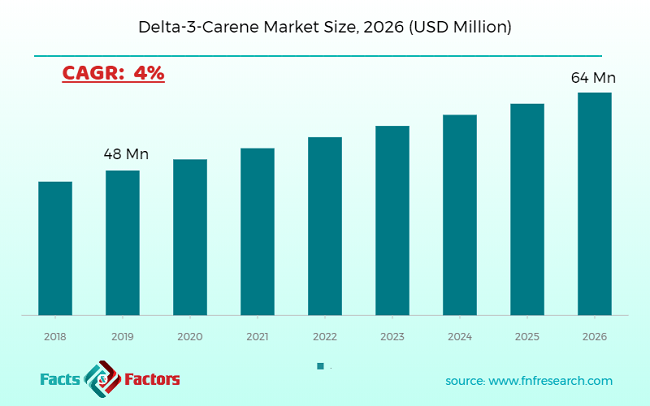
- The target market generated revenue of around USD 46 Million in 2026
- Purity ≥95%, solvent, and food & beverages categories of type, application, and end-use industry were the leading ones in 2018
- The Asia Pacific was the major revenue generator in 2018
Key Recommendations from Analysts
- As per our analyst, the rise in demand for bone repair associated with injury or malnutrition is estimated to boost the target market growth over the forecast period
- The target market is projected to generate revenue of around USD 64 Million in 2026
- The target market is expected to grow at a CAGR of around 4% over the forecast period
- Purity ≥95%, solvent, and food & beverages categories of type, application, and end-use industry are anticipated to be the leading ones in 2026
- Asia Pacific is estimated to lead the target market in 2026 as well
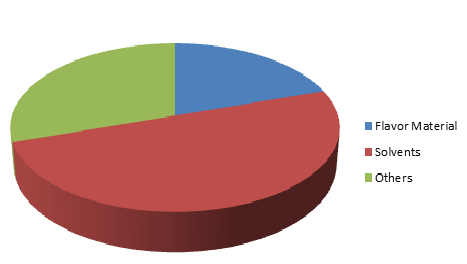
Market Share, by Application
The quantitative data is further underlined and reinforced by comprehensive qualitative data which comprises various across-the-board market dynamics. The rationales which directly or indirectly impact the Delta-3-Careneindustry are exemplified through parameters such as growth drivers, restraints, challenges, and opportunities among other impacting factors.
Throughout our research report, we have encompassed all the proven models and tools of industry analysis and extensively illustrated all the key business strategies and business models adopted in the Delta-3-Carene industry. The report provides an all-inclusive and detailed competitive landscape prevalent in the Delta-3-Carene market.
The report utilizes established industry analysis tools and models such as Porter’s Five Forces framework to analyze and recognize critical business strategies adopted by various stakeholders involved in the entire value chain of the Delta-3-Carene industry. The Delta-3-Carene market report additionally employs SWOT analysis and PESTLE analysis models for further in-depth analysis.
The report study further includes an in-depth analysis of industry players' market shares and provides an overview of leading players' market position in the Delta-3-Carene sector. Key strategic developments in the Delta-3-Carene market competitive landscape such as acquisitions & mergers, inaugurations of different products and services, partnerships & joint ventures, MoU agreements, VC & funding activities, R&D activities, and geographic expansion among other noteworthy activities by key players of the Delta-3-Carene market are appropriately highlighted in the report.
Delta-3-carene is an effective contributor in terms of fibromyalgia and arthritis which has been major driver for the target market as it reduces inflammation and joint pain. In addition, delta-3-carene is useful in terms of osteoporosis which has been augmenting the target market as well. Moreover, delta-3-carene is useful in promoting mental sharpness as well as memory retention; this has been boosting the target market growth. Delta-3-carene is significant in removing excess fluids from the body.
Delta-3-carene is valuable for medical marijuana patients who need pain relief stemming from inflammation. This has been accelerating the target market growth as well. Moreover, delta—3-carene is very significant for Alzheimer’s patients. It stimulates memory to help improve retention. This factor has increased the target market growth as well. However, a cannabis strain that includes delta-3-carene, leads to dry mouth and eyes. This is expected to hinder the target market growth over the forecast period. Nevertheless, growth in demand for bone repair in terms of injury or malnutrition is projected to create growth opportunities over the forecast period.
The Delta-3-Carene market research report delivers an acute valuation and taxonomy of the Delta-3-Carene industry by practically splitting the market on the basis of different types, applications, end-use industries, and regions. Through the analysis of the historical and projected trends, all the segments and sub-segments were evaluated through the bottom-up approach, and different market sizes have been projected for FY 2020 to FY 2026. The regional segmentation of the Delta-3-Carene industry includes the complete classification of all the major continents including North America, Latin America, Europe, Asia Pacific, and the Middle East & Africa. Further, country-wise data for the Delta-3-Carene industry is provided for the leading economies of the world.
The Delta-3-Carene market is segmented based on Type, Application, and End-Use Industry. On the basis of type segmentation, the market is classified into purity ≥90%, purity ≥95%, and purity <90%.In terms of Application segmentation, the market is bifurcated into flavor materials, solvents, and others. In terms of End-Use Industry segmentation, the market is bifurcated into personal care, cosmetic & perfumes, food & beverages, and pharmaceuticals
Report Scope
Report Attribute |
Details |
Market Size in 2019 |
USD 48 Million |
Projected Market Size in 2026 |
USD 64 Million |
CAGR Growth Rate |
4% CAGR |
Base Year |
2019 |
Forecast Years |
2020-2026 |
Key Market Players |
International Flavors & Fragrances, Givaudan, Robertet, Firmenich, Symrise, Estee Lauder, L’Oreal International, Procter & Gamble, Abbott Laboratories, Tecan Group, Pfizer, H. Reynaud & Fils, The Lebermuth Company, Avon Products, Inc., and Revlon, Inc. |
Key Segment |
By type, By Application, By End-Use, By Region |
Major Regions Covered |
North America, Europe, Asia Pacific, Latin America, and the Middle East & Africa |
Purchase Options |
Request customized purchase options to meet your research needs. Explore purchase options |
Some of the essential players operating in the Delta-3-Carene market, but not restricted to include:
- International Flavors & Fragrances
- Givaudan
- Robertet
- Firmenich
- Symrise
- Estee Lauder
- L’Oreal International
- Procter & Gamble
- Abbott Laboratories
- Tecan Group
- Pfizer
- H. Reynaud &Fils
- The Lebermuth Company
- Avon Products Inc.
- Revlon Inc.
The taxonomy of the Delta-3-Carene industry by its scope and segmentation is as follows:
By Type Segmentation Analysis(Customizable)
- Purity ≥90%
- Purity ≥95%
- Purity <90%
By Application Segmentation Analysis(Customizable)
- Flavor Material
- Solvents
- Others
By End-Use Industry Segmentation Analysis (Customizable)
- Personal Care
- Cosmetic & Perfumes
- Food & Beverages
- Pharmaceuticals
Regional Segmentation Analysis(Customizable)
- North America
- The U.S.
- Canada
- Europe
- Germany
- The UK
- France
- Spain
- Italy
- Rest of Europe
- Asia Pacific
- China
- Japan
- India
- South Korea
- Southeast Asia
- Rest of Asia Pacific
- Latin America
- Brazil
- Mexico
- Rest of Latin America
- Middle East & Africa
- GCC
- South Africa
- Rest of the Middle East & Africa
Table of Content
Industry Major Market Players
- International Flavors & Fragrances
- Givaudan
- Robertet
- Firmenich
- Symrise
- Estee Lauder
- L’Oreal International
- Procter & Gamble
- Abbott Laboratories
- Tecan Group
- Pfizer
- H. Reynaud &Fils
- The Lebermuth Company
- Avon Products Inc.
- Revlon Inc.


Copyright © 2025 - 2026, All Rights Reserved, Facts and Factors