Search Market Research Report

Discover Our Latest Reports
Discover Our Featured Reports
Discover Top Selling Reports

Crop Input Controller Market Size, Share Global Analysis Report, 2020–2026

report img

Crop Input Controller Market By Product Type (Onboard and Portable) and By End-user (Farm, Greenhouse, and Others): Global Industry Outlook, Market Size, Business Intelligence, Consumer Preferences, Statistical Surveys, Comprehensive Analysis, Historical Developments, Current Trends, and Forecast 2020–2026

Industry Insights

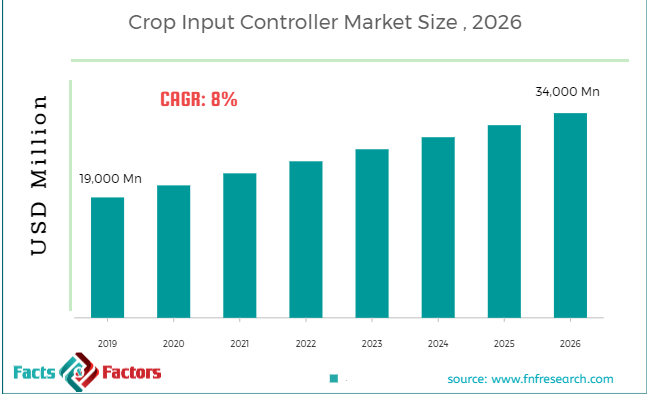
[162+ Pages Report] According to the report published by Facts Factors, the global crop input controller market size was worth around USD 19,000 million in 2019 and is predicted to grow to around USD 34,000 million by 2026 with a compound annual growth rate (CAGR) of roughly 8% between 2020 and 2026. The report analyzes the global crop input controller market drivers, restraints/challenges, and the effect they have on the demands during the projection period. In addition, the report explores emerging opportunities in the crop input controller market.

Crop Input Controller Market Size

To know more about this report | Request Free Sample Copy

This specialized and expertise-oriented industry research report scrutinizes the technical and commercial business outlook of the Crop Input Controller industry. The report analyzes and declares the historical and current trends analysis of the Crop Input Controller industry and subsequently recommends the projected trends anticipated to be observed in the Crop Input Controller market during the upcoming years.

The crop input controller market report analyzes and notifies the industry statistics at the global as well as regional and country levels in order to acquire a thorough perspective of the entire Crop Input Controller market. The historical and past insights are provided for FY 2016 to FY 2019 whereas projected trends are delivered for FY 2020 to FY 2026. The quantitative and numerical data is represented in terms of value (USD Million) from FY 2016 – 2026.


logoKey Insights from Primary Research

  • Equally foremost respondents, the market for crop input controller is set to grow annually at a rate of around 8%.
  • In terms of Value, the global crop input controller Market at 15.00 Million in 2016 and is expected to reach 34.00 Million by 2026.
  • Based on product type segmentation, the “Onboard” category accounting for around 64%, share in 2019.
  • Based on end-user segmentation, the “Farm” category accounting for around 58%, share in 2019
  • The quantitative analysis involved the Type of various projection and sampling techniques

logoKey Recommendations from Analysts

  • As per our analysis, the North America market is estimated to grow at a 38% share with CAGR 8% during 2019-2026.
  • This growth is attributed to emerging robust technologies and the growing adaptation of technologies in this region.
  • Asia Pacific crop input controller market accounted for a 22% revenue share in 2016. China and Japan are the leading countries in the Asia Pacific crop input controller market.
  • China highest growing country in the Asia Pacific with CAGR 9% in 2026.
  • The Raw Material costs contain that is attached to materials that are purchased by its raw materials, business, manufacturing supplies parts, and components.

The quantitative data is further underlined and reinforced by comprehensive qualitative data which comprises various across-the-board market dynamics. The rationales which directly or indirectly impact the Crop Input Controller industry are exemplified through parameters such as growth drivers, restraints, challenges, and opportunities among other impacting factors.

Throughout our research report, we have encompassed all the proven models and tools of industry analysis and extensively illustrated all the key business strategies and business models adopted in the Crop Input Controller industry. The report provides an all-inclusive and detailed competitive landscape prevalent in the Crop Input Controller market.

The report utilizes established industry analysis tools and models such as Porter’s Five Forces framework to analyze and recognize critical business strategies adopted by various stakeholders involved in the entire value chain of the Crop Input Controller industry. The Crop Input Controller market report additionally employs SWOT analysis and PESTLE analysis models for further in-depth analysis.

The report study further includes an in-depth analysis of industry players' market shares and provides an overview of leading players' market position in the Crop Input Controller sector. Key strategic developments in the Crop Input Controller market competitive landscape such as acquisitions & mergers, inaugurations of different products and services, partnerships & joint ventures, MoU agreements, VC & funding activities, R&D activities, and geographic expansion among other noteworthy activities by key players of the Crop Input Controller market are appropriately highlighted in the report.

The crop input controller is a system of accuracy agriculture. It is thoughtful of farming organization which is built on responding, observing, and measuring. Crop Input Controller prevents fertilizer and seed overlay, controls the frequency of monitors seed delivery and material application.

Crop Input Controller products are significant in developed economies such as North America and Europe. Rapid urbanization, evolution in consumer buying behavior, and growing use of smartphones and digital media are expected to drive the growth of the online distribution of Crop Input Controller.

The Crop Input Controller market research report delivers an acute valuation and taxonomy of the Crop Input Controller industry by practically splitting the market on the basis of different types, applications, and regions. Through the analysis of the historical and projected trends, all the segments and sub-segments were evaluated through the bottom-up approach, and different market sizes have been projected for FY 2020 to FY 2026.

logoReport Scope

Report Attribute

Details

Market Size in 2019

USD 19,000 Million

Projected Market Size in 2026

USD 34,000 Million

CAGR Growth Rate

8% CAGR

Base Year

2019

Forecast Years

2020-2026

Key Market Players

John Deere, KvernelandGroup Deutschland GmbH, Loup Electronics Inc., Muller-Elektronik GmbH & Co. KG, New Holland, Precision Planting, Raven Industries, RDS Technology Ltd., Softivert, Surefire, TeeJet, Trimble, Vaderstad GmbH, Ag Leader, AGCO, Agrotronix S.A., AnedoARAGS.r.l., Dawn,Dickey-John Corporation, Digi-Star, Farmscan AG Pty. Ltd., Hexagon Agriculture, and Others

Key Segment

By Product, End-user, and Region

Major Regions Covered

North America, Europe, Asia Pacific, Latin America, and the Middle East & Africa

Purchase Options

Request customized purchase options to meet your research needs.Explore purchase options

The regional segmentation of the Crop Input Controller industry includes the complete classification of all the major continents including North America, Latin America, Europe, Asia Pacific, and Middle East & Africa. Further, country-wise data for the Crop Input Controller industry is provided for the leading economies of the world.

The Crop Input Controller market is segmented based on product type and end-user. On the basis of product type segmentation, the market is classified into onboard and portable. In terms of end-user segmentation, the market is bifurcated into farm, greenhouse, and others.

logoSome of the essential players operating in the crop input controller market, but not restricted to include

  •  John Deere
  •  Kverneland Group Deutschland GmbH
  •  Loup Electronics Inc.
  •  Muller-Elektronik GmbH & Co. KG
  •  New Holland
  •  Precision Planting
  •  Raven Industries
  •  RDS Technology Ltd.
  •  Softivert
  •  Surefire
  •  TeeJet
  •  Trimble
  •  Vaderstad GmbH
  •  Ag Leader
  •  AGCO
  •  Agrotronix S.A.
  •  AnedoARAG S.r.l.
  •  Dawn
  •  Dickey-john Corporation
  •  Digi-Star
  •  Farms can AG Pty. Ltd.
  •  Hexagon Agriculture.

The taxonomy of the Crop Input Controller industry by its scope and segmentation is as follows:

logoBy Product Type Segmentation Analysis

  • Onboard
  • Portable

logoBy End-user Segmentation Analysis

  • Farm
  • Greenhouse
  • Others

logoBy Regional Segmentation Analysis

  • North America
    • The U.S.
    • Canada
  • Europe
    • Germany
    • The UK
    • France
    • Spain
    • Italy
    • Rest of Europe
  • Asia Pacific
    • China
    • Japan
    • India
    • South Korea
    • Southeast Asia
    • Rest of Asia Pacific
  • Latin America
    • Brazil
    • Mexico
    • Rest of Latin America
  • Middle East & Africa
    • GCC
    • South Africa
    • Rest of Middle East & Africa

Table of Content

  1. CHAPTER 1. Executive Summary
  2. CHAPTER 2. Crop Input Controller market – Product Type Analysis
    1. 2.1. Global Crop Input Controller Market – Product Type Overview
    2. 2.2. Global Crop Input Controller Market Share, by Product Type , 2018 & 2025 (USD Million)
    3. 2.3. Onboard
      1. 2.3.1. Global Onboard Crop Input Controller Market, 2016-2026 (USD Million)
    4. 2.4. Portable
      1. 2.4.1. Global Portable Crop Input Controller Market, 2016-2026 (USD Million)
  3. CHAPTER 3. Crop Input Controller market – End-user Analysis
    1. 3.1. Global Crop Input Controller Market – End-user Overview
    2. 3.2. Global Crop Input Controller Market Share, by End-user , 2018 & 2025 (USD Million)
    3. 3.3. Farm
      1. 3.3.1. Global Farm Crop Input Controller Market, 2016-2026 (USD Million)
    4. 3.4. Greenhouse
      1. 3.4.1. Global Greenhouse Crop Input Controller Market, 2016-2026 (USD Million)
    5. 3.5. Others
      1. 3.5.1. Global Others Crop Input Controller Market, 2016-2026 (USD Million)
  4. CHAPTER 4. Crop Input Controller market – Regional Analysis
    1. 4.1. Global Crop Input Controller Market Regional Overview
    2. 4.2. Global Crop Input Controller Market Share, by Region, 2018 & 2025 (Value)
    3. 4.3. North America
      1. 4.3.1. North America Crop Input Controller Market size and forecast, 2016-2026
      2. 4.3.2. North America Crop Input Controller Market, by Country, 2018 & 2025 (USD Million)
      3. 4.3.3. North America Crop Input Controller Market, by Product Type , 2016-2026
        1. 4.3.3.1. North America Crop Input Controller Market, by Product Type , 2016-2026 (USD Million)
      4. 4.3.4. North America Crop Input Controller Market, by End-user , 2016-2026
        1. 4.3.4.1. North America Crop Input Controller Market, by End-user , 2016-2026 (USD Million)
      5. 4.3.5. U.S.
        1. 4.3.5.1. U.S. Market size and forecast, 2016-2026 (USD Million)
      6. 4.3.6. Canada
        1. 4.3.6.1. Canada Market size and forecast, 2016-2026 (USD Million)
    4. 4.4. Europe
      1. 4.4.1. Europe Crop Input Controller Market size and forecast, 2016-2026
      2. 4.4.2. Europe Crop Input Controller Market, by Country, 2018 & 2025 (USD Million)
      3. 4.4.3. Europe Crop Input Controller Market, by Product Type , 2016-2026
        1. 4.4.3.1. Europe Crop Input Controller Market, by Product Type , 2016-2026 (USD Million)
      4. 4.4.4. Europe Crop Input Controller Market, by End-user , 2016-2026
        1. 4.4.4.1. Europe Crop Input Controller Market, by End-user , 2016-2026 (USD Million)
      5. 4.4.5. Germany
        1. 4.4.5.1. Germany Market size and forecast, 2016-2026 (USD Million)
      6. 4.4.6. France
        1. 4.4.6.1. France Market size and forecast, 2016-2026 (USD Million)
      7. 4.4.7. U.K.
        1. 4.4.7.1. U.K. Market size and forecast, 2016-2026 (USD Million)
      8. 4.4.8. Italy
        1. 4.4.8.1. Italy Market size and forecast, 2016-2026 (USD Million)
      9. 4.4.9. Spain
        1. 4.4.9.1. Spain Market size and forecast, 2016-2026 (USD Million)
      10. 4.4.10. Rest of Europe
        1. 4.4.10.1. Rest of Europe Market size and forecast, 2016-2026 (USD Million)
    5. 4.5. Asia Pacific
      1. 4.5.1. Asia Pacific Crop Input Controller Market size and forecast, 2016-2026
      2. 4.5.2. Asia Pacific Crop Input Controller Market, by Country, 2018 & 2025 (USD Million)
      3. 4.5.3. Asia Pacific Crop Input Controller Market, by Product Type , 2016-2026
        1. 4.5.3.1. Asia Pacific Crop Input Controller Market, by Product Type , 2016-2026 (USD Million)
      4. 4.5.4. Asia Pacific Crop Input Controller Market, by End-user , 2016-2026
        1. 4.5.4.1. Asia Pacific Crop Input Controller Market, by End-user , 2016-2026 (USD Million)
      5. 4.5.5. China
        1. 4.5.5.1. China Market size and forecast, 2016-2026 (USD Million)
      6. 4.5.6. Japan
        1. 4.5.6.1. Japan Market size and forecast, 2016-2026 (USD Million)
      7. 4.5.7. India
        1. 4.5.7.1. India Market size and forecast, 2016-2026 (USD Million)
      8. 4.5.8. South Korea
        1. 4.5.8.1. South Korea Market size and forecast, 2016-2026 (USD Million)
      9. 4.5.9. South-East Asia
        1. 4.5.9.1. South-East Asia Market size and forecast, 2016-2026 (USD Million)
      10. 4.5.10. Rest of Asia Pacific
        1. 4.5.10.1. Rest of Asia Pacific Market size and forecast, 2016-2026 (USD Million)
    6. 4.6. Latin America
      1. 4.6.1. Latin America Crop Input Controller Market size and forecast, 2016-2026
      2. 4.6.2. Latin America Crop Input Controller Market, by Country, 2018 & 2025 (USD Million)
      3. 4.6.3. Latin America Crop Input Controller Market, by Product Type , 2016-2026
        1. 4.6.3.1. Latin America Crop Input Controller Market, by Product Type , 2016-2026 (USD Million)
      4. 4.6.4. Latin America Crop Input Controller Market, by End-user , 2016-2026
        1. 4.6.4.1. Latin America Crop Input Controller Market, by End-user , 2016-2026 (USD Million)
      5. 4.6.5. Brazil
        1. 4.6.5.1. Brazil Market size and forecast, 2016-2026 (USD Million)
      6. 4.6.6. Mexico
        1. 4.6.6.1. Mexico Market size and forecast, 2016-2026 (USD Million)
      7. 4.6.7. Rest of Latin America
        1. 4.6.7.1. Rest of Latin America Market size and forecast, 2016-2026 (USD Million)
    7. 4.7. The Middle-East and Africa
      1. 4.7.1. The Middle-East and Africa Crop Input Controller Market size and forecast, 2016-2026
      2. 4.7.2. The Middle-East and Africa Crop Input Controller Market, by Country, 2018 & 2025 (USD Million)
      3. 4.7.3. The Middle-East and Africa Crop Input Controller Market, by Product Type , 2016-2026
        1. 4.7.3.1. The Middle-East and Africa Crop Input Controller Market, by Product Type , 2016-2026 (USD Million)
      4. 4.7.4. The Middle-East and Africa Crop Input Controller Market, by End-user , 2016-2026
        1. 4.7.4.1. The Middle-East and Africa Crop Input Controller Market, by End-user , 2016-2026 (USD Million)
      5. 4.7.5. GCC Countries
        1. 4.7.5.1. GCC Countries Market size and forecast, 2016-2026 (USD Million)
      6. 4.7.6. South Africa
        1. 4.7.6.1. South Africa Market size and forecast, 2016-2026 (USD Million)
      7. 4.7.7. Rest of Middle-East Africa
        1. 4.7.7.1. Rest of Middle-East Africa Market size and forecast, 2016-2026 (USD Million)
  5. CHAPTER 5. Crop Input Controller market – Competitive Landscape
    1. 5.1. Competitor Market Share – Revenue
    2. 5.2. Market Concentration Rate Analysis, Top 3 and Top 5 Players
    3. 5.3. Strategic Development
      1. 5.3.1. Acquisitions and Mergers
      2. 5.3.2. New Products
      3. 5.3.3. Research & Development Activities
  6. CHAPTER 6. Company Profiles
    1. 6.1. John Deere
      1. 6.1.1. Company Overview
      2. 6.1.2. John Deere Revenue and Gross Margin
      3. 6.1.3. Product portfolio
      4. 6.1.4. Recent initiatives
    2. 6.2. Kverneland Group Deutschland GmbH
      1. 6.2.1. Company Overview
      2. 6.2.2. Kverneland Group Deutschland GmbH Revenue and Gross Margin
      3. 6.2.3. Product portfolio
      4. 6.2.4. Recent initiatives
    3. 6.3. Loup Electronics Inc.
      1. 6.3.1. Company Overview
      2. 6.3.2. Loup Electronics Inc. Revenue and Gross Margin
      3. 6.3.3. Product portfolio
      4. 6.3.4. Recent initiatives
    4. 6.4. Muller-Elektronik GmbH & Co. KG
      1. 6.4.1. Company Overview
      2. 6.4.2. Muller-Elektronik GmbH & Co. KG Revenue and Gross Margin
      3. 6.4.3. Product portfolio
      4. 6.4.4. Recent initiatives
    5. 6.5. New Holland
      1. 6.5.1. Company Overview
      2. 6.5.2. New Holland Revenue and Gross Margin
      3. 6.5.3. Product portfolio
      4. 6.5.4. Recent initiatives
    6. 6.6. Precision Planting
      1. 6.6.1. Company Overview
      2. 6.6.2. Precision Planting Revenue and Gross Margin
      3. 6.6.3. Product portfolio
      4. 6.6.4. Recent initiatives
    7. 6.7. Raven Industries
      1. 6.7.1. Company Overview
      2. 6.7.2. Raven Industries Revenue and Gross Margin
      3. 6.7.3. Product portfolio
      4. 6.7.4. Recent initiatives
    8. 6.8. RDS Technology Ltd.
      1. 6.8.1. Company Overview
      2. 6.8.2. RDS Technology Ltd. Revenue and Gross Margin
      3. 6.8.3. Product portfolio
      4. 6.8.4. Recent initiatives
    9. 6.9. Softivert, Surefire
      1. 6.9.1. Company Overview
      2. 6.9.2. Softivert, Surefire Revenue and Gross Margin
      3. 6.9.3. Product portfolio
      4. 6.9.4. Recent initiatives
    10. 6.10. TeeJet
      1. 6.10.1. Company Overview
      2. 6.10.2. TeeJet Revenue and Gross Margin
      3. 6.10.3. Product portfolio
      4. 6.10.4. Recent initiatives
    11. 6.11. Trimble
      1. 6.11.1. Company Overview
      2. 6.11.2. Trimble Revenue and Gross Margin
      3. 6.11.3. Product portfolio
      4. 6.11.4. Recent initiatives
    12. 6.12. Vaderstad GmbH
      1. 6.12.1. Company Overview
      2. 6.12.2. Vaderstad GmbH Revenue and Gross Margin
      3. 6.12.3. Product portfolio
      4. 6.12.4. Recent initiatives
    13. 6.13. Ag Leader
      1. 6.13.1. Company Overview
      2. 6.13.2. Ag Leader Revenue and Gross Margin
      3. 6.13.3. Product portfolio
      4. 6.13.4. Recent initiatives
    14. 6.14. AGCO
      1. 6.14.1. Company Overview
      2. 6.14.2. AGCO Revenue and Gross Margin
      3. 6.14.3. Product portfolio
      4. 6.14.4. Recent initiatives
    15. 6.15. Agrotronix S.A.
      1. 6.15.1. Company Overview
      2. 6.15.2. Agrotronix S.A. Revenue and Gross Margin
      3. 6.15.3. Product portfolio
      4. 6.15.4. Recent initiatives
    16. 6.16. AnedoARAG S.r.l.
      1. 6.16.1. Company Overview
      2. 6.16.2. AnedoARAG S.r.l. Revenue and Gross Margin
      3. 6.16.3. Product portfolio
      4. 6.16.4. Recent initiatives
    17. 6.17. Dawn
      1. 6.17.1. Company Overview
      2. 6.17.2. Dawn Revenue and Gross Margin
      3. 6.17.3. Product portfolio
      4. 6.17.4. Recent initiatives
    18. 6.18. Dickey-John Corporation
      1. 6.18.1. Company Overview
      2. 6.18.2. Dickey-John Corporation Revenue and Gross Margin
      3. 6.18.3. Product portfolio
      4. 6.18.4. Recent initiatives
    19. 6.19. Digi-Star
      1. 6.19.1. Company Overview
      2. 6.19.2. Digi-Star Revenue and Gross Margin
      3. 6.19.3. Product portfolio
      4. 6.19.4. Recent initiatives
    20. 6.20. Farmscan AG Pty. Ltd.
      1. 6.20.1. Company Overview
      2. 6.20.2. Farmscan AG Pty. Ltd. Revenue and Gross Margin
      3. 6.20.3. Product portfolio
      4. 6.20.4. Recent initiatives
    21. 6.21. Hexagon Agriculture
      1. 6.21.1. Company Overview
      2. 6.21.2. Hexagon Agriculture Revenue and Gross Margin
      3. 6.21.3. Product portfolio
      4. 6.21.4. Recent initiatives
  7. CHAPTER 7. Crop Input Controller — Industry Analysis
    1. 7.1. Crop Input Controller Market – Key Trends
      1. 7.1.1. Market Drivers
      2. 7.1.2. Market Restraints
      3. 7.1.3. Market Opportunities
    2. 7.2. Value Chain Analysis
    3. 7.3. Technology Roadmap and Timeline
    4. 7.4. Crop Input Controller Market – Attractiveness Analysis
      1. 7.4.1. By Product Type
      2. 7.4.2. By End-user
      3. 7.4.3. By Region
  8. CHAPTER 8. Marketing Strategy Analysis, Distributors
    1. 8.1. Marketing Channel
    2. 8.2. Direct Marketing
    3. 8.3. Indirect Marketing
    4. 8.4. Marketing Channel Development Trend
    5. 8.5. Economic/Political Environmental Change
  9. CHAPTER 9. Report Conclusion
  10. CHAPTER 10. Research Approach & Methodology
    1. 10.1. Report Description
    2. 10.2. Research Scope
    3. 10.3. Research Methodology
      1. 10.3.1. Secondary Research
      2. 10.3.2. Primary Research
      3. 10.3.3. Models
        1. 10.3.3.1. Company Share Analysis Model
        2. 10.3.3.2. Revenue Based Modeling
        3. 10.3.3.3. Research Limitations

        List of Figures

        FIG. 1 Global Crop Input Controller  Market, 2016-2026 (USD Million)
        FIG. 2 Global Crop Input Controller  Market Share, by Product Type , 2018 & 2025 (USD Million)
        FIG. 3 Global Onboard Crop Input Controller  Market, 2016-2026 (USD Million)
        FIG. 4 Global Portable Crop Input Controller  Market, 2016-2026 (USD Million)
        FIG. 5 Global Crop Input Controller  Market Share, by End-user , 2018 & 2025 (USD Million)
        FIG. 6 Global Farm Crop Input Controller  Market, 2016-2026 (USD Million)
        FIG. 7 Global Greenhouse Crop Input Controller  Market, 2016-2026 (USD Million)
        FIG. 8 Global Others Crop Input Controller  Market, 2016-2026 (USD Million)
        FIG. 9 Global Crop Input Controller  Market Share, by Region, 2018 & 2025
        FIG. 10 North America Crop Input Controller  Market, 2016-2026
        FIG. 11 U.S. Crop Input Controller  Market, 2016-2026
        FIG. 12 Canada Crop Input Controller  Market, 2016-2026
        FIG. 13 Europe Crop Input Controller  Market, 2016-2026
        FIG. 14 Germany Crop Input Controller  Market, 2016-2026
        FIG. 15 France Crop Input Controller  Market, 2016-2026
        FIG. 16 U.K. Crop Input Controller  Market, 2016-2026
        FIG. 17 Italy Crop Input Controller  Market, 2016-2026
        FIG. 18 Spain Crop Input Controller  Market, 2016-2026
        FIG. 19 Rest of Europe Crop Input Controller  Market, 2016-2026
        FIG. 20 Asia Pacific Crop Input Controller  Market, 2016-2026
        FIG. 21 China Crop Input Controller  Market, 2016-2026
        FIG. 22 Japan Crop Input Controller  Market, 2016-2026
        FIG. 23 India Crop Input Controller  Market, 2016-2026
        FIG. 24 South  Korea Crop Input Controller  Market, 2016-2026
        FIG. 25 South-East Asia Crop Input Controller  Market, 2016-2026
        FIG. 26 Rest of Asia Pacific Crop Input Controller  Market, 2016-2026
        FIG. 27 Latin America Crop Input Controller  Market, 2016-2026
        FIG. 28 Brazil Crop Input Controller  Market, 2016-2026
        FIG. 29 Mexico Crop Input Controller  Market, 2016-2026
        FIG. 30 Rest of Latin America Crop Input Controller  Market, 2016-2026
        FIG. 31 The Middle-East and Africa Crop Input Controller  Market, 2016-2026
        FIG. 32 GCC Countries Crop Input Controller  Market, 2016-2026
        FIG. 33 South Africa Crop Input Controller  Market, 2016-2026
        FIG. 34 Rest of Middle-East Africa Crop Input Controller  Market, 2016-2026
        FIG. 35 Competitor Market Share – Revenue
        FIG. 36 John Deere Revenue and Growth Rate
        FIG. 37 John Deere Market Share
        FIG. 38 Kverneland Group Deutschland GmbH Revenue and Growth Rate
        FIG. 39 Kverneland Group Deutschland GmbH Market Share
        FIG. 40 Loup Electronics Inc. Revenue and Growth Rate
        FIG. 41 Loup Electronics Inc. Market Share
        FIG. 42 Muller-Elektronik GmbH & Co. KG Revenue and Growth Rate
        FIG. 43 Muller-Elektronik GmbH & Co. KG Market Share
        FIG. 44 New Holland Revenue and Growth Rate
        FIG. 45 New Holland Market Share
        FIG. 46 Precision Planting Revenue and Growth Rate
        FIG. 47 Precision Planting Market Share
        FIG. 48 Raven Industries Revenue and Growth Rate
        FIG. 49 Raven Industries Market Share
        FIG. 50 RDS Technology Ltd. Revenue and Growth Rate
        FIG. 51 RDS Technology Ltd. Market Share
        FIG. 52 Softivert, Surefire Revenue and Growth Rate
        FIG. 53 Softivert, Surefire Market Share
        FIG. 54 TeeJet Revenue and Growth Rate
        FIG. 55 TeeJet Market Share
        FIG. 56 Trimble Revenue and Growth Rate
        FIG. 57 Trimble Market Share
        FIG. 58 Vaderstad GmbH Revenue and Growth Rate
        FIG. 59 Vaderstad GmbH Market Share
        FIG. 60 Ag Leader Revenue and Growth Rate
        FIG. 61 Ag Leader Market Share
        FIG. 62 AGCO Revenue and Growth Rate
        FIG. 63 AGCO Market Share
        FIG. 64 Agrotronix S.A. Revenue and Growth Rate
        FIG. 65 Agrotronix S.A. Market Share
        FIG. 66 AnedoARAG S.r.l. Revenue and Growth Rate
        FIG. 67 AnedoARAG S.r.l. Market Share
        FIG. 68 Dawn Revenue and Growth Rate
        FIG. 69 Dawn Market Share
        FIG. 70 Dickey-John Corporation Revenue and Growth Rate
        FIG. 71 Dickey-John Corporation Market Share
        FIG. 72 Digi-Star Revenue and Growth Rate
        FIG. 73 Digi-Star Market Share
        FIG. 74 Farmscan AG Pty. Ltd. Revenue and Growth Rate
        FIG. 75 Farmscan AG Pty. Ltd. Market Share
        FIG. 76 Hexagon Agriculture Revenue and Growth Rate
        FIG. 77 Hexagon Agriculture Market Share
        FIG. 78 Market Dynamics
        FIG. 79 Global Crop Input Controller  – Value Chain Analysis
        FIG. 80 Technology Roadmap and Timeline
        FIG. 81 Market Attractiveness Analysis – By Product Type
        FIG. 82 Market Attractiveness Analysis – By End-user
        FIG. 83 Market Attractiveness Analysis – By Region
        FIG. 84 Market Channel
        FIG. 85 Marketing Channel Development Trend
        FIG. 86 Growth in World Gross Product, 2008-2018

        List of Tables

        TABLE 1 Global Crop Input Controller  Market, 2018 & 2025 (USD Million)
        TABLE 2 Global Crop Input Controller  market, by Product Type , 2016-2026 (USD Million)
        TABLE 3 Global Crop Input Controller  market, by End-user , 2016-2026 (USD Million)
        TABLE 4 Global Crop Input Controller  market, by Region, 2016-2026 (USD Million)
        TABLE 5 North America Crop Input Controller  Market, by Product Type , 2016-2026 (USD Million)
        TABLE 6 North America Crop Input Controller  Market, by End-user , 2016-2026 (USD Million)
        TABLE 7 Europe Crop Input Controller  Market, by Product Type , 2016-2026 (USD Million)
        TABLE 8 Europe Crop Input Controller  Market, by End-user , 2016-2026 (USD Million)
        TABLE 9 Asia Pacific Crop Input Controller  Market, by Product Type , 2016-2026 (USD Million)
        TABLE 10 Asia Pacific Crop Input Controller  Market, by End-user , 2016-2026 (USD Million)
        TABLE 11 Latin America Crop Input Controller  Market, by Product Type , 2016-2026 (USD Million)
        TABLE 12 Latin America Crop Input Controller  Market, by End-user , 2016-2026 (USD Million)
        TABLE 13 The Middle-East and Africa Crop Input Controller  Market, by Product Type , 2016-2026 (USD Million)
        TABLE 14 The Middle-East and Africa Crop Input Controller  Market, by End-user , 2016-2026 (USD Million)
        TABLE 15 Global Crop Input Controller  Market - Company Revenue Analysis 2016-2019 (USD Million)
        TABLE 16 Global Crop Input Controller  Market - Company Revenue Share Analysis 2016-2019(%)
        TABLE 17 Acquisitions and Mergers
        TABLE 18 New Product/Service Launch
        TABLE 19 Research & Development Activities
        TABLE 20 Market Drivers
        TABLE 21 Market Restraints
        TABLE 22 Market Opportunities
        

Industry Major Market Players

  •  John Deere
  •  Kverneland Group Deutschland GmbH
  •  Loup Electronics Inc.
  •  Muller-Elektronik GmbH & Co. KG
  •  New Holland
  •  Precision Planting
  •  Raven Industries
  •  RDS Technology Ltd.
  •  Softivert
  •  Surefire
  •  TeeJet
  •  Trimble
  •  Vaderstad GmbH
  •  Ag Leader
  •  AGCO
  •  Agrotronix S.A.
  •  AnedoARAG S.r.l.
  •  Dawn
  •  Dickey-john Corporation
  •  Digi-Star
  •  Farms can AG Pty. Ltd.
  •  Hexagon Agriculture.