Search Market Research Report

Discover Our Latest Reports
Discover Our Featured Reports
Discover Top Selling Reports

Craft Beer Market Size, Share Global Analysis Report, 2020–2026

report img

Craft Beer Market By Type (Ales, Specialty Beers, Pilsners & Pale Lagers, and Others) and By Distribution (Off-Trade and On-Trade): Global Industry Outlook, Market Size, Business Intelligence, Consumer Preferences, Statistical Surveys, Comprehensive Analysis, Historical Developments, Current Trends, and Forecast 2020–2026

Industry Insights

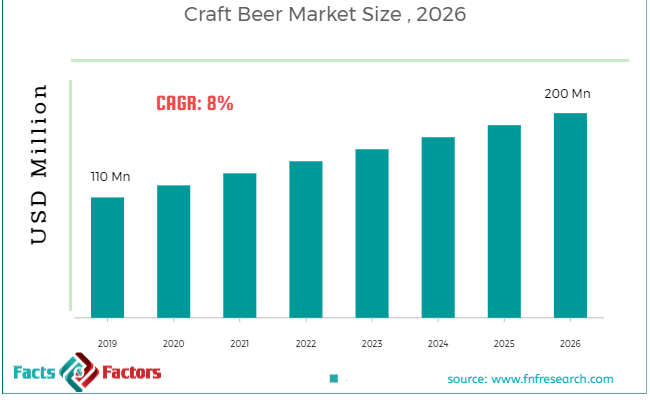
[174+ Pages Report] According to the report published by Facts Factors, the global craft beer market size was worth around USD 110 million in 2019 and is predicted to grow to around USD 200 million by 2026 with a compound annual growth rate (CAGR) of roughly 8% between 2020 and 2026. The report analyzes the global craft beer market drivers, restraints/challenges, and the effect they have on the demands during the projection period. In addition, the report explores emerging opportunities in the craft beer# market.

Craft Beer Market

To know more about this report | Request Free Sample Copy

This specialized and expertise oriented industry research report scrutinizes the technical and commercial business outlook of the Craft Beer industry. The report analyzes and declares the historical and current trends analysis of the Craft Beer industry and subsequently recommends the projected trends anticipated to be observed in the Craft Beer market during the upcoming years.

The craft beer market report analyzes and notifies the industry statistics at the global as well as regional and country levels in order to acquire a thorough perspective of the entire Craft Beer market. The historical and past insights are provided for FY 2016 to FY 2019 whereas projected trends are delivered for FY 2020 to FY 2026. The quantitative and numerical data is represented in terms of both volume (Kilo Tons) and value (USD Million) from FY 2016 – 2026.

The quantitative data is further underlined and reinforced by comprehensive qualitative data which comprises various across-the-board market dynamics. The rationales which directly or indirectly impact the Craft Beer industry are exemplified through parameters such as growth drivers, restraints, challenges, and opportunities among other impacting factors.


logoKey Insights from Primary Research

  • According to the interview with industry participants, rise in consumer preference for low alcohol has driven the target market growth
  • Growth in demand for more beer styles among individuals has enhanced the target market growth
  • Target market generated revenue of around USD 110 Million in 2018
  • Europe was the major revenue generator associated with the target market in 2018
  • Ales and On-Trade distribution categories of type and distribution segments were the leading ones in 2018

logoKey Recommendations from Analysts

  • As per our analyst, increase in development of pubs and clubs across the world has helped target market boosting the growth
  • Target market is expected to generate revenue of around USD 200 Million in 2026
  • Target market is estimated to grow at CAGR of around 8%
  • Europe is projected to generate maximum revenue in 2026 owing to the high demand of craft beer in UK and Germany
  • Ales and On-Trade distribution categories of type and distribution segments are expected to be the leading ones in 2026 as well

logo
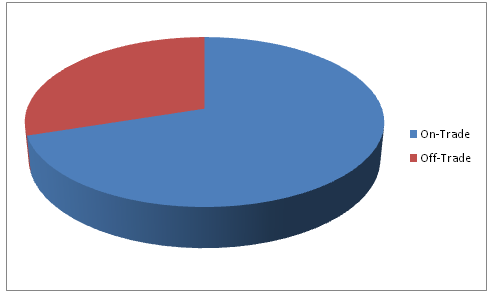
Revenue Share, by Distribution

Craft Beer Market

To know more about this report | Request Free Sample Copy


Throughout our research report, we have encompassed all the proven models and tools of industry analysis and extensively illustrated all the key business strategies and business models adopted in the Craft Beer industry. The report provides an all-inclusive and detailed competitive landscape prevalent in the Craft Beer market.

The report utilizes established industry analysis tools and models such as Porter’s Five Forces framework to analyze and recognize critical business strategies adopted by various stakeholders involved in the entire value chain of the Craft Beer industry. The Craft Beer market report additionally employs SWOT analysis and PESTLE analysis models for further in-depth analysis.

The report study further includes an in-depth analysis of industry players' market shares and provides an overview of leading players' market position in the Craft Beer sector. Key strategic developments in the Craft Beer market competitive landscape such as acquisitions & mergers, inaugurations of different products and services, partnerships & joint ventures, MoU agreements, VC & funding activities, R&D activities, and geographic expansion among other noteworthy activities by key players of the Craft Beer market are appropriately highlighted in the report.

Changing lifestyle is one of the propelling factors of target market growth. In addition, the rising preference of individuals for low alcohol has also boosted the target market growth. Moreover, craft beer offers exotic flavor, this has enhanced the target market growth as well. Furthermore, the surge in demand for more beer styles has also developed the target market growth.

The rise in per capita income of individuals has been boosting the target market growth as well. Also, an increase in the development of clubs and pubs in developed as well as developing nations have enhanced the target market growth as well. However, the cost of craft beer is high as compared to other beers. This is anticipated to hamper the target market growth over the forecast period. Nevertheless, individuals are inclining towards traditional beers more nowadays; this may create growth opportunities over the forecast period.

The Craft Beer market research report delivers an acute valuation and taxonomy of the Craft Beer industry by practically splitting the market on the basis of different types, applications, and regions. Through the analysis of the historical and projected trends, all the segments and sub-segments were evaluated through the bottom-up approach, and different market sizes have been projected for FY 2020 to FY 2026.

logoReport Scope

Report Attribute

Details

Market Size in 2019

USD 110 Million

Projected Market Size in 2026

USD 200 Million

CAGR Growth Rate

8% CAGR

Base Year

2019

Forecast Years

2020-2026

Key Market Players

Bell's Brewery Inc., The Boston Beer Company, Stone & Wood Brewing Co., The Gambrinus Company, Anheuser-Busch InBev, New Belgium Brewing Company, Sierra Nevada, Sam Adams, D.G. Yuengling and Son, and The Lagunitas Brewing Company

Key Segment

By Type, Distribution, and Region

Major Regions Covered

North America, Europe, Asia Pacific, Latin America, and the Middle East & Africa

Purchase Options

Request customized purchase options to meet your research needs.Explore purchase options

The regional segmentation of the Craft Beer industry includes the complete classification of all the major continents including North America, Latin America, Europe, Asia Pacific, and Middle East & Africa. Further, country-wise data for the Craft Beer industry is provided for the leading economies of the world.

The Craft Beer market is segmented based on Type and Distribution. On the basis of type segmentation, the market is classified into ales, specialty beers, pilsners, and pale lagers, and others. In terms of Distribution segmentation, the market is bifurcated off-trade and on-trade.

logoSome of the essential players operating in the Craft Beer market, but not restricted to include

  •  Bell's Brewery Inc.
  •  The Boston Beer Company
  •  Stone & Wood Brewing Co.
  •  The Gambrinus Company
  •  Anheuser-Busch InBev
  •  New Belgium Brewing Company
  •  Sierra Nevada
  •  Sam Adams
  •  D.G. Yuengling and Son
  •  The Lagunitas Brewing Company

The taxonomy of the Craft Beer industry by its scope and segmentation is as follows:

logoBy Type Segmentation Analysis

  • Ales
  • Specialty Beers
  • Pilsners & Pale Lagers
  • Others

logoBy Distribution Segmentation Analysis

  • Off-Trade
  • On-Trade

logoBy Regional Segmentation Analysis

  • North America
    • The U.S.
    • Canada
  • Europe
    • Germany
    • The UK
    • France
    • Spain
    • Italy
    • Rest of Europe
  • Asia Pacific
    • China
    • Japan
    • India
    • South Korea
    • Southeast Asia
    • Rest of Asia Pacific
  • Latin America
    • Brazil
    • Mexico
    • Rest of Latin America
  • Middle East & Africa
    • GCC
    • South Africa
    • Rest of Middle East & Africa

Table of Content

  1. CHAPTER 1. Executive Summary
  2. CHAPTER 2. Craft Beer market – Type Analysis
    1. 2.1. Global Craft Beer Market – Type Overview
    2. 2.2. Global Craft Beer Market Share, by Type, 2018 & 2025 (USD Million)
    3. 2.3. Global Craft Beer Market share, by Type, 2018 & 2025 (Kilo Tons)
    4. 2.4. Ales
      1. 2.4.1. Global Ales Craft Beer Market, 2016-2026 (USD Million)
      2. 2.4.2. Global Ales Craft Beer Market, 2016-2026 (Kilo Tons)
    5. 2.5. Specialty Beers
      1. 2.5.1. Global Specialty Beers Craft Beer Market, 2016-2026 (USD Million)
      2. 2.5.2. Global Specialty Beers Craft Beer Market, 2016-2026 (Kilo Tons)
    6. 2.6. Pilsners & Pale Lagers
      1. 2.6.1. Global Pilsners & Pale Lagers Craft Beer Market, 2016-2026 (USD Million)
      2. 2.6.2. Global Pilsners & Pale Lagers Craft Beer Market, 2016-2026 (Kilo Tons)
    7. 2.7. Others
      1. 2.7.1. Global Others Craft Beer Market, 2016-2026 (USD Million)
      2. 2.7.2. Global Others Craft Beer Market, 2016-2026 (Kilo Tons)
  3. CHAPTER 3. Craft Beer market – Distribution Analysis
    1. 3.1. Global Craft Beer Market – Distribution Overview
    2. 3.2. Global Craft Beer Market Share, by Distribution, 2018 & 2025 (USD Million)
    3. 3.3. Global Craft Beer Market share, by Distribution, 2018 & 2025 (Kilo Tons)
    4. 3.4. Off-Trade
      1. 3.4.1. Global Off-Trade Craft Beer Market, 2016-2026 (USD Million)
      2. 3.4.2. Global Off-Trade Craft Beer Market, 2016-2026 (Kilo Tons)
    5. 3.5. On-Trade
      1. 3.5.1. Global On-Trade Craft Beer Market, 2016-2026 (USD Million)
      2. 3.5.2. Global On-Trade Craft Beer Market, 2016-2026 (Kilo Tons)
  4. CHAPTER 4. Craft Beer market – Regional Analysis
    1. 4.1. Global Craft Beer Market Regional Overview
    2. 4.2. Global Craft Beer Market Share, by Region, 2018 & 2025 (Value)
    3. 4.3. Global Craft Beer Market Share, by Region, 2018 & 2025 (Volume)
    4. 4.4. North America
      1. 4.4.1. North America Craft Beer Market size and forecast, 2016-2026
      2. 4.4.2. North America Craft Beer Market, by Country, 2018 - 2025 (USD Million)
      3. 4.4.3. North America Market size and forecast, 2016-2026 (Kilo Tons)
      4. 4.4.4. North America Craft Beer Market, by Country, 2018 - 2025 (Kilo Tons)
      5. 4.4.5. North America Craft Beer Market, by Type, 2016-2026
        1. 4.4.5.1. North America Craft Beer Market, by Type, 2016-2026 (USD Million)
        2. 4.4.5.2. North America Craft Beer Market, by Type, 2016-2026 (Kilo Tons)
      6. 4.4.6. North America Craft Beer Market, by Distribution, 2016-2026
        1. 4.4.6.1. North America Craft Beer Market, by Distribution, 2016-2026 (USD Million)
        2. 4.4.6.2. North America Craft Beer Market, by Distribution, 2016-2026 (Kilo Tons)
      7. 4.4.7. U.S.
        1. 4.4.7.1. U.S. Market size and forecast, 2016-2026 (USD Million)
        2. 4.4.7.2. U.S. Market size and forecast, 2016-2026 (Kilo Tons)
      8. 4.4.8. Canada
        1. 4.4.8.1. Canada Market size and forecast, 2016-2026 (USD Million)
        2. 4.4.8.2. Canada Market size and forecast, 2016-2026 (Kilo Tons)
    5. 4.5. Europe
      1. 4.5.1. Europe Craft Beer Market size and forecast, 2016-2026
      2. 4.5.2. Europe Craft Beer Market, by Country, 2018 - 2025 (USD Million)
      3. 4.5.3. Europe Market size and forecast, 2016-2026 (Kilo Tons)
      4. 4.5.4. Europe Craft Beer Market, by Country, 2018 - 2025 (Kilo Tons)
      5. 4.5.5. Europe Craft Beer Market, by Type, 2016-2026
        1. 4.5.5.1. Europe Craft Beer Market, by Type, 2016-2026 (USD Million)
        2. 4.5.5.2. Europe Craft Beer Market, by Type, 2016-2026 (Kilo Tons)
      6. 4.5.6. Europe Craft Beer Market, by Distribution, 2016-2026
        1. 4.5.6.1. Europe Craft Beer Market, by Distribution, 2016-2026 (USD Million)
        2. 4.5.6.2. Europe Craft Beer Market, by Distribution, 2016-2026 (Kilo Tons)
      7. 4.5.7. Germany
        1. 4.5.7.1. Germany Market size and forecast, 2016-2026 (USD Million)
        2. 4.5.7.2. Germany Market size and forecast, 2016-2026 (Kilo Tons)
      8. 4.5.8. France
        1. 4.5.8.1. France Market size and forecast, 2016-2026 (USD Million)
        2. 4.5.8.2. France Market size and forecast, 2016-2026 (Kilo Tons)
      9. 4.5.9. U.K.
        1. 4.5.9.1. U.K. Market size and forecast, 2016-2026 (USD Million)
        2. 4.5.9.2. U.K. Market size and forecast, 2016-2026 (Kilo Tons)
      10. 4.5.10. Italy
        1. 4.5.10.1. Italy Market size and forecast, 2016-2026 (USD Million)
        2. 4.5.10.2. Italy Market size and forecast, 2016-2026 (Kilo Tons)
      11. 4.5.11. Spain
        1. 4.5.11.1. Spain Market size and forecast, 2016-2026 (USD Million)
        2. 4.5.11.2. Spain Market size and forecast, 2016-2026 (Kilo Tons)
      12. 4.5.12. Rest of Europe
        1. 4.5.12.1. Rest of Europe Market size and forecast, 2016-2026 (USD Million)
        2. 4.5.12.2. Rest of Europe Market size and forecast, 2016-2026 (Kilo Tons)
    6. 4.6. Asia Pacific
      1. 4.6.1. Asia Pacific Craft Beer Market size and forecast, 2016-2026
      2. 4.6.2. Asia Pacific Craft Beer Market, by Country, 2018 - 2025 (USD Million)
      3. 4.6.3. Asia Pacific Market size and forecast, 2016-2026 (Kilo Tons)
      4. 4.6.4. Asia Pacific Craft Beer Market, by Country, 2018 - 2025 (Kilo Tons)
      5. 4.6.5. Asia Pacific Craft Beer Market, by Type, 2016-2026
        1. 4.6.5.1. Asia Pacific Craft Beer Market, by Type, 2016-2026 (USD Million)
        2. 4.6.5.2. Asia Pacific Craft Beer Market, by Type, 2016-2026 (Kilo Tons)
      6. 4.6.6. Asia Pacific Craft Beer Market, by Distribution, 2016-2026
        1. 4.6.6.1. Asia Pacific Craft Beer Market, by Distribution, 2016-2026 (USD Million)
        2. 4.6.6.2. Asia Pacific Craft Beer Market, by Distribution, 2016-2026 (Kilo Tons)
      7. 4.6.7. China
        1. 4.6.7.1. China Market size and forecast, 2016-2026 (USD Million)
        2. 4.6.7.2. China Market size and forecast, 2016-2026 (Kilo Tons)
      8. 4.6.8. Japan
        1. 4.6.8.1. Japan Market size and forecast, 2016-2026 (USD Million)
        2. 4.6.8.2. Japan Market size and forecast, 2016-2026 (Kilo Tons)
      9. 4.6.9. India
        1. 4.6.9.1. India Market size and forecast, 2016-2026 (USD Million)
        2. 4.6.9.2. India Market size and forecast, 2016-2026 (Kilo Tons)
      10. 4.6.10. South Korea
        1. 4.6.10.1. South Korea Market size and forecast, 2016-2026 (USD Million)
        2. 4.6.10.2. South Korea Market size and forecast, 2016-2026 (Kilo Tons)
      11. 4.6.11. South-East Asia
        1. 4.6.11.1. South-East Asia Market size and forecast, 2016-2026 (USD Million)
        2. 4.6.11.2. South-East Asia Market size and forecast, 2016-2026 (Kilo Tons)
      12. 4.6.12. Rest of Asia Pacific
        1. 4.6.12.1. Rest of Asia Pacific Market size and forecast, 2016-2026 (USD Million)
        2. 4.6.12.2. Rest of Asia Pacific Market size and forecast, 2016-2026 (Kilo Tons)
    7. 4.7. Latin America
      1. 4.7.1. Latin America Craft Beer Market size and forecast, 2016-2026
      2. 4.7.2. Latin America Craft Beer Market, by Country, 2018 - 2025 (USD Million)
      3. 4.7.3. Latin America Market size and forecast, 2016-2026 (Kilo Tons)
      4. 4.7.4. Latin America Craft Beer Market, by Country, 2018 - 2025 (Kilo Tons)
      5. 4.7.5. Latin America Craft Beer Market, by Type, 2016-2026
        1. 4.7.5.1. Latin America Craft Beer Market, by Type, 2016-2026 (USD Million)
        2. 4.7.5.2. Latin America Craft Beer Market, by Type, 2016-2026 (Kilo Tons)
      6. 4.7.6. Latin America Craft Beer Market, by Distribution, 2016-2026
        1. 4.7.6.1. Latin America Craft Beer Market, by Distribution, 2016-2026 (USD Million)
        2. 4.7.6.2. Latin America Craft Beer Market, by Distribution, 2016-2026 (Kilo Tons)
      7. 4.7.7. Brazil
        1. 4.7.7.1. Brazil Market size and forecast, 2016-2026 (USD Million)
        2. 4.7.7.2. Brazil Market size and forecast, 2016-2026 (Kilo Tons)
      8. 4.7.8. Mexico
        1. 4.7.8.1. Mexico Market size and forecast, 2016-2026 (USD Million)
        2. 4.7.8.2. Mexico Market size and forecast, 2016-2026 (Kilo Tons)
      9. 4.7.9. Rest of Latin America
        1. 4.7.9.1. Rest of Latin America Market size and forecast, 2016-2026 (USD Million)
        2. 4.7.9.2. Rest of Latin America Market size and forecast, 2016-2026 (Kilo Tons)
    8. 4.8. The Middle-East and Africa
      1. 4.8.1. The Middle-East and Africa Craft Beer Market size and forecast, 2016-2026
      2. 4.8.2. The Middle-East and Africa Craft Beer Market, by Country, 2018 - 2025 (USD Million)
      3. 4.8.3. The Middle-East and Africa Market size and forecast, 2016-2026 (Kilo Tons)
      4. 4.8.4. The Middle-East and Africa Craft Beer Market, by Country, 2018 - 2025 (Kilo Tons)
      5. 4.8.5. The Middle-East and Africa Craft Beer Market, by Type, 2016-2026
        1. 4.8.5.1. The Middle-East and Africa Craft Beer Market, by Type, 2016-2026 (USD Million)
        2. 4.8.5.2. The Middle-East and Africa Craft Beer Market, by Type, 2016-2026 (Kilo Tons)
      6. 4.8.6. The Middle-East and Africa Craft Beer Market, by Distribution, 2016-2026
        1. 4.8.6.1. The Middle-East and Africa Craft Beer Market, by Distribution, 2016-2026 (USD Million)
        2. 4.8.6.2. The Middle-East and Africa Craft Beer Market, by Distribution, 2016-2026 (Kilo Tons)
      7. 4.8.7. GCC Countries
        1. 4.8.7.1. GCC Countries Market size and forecast, 2016-2026 (USD Million)
        2. 4.8.7.2. GCC Countries Market size and forecast, 2016-2026 (Kilo Tons)
      8. 4.8.8. South Africa
        1. 4.8.8.1. South Africa Market size and forecast, 2016-2026 (USD Million)
        2. 4.8.8.2. South Africa Market size and forecast, 2016-2026 (Kilo Tons)
      9. 4.8.9. Rest of Middle-East Africa
        1. 4.8.9.1. Rest of Middle-East Africa Market size and forecast, 2016-2026 (USD Million)
        2. 4.8.9.2. Rest of Middle-East Africa Market size and forecast, 2016-2026 (Kilo Tons)
  5. CHAPTER 5. Craft Beer Production, Consumption, Export, Import by Regions
    1. 5.1. Global Craft Beer production and revenue, 2015-2025 (USD Million) (Kilo Tons)
    2. 5.2. Global Import and Export Analysis, by Region
  6. CHAPTER 6. Craft Beer market – Competitive Landscape
    1. 6.1. Competitor Market Share – Revenue
    2. 6.2. Market Concentration Rate Analysis, Top 3 and Top 5 Players
    3. 6.3. Competitor Market Share – Volume
    4. 6.4. Strategic Development
      1. 6.4.1. Acquisitions and Mergers
      2. 6.4.2. New Products
      3. 6.4.3. Research & Development Activities
  7. CHAPTER 7. Company Profiles
    1. 7.1. The Lagunitas Brewing Company
      1. 7.1.1. Company Overview
      2. 7.1.2. The Lagunitas Brewing Company Sales, Revenue, Price, and Gross Margin
      3. 7.1.3. Product portfolio
      4. 7.1.4. Recent initiatives
    2. 7.2. The Gambrinus Company
      1. 7.2.1. Company Overview
      2. 7.2.2. The Gambrinus Company Sales, Revenue, Price, and Gross Margin
      3. 7.2.3. Product portfolio
      4. 7.2.4. Recent initiatives
    3. 7.3. D.G. Yuengling and Son
      1. 7.3.1. Company Overview
      2. 7.3.2. D.G. Yuengling and Son Sales, Revenue, Price, and Gross Margin
      3. 7.3.3. Product portfolio
      4. 7.3.4. Recent initiatives
    4. 7.4. Anheuser-Busch InBev
      1. 7.4.1. Company Overview
      2. 7.4.2. Anheuser-Busch InBev Sales, Revenue, Price, and Gross Margin
      3. 7.4.3. Product portfolio
      4. 7.4.4. Recent initiatives
    5. 7.5. New Belgium Brewing Company
      1. 7.5.1. Company Overview
      2. 7.5.2. New Belgium Brewing Company Sales, Revenue, Price, and Gross Margin
      3. 7.5.3. Product portfolio
      4. 7.5.4. Recent initiatives
    6. 7.6. The Boston Beer Company
      1. 7.6.1. Company Overview
      2. 7.6.2. The Boston Beer Company Sales, Revenue, Price, and Gross Margin
      3. 7.6.3. Product portfolio
      4. 7.6.4. Recent initiatives
    7. 7.7. Sierra Nevada
      1. 7.7.1. Company Overview
      2. 7.7.2. Sierra Nevada Sales, Revenue, Price, and Gross Margin
      3. 7.7.3. Product portfolio
      4. 7.7.4. Recent initiatives
    8. 7.8. Stone & Wood Brewing Co.
      1. 7.8.1. Company Overview
      2. 7.8.2. Stone & Wood Brewing Co. Sales, Revenue, Price, and Gross Margin
      3. 7.8.3. Product portfolio
      4. 7.8.4. Recent initiatives
    9. 7.9. Sam Adams
      1. 7.9.1. Company Overview
      2. 7.9.2. Sam Adams Sales, Revenue, Price, and Gross Margin
      3. 7.9.3. Product portfolio
      4. 7.9.4. Recent initiatives
    10. 7.10. Bell's Brewery Inc.
      1. 7.10.1. Company Overview
      2. 7.10.2. Bell's Brewery Inc. Sales, Revenue, Price, and Gross Margin
      3. 7.10.3. Product portfolio
      4. 7.10.4. Recent initiatives
    11. 7.11. Others
      1. 7.11.1. Company Overview
      2. 7.11.2. Others Sales, Revenue, Price, and Gross Margin
      3. 7.11.3. Product portfolio
      4. 7.11.4. Recent initiatives
  8. CHAPTER 8. Craft Beer — Industry Analysis
    1. 8.1. Introduction and Taxonomy
    2. 8.2. Craft Beer Market – Key Trends
      1. 8.2.1. Market Drivers
      2. 8.2.2. Market Restraints
      3. 8.2.3. Market Opportunities
    3. 8.3. Value Chain Analysis
    4. 8.4. Key Mandates and Regulations
    5. 8.5. Technology Roadmap and Timeline
    6. 8.6. Craft Beer market – Attractiveness Analysis
      1. 8.6.1. By Type
      2. 8.6.2. By Distribution
      3. 8.6.3. By Region
  9. CHAPTER 9. Raw Material analysis
    1. 9.1. Craft Beer Key Raw Material Analysis
      1. 9.1.1. Key Raw Materials
      2. 9.1.2. Price Trend of Key Raw Materials
    2. 9.2. Key Suppliers of Raw Materials
    3. 9.3. Proportion of Manufacturing Cost Structure
      1. 9.3.1. Raw Materials
      2. 9.3.2. Labor Cost
    4. 9.4. Manufacturing Expenses Analysis of Craft Beer
  10. CHAPTER 10. Industrial Chain, Sourcing Strategy and Downstream Buyers
    1. 10.1. Craft Beer Industrial Chain Analysis
    2. 10.2. Upstream Raw Materials Sourcing
      1. 10.2.1. Risk Mitigation:
      2. 10.2.2. Supplier Relationships:
      3. 10.2.3. Business Processes:
      4. 10.2.4. Securing the Product:
    3. 10.3. Raw Materials Sources of Craft Beer Major Manufacturers in 2016
    4. 10.4. Downstream Buyers
    5. 10.5. Distributors/Traders List
  11. CHAPTER 11. Marketing Strategy Analysis, Distributors
    1. 11.1. Marketing Channel
    2. 11.2. Direct Marketing
    3. 11.3. Indirect Marketing
    4. 11.4. Marketing Channel Development Trend
    5. 11.5. Economic/Political Environmental Change
  12. CHAPTER 12. Report Conclusion
  13. CHAPTER 13. Research Approach & Methodology
    1. 13.1. Report Description
    2. 13.2. Research Scope
    3. 13.3. Research Methodology
      1. 13.3.1. Secondary Research
      2. 13.3.2. Primary Research
      3. 13.3.3. Models
        1. 13.3.3.1. Company Share Analysis Model
        2. 13.3.3.2. Revenue Based Modeling
        3. 13.3.3.3. Research Limitations

        List of Figures

        FIG. 1 Global Craft Beer Market, 2016-2026 (USD Million)
        FIG. 2 Global Craft Beer Market Share, by Type, 2018 & 2025 (USD Million)
        FIG. 3 Global Craft Beer Market share, by Type, 2018 & 2025 (Kilo Tons)
        FIG. 4 Global Ales Craft Beer Market, 2016-2026 (USD Million)
        FIG. 5 Global Ales Craft Beer  Market, 2016-2026 (Kilo Tons)
        FIG. 6 Global Specialty Beers Craft Beer Market, 2016-2026 (USD Million)
        FIG. 7 Global Specialty Beers Craft Beer  Market, 2016-2026 (Kilo Tons)
        FIG. 8 Global Pilsners & Pale Lagers Craft Beer Market, 2016-2026 (USD Million)
        FIG. 9 Global Pilsners & Pale Lagers Craft Beer  Market, 2016-2026 (Kilo Tons)
        FIG. 10 Global Others Craft Beer Market, 2016-2026 (USD Million)
        FIG. 11 Global Others Craft Beer  Market, 2016-2026 (Kilo Tons)
        FIG. 12 Global Craft Beer Market Share, by Distribution, 2018 & 2025 (USD Million)
        FIG. 13 Global Craft Beer Market share, by Distribution, 2018 & 2025 (Kilo Tons)
        FIG. 14 Global Off-Trade Craft Beer Market, 2016-2026 (USD Million)
        FIG. 15 Global Off-Trade Craft Beer  Market, 2016-2026 (Kilo Tons)
        FIG. 16 Global On-Trade Craft Beer Market, 2016-2026 (USD Million)
        FIG. 17 Global On-Trade Craft Beer  Market, 2016-2026 (Kilo Tons)
        FIG. 18 Global Craft Beer Market Share, by Region, 2018 & 2025
        FIG. 19 Global Craft Beer Market Share, by Region, 2018 & 2025
        FIG. 20 North America Craft Beer Market, 2016-2026
        FIG. 21 North America Craft Beer  Market, 2016-2026 (Kilo Tons)
        FIG. 22 U.S. Craft Beer Market, 2016-2026
        FIG. 23 U.S. Craft Beer  Market, 2016-2026 (Kilo Tons)
        FIG. 24 Canada Craft Beer Market, 2016-2026
        FIG. 25 Canada Craft Beer  Market, 2016-2026 (Kilo Tons)
        FIG. 26 Europe Craft Beer Market, 2016-2026
        FIG. 27 Europe Craft Beer  Market, 2016-2026 (Kilo Tons)
        FIG. 28 Germany Craft Beer Market, 2016-2026
        FIG. 29 Germany Craft Beer  Market, 2016-2026 (Kilo Tons)
        FIG. 30 France Craft Beer Market, 2016-2026
        FIG. 31 France Craft Beer  Market, 2016-2026 (Kilo Tons)
        FIG. 32 U.K. Craft Beer Market, 2016-2026
        FIG. 33 U.K. Craft Beer  Market, 2016-2026 (Kilo Tons)
        FIG. 34 Italy Craft Beer Market, 2016-2026
        FIG. 35 Italy Craft Beer  Market, 2016-2026 (Kilo Tons)
        FIG. 36 Spain Craft Beer Market, 2016-2026
        FIG. 37 Spain Craft Beer  Market, 2016-2026 (Kilo Tons)
        FIG. 38 Rest of Europe Craft Beer Market, 2016-2026
        FIG. 39 Rest of Europe Craft Beer  Market, 2016-2026 (Kilo Tons)
        FIG. 40 Asia Pacific Craft Beer Market, 2016-2026
        FIG. 41 Asia Pacific Craft Beer  Market, 2016-2026 (Kilo Tons)
        FIG. 42 China Craft Beer Market, 2016-2026
        FIG. 43 China Craft Beer  Market, 2016-2026 (Kilo Tons)
        FIG. 44 Japan Craft Beer Market, 2016-2026
        FIG. 45 Japan Craft Beer  Market, 2016-2026 (Kilo Tons)
        FIG. 46 India Craft Beer Market, 2016-2026
        FIG. 47 India Craft Beer  Market, 2016-2026 (Kilo Tons)
        FIG. 48 South  Korea Craft Beer Market, 2016-2026
        FIG. 49 South  Korea Craft Beer  Market, 2016-2026 (Kilo Tons)
        FIG. 50 South-East Asia Craft Beer Market, 2016-2026
        FIG. 51 South-East Asia Craft Beer  Market, 2016-2026 (Kilo Tons)
        FIG. 52 Rest of Asia Pacific Craft Beer Market, 2016-2026
        FIG. 53 Rest of Asia Pacific Craft Beer  Market, 2016-2026 (Kilo Tons)
        FIG. 54 Latin America Craft Beer Market, 2016-2026
        FIG. 55 Latin America Craft Beer  Market, 2016-2026 (Kilo Tons)
        FIG. 56 Brazil Craft Beer Market, 2016-2026
        FIG. 57 Brazil Craft Beer  Market, 2016-2026 (Kilo Tons)
        FIG. 58 Mexico Craft Beer Market, 2016-2026
        FIG. 59 Mexico Craft Beer  Market, 2016-2026 (Kilo Tons)
        FIG. 60 Rest of Latin America Craft Beer Market, 2016-2026
        FIG. 61 Rest of Latin America Craft Beer  Market, 2016-2026 (Kilo Tons)
        FIG. 62 The Middle-East and Africa Craft Beer Market, 2016-2026
        FIG. 63 The Middle-East and Africa Craft Beer  Market, 2016-2026 (Kilo Tons)
        FIG. 64 GCC Countries Craft Beer Market, 2016-2026
        FIG. 65 GCC Countries Craft Beer  Market, 2016-2026 (Kilo Tons)
        FIG. 66 South Africa Craft Beer Market, 2016-2026
        FIG. 67 South Africa Craft Beer  Market, 2016-2026 (Kilo Tons)
        FIG. 68 Rest of Middle-East Africa Craft Beer Market, 2016-2026
        FIG. 69 Rest of Middle-East Africa Craft Beer  Market, 2016-2026 (Kilo Tons)
        FIG. 70 Global Craft Beer production and revenue, 2015-2025 (USD Million) (Kilo Tons)
        FIG. 71 North America Craft Beer production and revenue, 2015-2025 (USD Million) (Kilo Tons)
        FIG. 72 Europe Craft Beer production and revenue, 2015-2025 (USD Million) (Kilo Tons)
        FIG. 73 Asia Pacific Craft Beer production and revenue, 2015-2025 (USD Million) (Kilo Tons)
        FIG. 74 Latin America Craft Beer production and revenue, 2015-2025 (USD Million) (Kilo Tons)
        FIG. 75 Middle East and Africa Craft Beer production and revenue, 2015-2025 (USD Million) (Kilo Tons)
        FIG. 76 Competitor Market Share – Revenue
        FIG. 77 Competitor Market Share – Volume
        FIG. 78 The Lagunitas Brewing Company Revenue and Growth Rate
        FIG. 79 The Lagunitas Brewing Company Market Share
        FIG. 80 The Gambrinus Company Revenue and Growth Rate
        FIG. 81 The Gambrinus Company Market Share
        FIG. 82 D.G. Yuengling and Son Revenue and Growth Rate
        FIG. 83 D.G. Yuengling and Son Market Share
        FIG. 84 Anheuser-Busch InBev Revenue and Growth Rate
        FIG. 85 Anheuser-Busch InBev Market Share
        FIG. 86 New Belgium Brewing Company Revenue and Growth Rate
        FIG. 87 New Belgium Brewing Company Market Share
        FIG. 88 The Boston Beer Company Revenue and Growth Rate
        FIG. 89 The Boston Beer Company Market Share
        FIG. 90 Sierra Nevada Revenue and Growth Rate
        FIG. 91 Sierra Nevada Market Share
        FIG. 92 Stone & Wood Brewing Co. Revenue and Growth Rate
        FIG. 93 Stone & Wood Brewing Co. Market Share
        FIG. 94 Sam Adams Revenue and Growth Rate
        FIG. 95 Sam Adams Market Share
        FIG. 96 Bell's Brewery Inc. Revenue and Growth Rate
        FIG. 97 Bell's Brewery Inc. Market Share
        FIG. 98 Others Revenue and Growth Rate
        FIG. 99 Others Market Share
        FIG. 100 Market Dynamics
        FIG. 101 Global Craft Beer – Value Chain Analysis
        FIG. 102 Key Mandates and Regulations
        FIG. 103 Technology Roadmap and Timeline
        FIG. 104 Market Attractiveness Analysis – By Type
        FIG. 105 Market Attractiveness Analysis – By Distribution
        FIG. 106 Market Attractiveness Analysis – By Region
        FIG. 107 Manufacturing Cost Structure of Craft Beer
        FIG. 108 Craft Beer Industrial Chain Analysis
        FIG. 109 Market Channel
        FIG. 110 Marketing Channel Development Trend
        FIG. 111 Growth in World Gross Product, 2008-2018

        List of Tables

        TABLE 1 Global Craft Beer market, 2018 & 2025 (USD Million)
        TABLE 2 Global Craft Beer market, by Type, 2016-2026 (USD Million)
        TABLE 3 Global Craft Beer market, by Type, 2016-2026 (Kilo Tons)
        TABLE 4 Global Craft Beer market, by Distribution, 2016-2026 (USD Million)
        TABLE 5 Global Craft Beer market, by Distribution, 2016-2026 (Kilo Tons)
        TABLE 6 Global Craft Beer market, by region, 2016-2026 (USD Million)
        TABLE 7 Global Craft Beer market, by region, 2016-2026 (Kilo Tons)
        TABLE 8 North America Craft Beer Market, by Type, 2016-2026 (USD Million)
        TABLE 9 North America Craft Beer Market, by Type, 2016-2026 (Kilo Tons)
        TABLE 10 North America Craft Beer Market, by Distribution, 2016-2026 (USD Million)
        TABLE 11 North America Craft Beer Market, by Distribution, 2016-2026 (Kilo Tons)
        TABLE 12 Europe Craft Beer Market, by Type, 2016-2026 (USD Million)
        TABLE 13 Europe Craft Beer Market, by Type, 2016-2026 (Kilo Tons)
        TABLE 14 Europe Craft Beer Market, by Distribution, 2016-2026 (USD Million)
        TABLE 15 Europe Craft Beer Market, by Distribution, 2016-2026 (Kilo Tons)
        TABLE 16 Asia Pacific Craft Beer Market, by Type, 2016-2026 (USD Million)
        TABLE 17 Asia Pacific Craft Beer Market, by Type, 2016-2026 (Kilo Tons)
        TABLE 18 Asia Pacific Craft Beer Market, by Distribution, 2016-2026 (USD Million)
        TABLE 19 Asia Pacific Craft Beer Market, by Distribution, 2016-2026 (Kilo Tons)
        TABLE 20 Latin America Craft Beer Market, by Type, 2016-2026 (USD Million)
        TABLE 21 Latin America Craft Beer Market, by Type, 2016-2026 (Kilo Tons)
        TABLE 22 Latin America Craft Beer Market, by Distribution, 2016-2026 (USD Million)
        TABLE 23 Latin America Craft Beer Market, by Distribution, 2016-2026 (Kilo Tons)
        TABLE 24 The Middle-East and Africa Craft Beer Market, by Type, 2016-2026 (USD Million)
        TABLE 25 The Middle-East and Africa Craft Beer Market, by Type, 2016-2026 (Kilo Tons)
        TABLE 26 The Middle-East and Africa Craft Beer Market, by Distribution, 2016-2026 (USD Million)
        TABLE 27 The Middle-East and Africa Craft Beer Market, by Distribution, 2016-2026 (Kilo Tons)
        TABLE 28 North America Craft Beer Production, Consumption, Export, Import, 2016-2019
        TABLE 29 Europe Craft Beer Production, Consumption, Export, Import, 2016-2019
        TABLE 30 Asia Pacific Craft Beer Production, Consumption, Export, Import, 2016-2019
        TABLE 31 Latin America Craft Beer Production, Consumption, Export, Import, 2016-2019
        TABLE 32 Middle East & Africa Craft Beer Production, Consumption, Export, Import, 2016-2019
        TABLE 33 Global Craft Beer Market - Company Revenue Analysis 2016-2019 (USD Million)
        TABLE 34 Global Craft Beer Market - Company Revenue Share Analysis 2016-2019(%)
        TABLE 35 Global Craft Beer Market - Company Volume Analysis 2016-2019 (Kilo Tons)
        TABLE 36 Global Craft Beer Market - Company Volume Share Analysis 2016-2019(%)
        TABLE 37 Acquisitions and Mergers
        TABLE 38 New Product/Service Launch
        TABLE 39 Research & Development Activities
        TABLE 40 Market Drivers
        TABLE 41 Market Restraints
        TABLE 42 Market Opportunities
        TABLE 43 Production Base and Market Concentration Rate of Raw Material
        TABLE 44 Key Suppliers of Raw Materials
        TABLE 45 Raw Materials Sources of Craft Beer Major Manufacturers in 2016
        TABLE 46 Major Buyers of Craft Beer
        TABLE 47 Distributors/Traders of Craft Beer by Region
        

Industry Major Market Players

  •  Bell's Brewery Inc.
  •  The Boston Beer Company
  •  Stone & Wood Brewing Co.
  •  The Gambrinus Company
  •  Anheuser-Busch InBev
  •  New Belgium Brewing Company
  •  Sierra Nevada
  •  Sam Adams
  •  D.G. Yuengling and Son
  •  The Lagunitas Brewing Company