Search Market Research Report

Discover Our Latest Reports
Discover Our Featured Reports
Discover Top Selling Reports

Cosmetic Ingredients Market Size, Share Global Analysis Report, , 2019 – 2026

report img

Cosmetic Ingredients Market by Type (Surfactants, Conditioning Polymers, Emulsifiers, Emollients, Antimicrobials, UV absorbers, Antioxidants and Preservatives, Rheology Modifiers, and Others), By Application – (Skin Care, Hair Care, Make Up, Oral Care, and Others): Global Industry Perspective, Comprehensive Analysis and Forecast, 2019 – 2026

Industry Insights

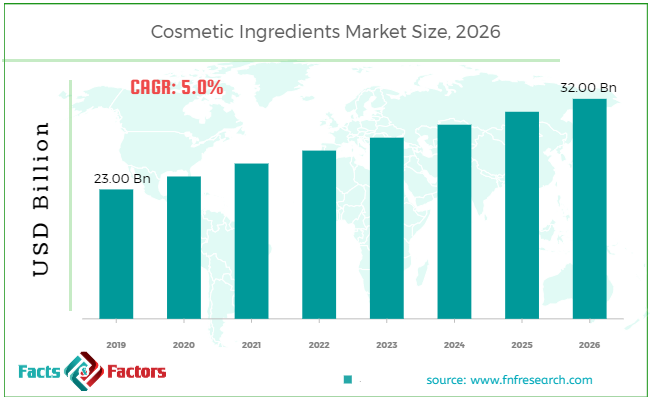
[195+ Pages Report] According to the report published by Facts Factors, the global cosmetic ingredients market size was worth around 23.00 billion in 2019 and is predicted to grow to around USD 32.00 billion by 2026 with a compound annual growth rate (CAGR) of roughly 5.0% between 2020 and 2026. The report analyzes the global cosmetic ingredients market drivers, restraints/challenges, and the effect they have on the demands during the projection period. In addition, the report explores emerging opportunities in the cosmetic ingredients market.

Cosmetic Ingredients Market Size

To know more about this report | Request Free Sample Copy

The report encompasses the forecast as well as an analysis of the cosmetic ingredients market on the global and regional levels. The study displays historical data from 2016 to 2019 along with a forecast from 2020 to 2026 based on revenue (USD Million). Additionally, the market growth drivers, opportunities, limitations, and trends are also included in the cosmetic ingredients market report.

We have included industry analysis models in our report and extensively demonstrated the key business strategies and competitive landscape of the cosmetic ingredients market in our study.


logoKey Insights from Primary Research

  • As per our primary respondents, the China cosmetic ingredients market is set to grow annually at a rate of around 5%
  • It was established through primary research that the China cosmetic ingredients market was valued at more than USD 23.00 Billion in 2019
  • The increasing demand for cosmetic ingredients from various end-use applications in China is supposed to display the highest growth in the regional market as it is one of the developed economies.
  • Innovation in cosmetic ingredients is supposed to fuel market growth. Companies are supposed to invest in R&D to innovate better products. Product invention will open new opportunities for cosmetic ingredients and thus are expected to propel the industry demand in the upcoming years.
  • Asia - Pacific region is continuing to expand the use of cosmetic ingredients in the personal care industry. Organic label companies in China and India are coming up with solutions that incorporate natural cosmetic ingredients into hair care products such as shampoos and fine-effect conditioners.
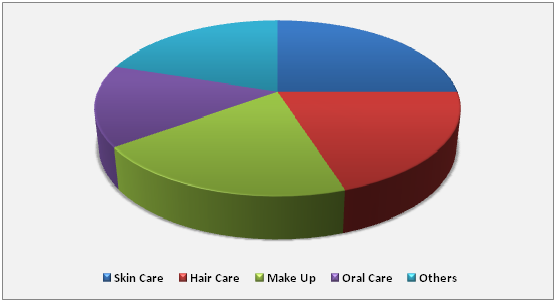
  • The “Skincare” category, on the basis of application segmentation, was the leading revenue-generating category accounting for around 30.0% share, in 2019.

logoKey Recommendations from Analysts

  • The growing popularity of skin care products in various countries across the globe is increasing the demand for cosmetic ingredients for skincare products. There is a huge demand for natural cosmetic ingredients sectors in developing regions such as the Asia Pacific, which is driving the Skincare industry in the regions.
  • North America region is anticipated to have a larger share of the cosmetic ingredients market in the upcoming years. Also, China's cosmetic ingredients market is to rise at the highest rate between 2020 and 2026.
  • Growing at a CAGR of around 7.0%, the China Cosmetic ingredients market provides numerous opportunities for all of the involved stakeholders across the entire value chain
  • Our analysts have identified “Emollients”, and “Emollients” categories as the leading investment pockets for the China Cosmetic ingredients market in terms of type and application segmentations respectively

logoGlobal Cosmetic Ingredients Market Revenue Share in 2019– By Type

Cosmetic Ingredients Market

To know more about this report | Request Free Sample Copy


Our study also includes an analysis of Porter’s Five Forces framework for understanding the competitive strategies used by market competitors. It also encompasses PESTLE analysis and SWOT analysis.

The report also offers an in-depth analysis of the market share of each industry player and gives an outline of the market position of key players in the cosmetic ingredients market. Moreover, the study offers wide coverage of key strategic improvements witnessed in the market such as acquisitions & mergers, new product launches, agreements, partnerships, collaborations & joint ventures, R&D activities, and geographical expansion of key players in the cosmetic ingredients market.

The study provides a decisive view of the cosmetic ingredients market by segmenting the cosmetic ingredients market based on type, application, and region. All the segments have been analyzed based on present and future trends and the market is estimated from 2020 to 2026.

logoReport Scope

Report Attribute

Details

Market Size in 2019

USD 23.00 Billion

Projected Market Size in 2026

USD 32.00 Billion

CAGR Growth Rate

5.0% CAGR

Base Year

2019

Forecast Years

2020-2026

Key Market Players

Actives International LLC, Akzo Nobel N.V., Archer Daniels Midland Company, Ashland Global Specialty Chemicals Inc., BASF SE, Clariant AG, COBIOSA, Croda International Plc, DuPont de Nemours Inc., Eastman Chemical Company, Evonik Industries AG, Innospec Inc., INOLEX Inc., Kao Corporation, Kolmar BNH Co Ltd., Lonza Group, Novacap Group (SEQENS), Solvay SA, and The Dow Chemical Co, among others.

Key Segment

By Type, Application, and Region

Major Regions Covered

North America, Europe, Asia Pacific, Latin America, and the Middle East & Africa

Purchase Options

Request customized purchase options to meet your research needs.Explore purchase options

The regional segmentation includes the current and forecast demand for North America, Europe, Asia Pacific, Latin America, and the Middle East and Africa.

The global cosmetic ingredients market is experiencing significant growth that is expected to continue over the upcoming years. A massive rise in the demand for multifunctional ingredients for skin care, as well as personal care products, is likely to act as a key driver of the global cosmetic ingredients market.

The cosmetic ingredients market is segmented based on type, application, and region. In terms of type, the market segment is sectored into surfactants, conditioning polymers, emulsifiers, emollients, antimicrobials, UV absorbers, antioxidants and preservatives, rheology modifiers, and others. In terms of application, the market segment is sectored into skin care, hair care, makeup, oral care, and others.

logoSome of the leading players in the global market include

  •  Actives International LLC
  •  Akzo Nobel N.V.
  •  Archer Daniels Midland Company
  •  Ashland Global Specialty Chemicals Inc.
  •  BASF SE
  •  Clariant AG
  •  COBIOSA
  •  Croda International Plc
  •  DuPont de Nemours Inc.
  •  Eastman Chemical Company
  •  Evonik Industries AG
  •  Innospec Inc.
  •  INOLEX Inc.
  •  Kao Corporation
  •  Kolmar BNH Co Ltd.
  •  Lonza Group
  •  Novacap Group (SEQENS)
  •  Solvay SA
  •  The Dow Chemical Co

This report segments the cosmetic ingredients market as follows:

logoBy Type Analysis

  • Surfactants
  • Conditioning Polymers
  • Emulsifiers
  • Emollients
  • Antimicrobials
  • UV absorbers
  • Antioxidants and Preservatives
  • Rheology Modifiers
  • Others

logoBy Application Analysis

  • Skin Care
  • Hair Care
  • Makeup
  • Oral Care
  • Others

logoBy Regional Analysis

  • North America
    • U.S
    • Canada
  • Europe
    • Germany
    • France
    • U.K.
    • Italy
    • Spain
    • Rest of Europe
  • Asia Pacific
    • China
    • Japan
    • India
    • South Korea
    • South-East Asia
    • Rest of Asia pacific
  • Latin America
    • Brazil
    • Mexico
    • Rest of Latin America
  • Middle East and Africa
    • GCC Countries
    • South Africa
    • Rest of Middle East & Africa

logoKey Pointers Addressed by the Report

  • Historical data and forecast analysis of the market
  • Drivers and Restraints affecting market dynamics
  • Exhaustive analysis about the future market trends
  • Comprehensive information about the leading market segments and region
  • Strategic developments made by the competitive players and in-depth analysis about its impact on market growth

Table of Content

  1. Chapter 1 Executive Summary
    1. 1.1. Introduction of Cosmetic Ingredients
    2. 1.2. Global Cosmetic Ingredients Market, 2019 & 2026 (USD Million)
    3. 1.3. Global Cosmetic Ingredients Market, 2016 – 2026 (USD Million)
    4. 1.4. Global Cosmetic Ingredients Market Absolute Revenue Opportunity, 2016 – 2026 (USD Million)
    5. 1.5. Global Cosmetic Ingredients Market Incremental Revenue Opportunity, 2020 – 2026 (USD Million)
  2. Chapter 2 Cosmetic Ingredients Market – Type Analysis
    1. 2.1. Global Cosmetic Ingredients Market – Type Overview
    2. 2.2. Global Cosmetic Ingredients Market Share, by Type, 2019 & 2026 (USD Million)
    3. 2.3. Surfactants
      1. 2.3.1. Global Surfactants Cosmetic Ingredients Market, 2016 – 2026 (USD Million)
    4. 2.4. Conditioning Polymers
      1. 2.4.1. Global Conditioning Polymers Cosmetic Ingredients Market, 2016 – 2026 (USD Million)
    5. 2.5. Emulsifiers
      1. 2.5.1. Global Emulsifiers Cosmetic Ingredients Market, 2016 – 2026 (USD Million)
    6. 2.6. Emollients
      1. 2.6.1. Global Emollients Cosmetic Ingredients Market, 2016 – 2026 (USD Million)
    7. 2.7. Antimicrobials
      1. 2.7.1. Global Antimicrobials Cosmetic Ingredients Market, 2016 – 2026 (USD Million)
    8. 2.8. UV Absorbers
      1. 2.8.1. Global UV Absorbers Cosmetic Ingredients Market, 2016 – 2026 (USD Million)
    9. 2.9. Antioxidants and Preservatives
      1. 2.9.1. Global Antioxidants and Preservatives Cosmetic Ingredients Market, 2016 – 2026 (USD Million)
    10. 2.10. Rheology Modifiers
      1. 2.10.1. Global Rheology Modifiers Cosmetic Ingredients Market, 2016 – 2026 (USD Million)
    11. 2.11. Others
      1. 2.11.1. Global Others Cosmetic Ingredients Market, 2016 – 2026 (USD Million)
  3. Chapter 3 Cosmetic Ingredients Market – Application Analysis
    1. 3.1. Global Cosmetic Ingredients Market – Application Overview
    2. 3.2. Global Cosmetic Ingredients Market Share, by Application, 2019 & 2026 (USD Million)
    3. 3.3. Skin Care
      1. 3.3.1. Global Skin Care Cosmetic Ingredients Market, 2016 – 2026 (USD Million)
    4. 3.4. Hair Care
      1. 3.4.1. Global Hair Care Cosmetic Ingredients Market, 2016 – 2026 (USD Million)
    5. 3.5. Make Up
      1. 3.5.1. Global Make Up Cosmetic Ingredients Market, 2016 – 2026 (USD Million)
    6. 3.6. Oral Care
      1. 3.6.1. Global Oral Care Cosmetic Ingredients Market, 2016 – 2026 (USD Million)
    7. 3.7. Others
      1. 3.7.1. Global Others Cosmetic Ingredients Market, 2016 – 2026 (USD Million)
  4. Chapter 4 Cosmetic Ingredients Market – Regional Analysis
    1. 4.1. Global Cosmetic Ingredients Market Regional Overview
    2. 4.2. Global Cosmetic Ingredients Market Share, by Region, 2019 & 2026 (USD Million)
    3. 4.3. North America
      1. 4.3.1. North America Cosmetic Ingredients Market, 2016 – 2026 (USD Million)
        1. 4.3.1.1. North America Cosmetic Ingredients Market, by Country, 2016 - 2026 (USD Million)
      2. 4.3.2. North America Cosmetic Ingredients Market, by Type, 2016 – 2026
        1. 4.3.2.1. North America Cosmetic Ingredients Market, by Type, 2016 – 2026 (USD Million)
      3. 4.3.3. North America Cosmetic Ingredients Market, by Application, 2016 – 2026
        1. 4.3.3.1. North America Cosmetic Ingredients Market, by Application, 2016 – 2026 (USD Million)
      4. 4.3.4. U.S.
        1. 4.3.4.1. U.S. Cosmetic Ingredients Market, 2016 – 2026 (USD Million)
      5. 4.3.5. Canada
        1. 4.3.5.1. Canada Cosmetic Ingredients Market, 2016 – 2026 (USD Million)
    4. 4.4. Europe
      1. 4.4.1. Europe Cosmetic Ingredients Market, 2016 – 2026 (USD Million)
        1. 4.4.1.1. Europe Cosmetic Ingredients Market, by Country, 2016 - 2026 (USD Million)
      2. 4.4.2. Europe Cosmetic Ingredients Market, by Type, 2016 – 2026
        1. 4.4.2.1. Europe Cosmetic Ingredients Market, by Type, 2016 – 2026 (USD Million)
      3. 4.4.3. Europe Cosmetic Ingredients Market, by Application, 2016 – 2026
        1. 4.4.3.1. Europe Cosmetic Ingredients Market, by Application, 2016 – 2026 (USD Million)
      4. 4.4.4. Germany
        1. 4.4.4.1. Germany Cosmetic Ingredients Market, 2016 – 2026 (USD Million)
      5. 4.4.5. France
        1. 4.4.5.1. France Cosmetic Ingredients Market, 2016 – 2026 (USD Million)
      6. 4.4.6. U.K.
        1. 4.4.6.1. U.K. Cosmetic Ingredients Market, 2016 – 2026 (USD Million)
      7. 4.4.7. Italy
        1. 4.4.7.1. Italy Cosmetic Ingredients Market, 2016 – 2026 (USD Million)
      8. 4.4.8. Spain
        1. 4.4.8.1. Spain Cosmetic Ingredients Market, 2016 – 2026 (USD Million)
      9. 4.4.9. Rest of Europe
        1. 4.4.9.1. Rest of Europe Cosmetic Ingredients Market, 2016 – 2026 (USD Million)
    5. 4.5. Asia Pacific
      1. 4.5.1. Asia Pacific Cosmetic Ingredients Market, 2016 – 2026 (USD Million)
        1. 4.5.1.1. Asia Pacific Cosmetic Ingredients Market, by Country, 2016 - 2026 (USD Million)
      2. 4.5.2. Asia Pacific Cosmetic Ingredients Market, by Type, 2016 – 2026
        1. 4.5.2.1. Asia Pacific Cosmetic Ingredients Market, by Type, 2016 – 2026 (USD Million)
      3. 4.5.3. Asia Pacific Cosmetic Ingredients Market, by Application, 2016 – 2026
        1. 4.5.3.1. Asia Pacific Cosmetic Ingredients Market, by Application, 2016 – 2026 (USD Million)
      4. 4.5.4. China
        1. 4.5.4.1. China Cosmetic Ingredients Market, 2016 – 2026 (USD Million)
      5. 4.5.5. Japan
        1. 4.5.5.1. Japan Cosmetic Ingredients Market, 2016 – 2026 (USD Million)
      6. 4.5.6. India
        1. 4.5.6.1. India Cosmetic Ingredients Market, 2016 – 2026 (USD Million)
      7. 4.5.7. South Korea
        1. 4.5.7.1. South Korea Cosmetic Ingredients Market, 2016 – 2026 (USD Million)
      8. 4.5.8. South-East Asia
        1. 4.5.8.1. South-East Asia Cosmetic Ingredients Market, 2016 – 2026 (USD Million)
      9. 4.5.9. Rest of Asia Pacific
        1. 4.5.9.1. Rest of Asia Pacific Cosmetic Ingredients Market, 2016 – 2026 (USD Million)
    6. 4.6. Latin America
      1. 4.6.1. Latin America Cosmetic Ingredients Market, 2016 – 2026 (USD Million)
        1. 4.6.1.1. Latin America Cosmetic Ingredients Market, by Country, 2016 - 2026 (USD Million)
      2. 4.6.2. Latin America Cosmetic Ingredients Market, by Type, 2016 – 2026
        1. 4.6.2.1. Latin America Cosmetic Ingredients Market, by Type, 2016 – 2026 (USD Million)
      3. 4.6.3. Latin America Cosmetic Ingredients Market, by Application, 2016 – 2026
        1. 4.6.3.1. Latin America Cosmetic Ingredients Market, by Application, 2016 – 2026 (USD Million)
      4. 4.6.4. Brazil
        1. 4.6.4.1. Brazil Cosmetic Ingredients Market, 2016 – 2026 (USD Million)
      5. 4.6.5. Mexico
        1. 4.6.5.1. Mexico Cosmetic Ingredients Market, 2016 – 2026 (USD Million)
      6. 4.6.6. Rest of Latin America
        1. 4.6.6.1. Rest of Latin America Cosmetic Ingredients Market, 2016 – 2026 (USD Million)
    7. 4.7. The Middle-East and Africa
      1. 4.7.1. The Middle-East and Africa Cosmetic Ingredients Market, 2016 – 2026 (USD Million)
        1. 4.7.1.1. The Middle-East and Africa Cosmetic Ingredients Market, by Country, 2016 - 2026 (USD Million)
      2. 4.7.2. The Middle-East and Africa Cosmetic Ingredients Market, by Type, 2016 – 2026
        1. 4.7.2.1. The Middle-East and Africa Cosmetic Ingredients Market, by Type, 2016 – 2026 (USD Million)
      3. 4.7.3. The Middle-East and Africa Cosmetic Ingredients Market, by Application, 2016 – 2026
        1. 4.7.3.1. The Middle-East and Africa Cosmetic Ingredients Market, by Application, 2016 – 2026 (USD Million)
      4. 4.7.4. GCC Countries
        1. 4.7.4.1. GCC Countries Cosmetic Ingredients Market, 2016 – 2026 (USD Million)
      5. 4.7.5. South Africa
        1. 4.7.5.1. South Africa Cosmetic Ingredients Market, 2016 – 2026 (USD Million)
      6. 4.7.6. Rest of Middle-East Africa
        1. 4.7.6.1. Rest of Middle-East Africa Cosmetic Ingredients Market, 2016 – 2026 (USD Million)
  5. Chapter 5 Cosmetic Ingredients Market – Competitive Landscape
    1. 5.1. Competitor Market Share – Revenue
    2. 5.2. Market Concentration Rate Analysis, Top 3 and Top 5 Players
    3. 5.3. Strategic Developments
      1. 5.3.1. Acquisitions and Mergers
      2. 5.3.2. New Products
      3. 5.3.3. Research & Development Activities
  6. Chapter 6 Company Profiles
    1. 6.1. Actives International LLC.
      1. 6.1.1. Company Overview
      2. 6.1.2. Product/Service Portfolio
      3. 6.1.3. Actives International LLC. Sales, Revenue, and Gross Margin
      4. 6.1.4. Actives International LLC. Revenue and Growth Rate
      5. 6.1.5. Actives International LLC. Market Share
      6. 6.1.6. Recent Initiatives, Funding/VC Activities, and Technological Innovations
    2. 6.2. Akzo Nobel N.V.
      1. 6.2.1. Company Overview
      2. 6.2.2. Product/Service Portfolio
      3. 6.2.3. Akzo Nobel N.V. Sales, Revenue, and Gross Margin
      4. 6.2.4. Akzo Nobel N.V. Revenue and Growth Rate
      5. 6.2.5. Akzo Nobel N.V. Market Share
      6. 6.2.6. Recent Initiatives, Funding/VC Activities, and Technological Innovations
    3. 6.3. Archer Daniels Midland Company
      1. 6.3.1. Company Overview
      2. 6.3.2. Product/Service Portfolio
      3. 6.3.3. Archer Daniels Midland Company Sales, Revenue, and Gross Margin
      4. 6.3.4. Archer Daniels Midland Company Revenue and Growth Rate
      5. 6.3.5. Archer Daniels Midland Company Market Share
      6. 6.3.6. Recent Initiatives, Funding/VC Activities, and Technological Innovations
    4. 6.4. Ashland Global Specialty Chemicals Inc.
      1. 6.4.1. Company Overview
      2. 6.4.2. Product/Service Portfolio
      3. 6.4.3. Ashland Global Specialty Chemicals Inc. Sales, Revenue, and Gross Margin
      4. 6.4.4. Ashland Global Specialty Chemicals Inc. Revenue and Growth Rate
      5. 6.4.5. Ashland Global Specialty Chemicals Inc. Market Share
      6. 6.4.6. Recent Initiatives, Funding/VC Activities, and Technological Innovations
    5. 6.5. BASF SE
      1. 6.5.1. Company Overview
      2. 6.5.2. Product/Service Portfolio
      3. 6.5.3. BASF SE Sales, Revenue, and Gross Margin
      4. 6.5.4. BASF SE Revenue and Growth Rate
      5. 6.5.5. BASF SE Market Share
      6. 6.5.6. Recent Initiatives, Funding/VC Activities, and Technological Innovations
    6. 6.6. Clariant AG
      1. 6.6.1. Company Overview
      2. 6.6.2. Product/Service Portfolio
      3. 6.6.3. Clariant AG Sales, Revenue, and Gross Margin
      4. 6.6.4. Clariant AG Revenue and Growth Rate
      5. 6.6.5. Clariant AG Market Share
      6. 6.6.6. Recent Initiatives, Funding/VC Activities, and Technological Innovations
    7. 6.7. COBIOSA
      1. 6.7.1. Company Overview
      2. 6.7.2. Product/Service Portfolio
      3. 6.7.3. COBIOSA Sales, Revenue, and Gross Margin
      4. 6.7.4. COBIOSA Revenue and Growth Rate
      5. 6.7.5. COBIOSA Market Share
      6. 6.7.6. Recent Initiatives, Funding/VC Activities, and Technological Innovations
    8. 6.8. Croda International Plc
      1. 6.8.1. Company Overview
      2. 6.8.2. Product/Service Portfolio
      3. 6.8.3. Croda International Plc Sales, Revenue, and Gross Margin
      4. 6.8.4. Croda International Plc Revenue and Growth Rate
      5. 6.8.5. Croda International Plc Market Share
      6. 6.8.6. Recent Initiatives, Funding/VC Activities, and Technological Innovations
    9. 6.9. DuPont de Nemours Inc.
      1. 6.9.1. Company Overview
      2. 6.9.2. Product/Service Portfolio
      3. 6.9.3. DuPont de Nemours Inc. Sales, Revenue, and Gross Margin
      4. 6.9.4. DuPont de Nemours Inc. Revenue and Growth Rate
      5. 6.9.5. DuPont de Nemours Inc. Market Share
      6. 6.9.6. Recent Initiatives, Funding/VC Activities, and Technological Innovations
    10. 6.10. Eastman Chemical Company
      1. 6.10.1. Company Overview
      2. 6.10.2. Product/Service Portfolio
      3. 6.10.3. Eastman Chemical Company Sales, Revenue, and Gross Margin
      4. 6.10.4. Eastman Chemical Company Revenue and Growth Rate
      5. 6.10.5. Eastman Chemical Company Market Share
      6. 6.10.6. Recent Initiatives, Funding/VC Activities, and Technological Innovations
    11. 6.11. Evonik Industries AG
      1. 6.11.1. Company Overview
      2. 6.11.2. Product/Service Portfolio
      3. 6.11.3. Evonik Industries AG Sales, Revenue, and Gross Margin
      4. 6.11.4. Evonik Industries AG Revenue and Growth Rate
      5. 6.11.5. Evonik Industries AG Market Share
      6. 6.11.6. Recent Initiatives, Funding/VC Activities, and Technological Innovations
    12. 6.12. Innospec Inc.
      1. 6.12.1. Company Overview
      2. 6.12.2. Product/Service Portfolio
      3. 6.12.3. Innospec Inc. Sales, Revenue, and Gross Margin
      4. 6.12.4. Innospec Inc. Revenue and Growth Rate
      5. 6.12.5. Innospec Inc. Market Share
      6. 6.12.6. Recent Initiatives, Funding/VC Activities, and Technological Innovations
    13. 6.13. INOLEX Inc.
      1. 6.13.1. Company Overview
      2. 6.13.2. Product/Service Portfolio
      3. 6.13.3. INOLEX Inc. Sales, Revenue, and Gross Margin
      4. 6.13.4. INOLEX Inc. Revenue and Growth Rate
      5. 6.13.5. INOLEX Inc. Market Share
      6. 6.13.6. Recent Initiatives, Funding/VC Activities, and Technological Innovations
    14. 6.14. Kao Corporation
      1. 6.14.1. Company Overview
      2. 6.14.2. Product/Service Portfolio
      3. 6.14.3. Kao Corporation Sales, Revenue, and Gross Margin
      4. 6.14.4. Kao Corporation Revenue and Growth Rate
      5. 6.14.5. Kao Corporation Market Share
      6. 6.14.6. Recent Initiatives, Funding/VC Activities, and Technological Innovations
    15. 6.15. Kolmar BNH Co Ltd.
      1. 6.15.1. Company Overview
      2. 6.15.2. Product/Service Portfolio
      3. 6.15.3. Kolmar BNH Co Ltd. Sales, Revenue, and Gross Margin
      4. 6.15.4. Kolmar BNH Co Ltd. Revenue and Growth Rate
      5. 6.15.5. Kolmar BNH Co Ltd. Market Share
      6. 6.15.6. Recent Initiatives, Funding/VC Activities, and Technological Innovations
    16. 6.16. Lonza Group
      1. 6.16.1. Company Overview
      2. 6.16.2. Product/Service Portfolio
      3. 6.16.3. Lonza Group Sales, Revenue, and Gross Margin
      4. 6.16.4. Lonza Group Revenue and Growth Rate
      5. 6.16.5. Lonza Group Market Share
      6. 6.16.6. Recent Initiatives, Funding/VC Activities, and Technological Innovations
    17. 6.17. Novacap Group (SEQENS)
      1. 6.17.1. Company Overview
      2. 6.17.2. Product/Service Portfolio
      3. 6.17.3. Novacap Group (SEQENS) Sales, Revenue, and Gross Margin
      4. 6.17.4. Novacap Group (SEQENS) Revenue and Growth Rate
      5. 6.17.5. Novacap Group (SEQENS) Market Share
      6. 6.17.6. Recent Initiatives, Funding/VC Activities, and Technological Innovations
    18. 6.18. Solvay SA
      1. 6.18.1. Company Overview
      2. 6.18.2. Product/Service Portfolio
      3. 6.18.3. Solvay SA Sales, Revenue, and Gross Margin
      4. 6.18.4. Solvay SA Revenue and Growth Rate
      5. 6.18.5. Solvay SA Market Share
      6. 6.18.6. Recent Initiatives, Funding/VC Activities, and Technological Innovations
    19. 6.19. The Dow Chemical Co
      1. 6.19.1. Company Overview
      2. 6.19.2. Product/Service Portfolio
      3. 6.19.3. The Dow Chemical Co Sales, Revenue, and Gross Margin
      4. 6.19.4. The Dow Chemical Co Revenue and Growth Rate
      5. 6.19.5. The Dow Chemical Co Market Share
      6. 6.19.6. Recent Initiatives, Funding/VC Activities, and Technological Innovations
  7. Chapter 7 Cosmetic Ingredients — Industry Analysis
    1. 7.1. Introduction and Taxonomy
    2. 7.2. Cosmetic Ingredients Market – Key Trends
      1. 7.2.1. Market Drivers
      2. 7.2.2. Market Restraints
      3. 7.2.3. Market Opportunities
    3. 7.3. Value Chain Analysis
    4. 7.4. Key Mandates and Regulations
    5. 7.5. Technology Roadmap and Timeline
    6. 7.6. Cosmetic Ingredients Market – Attractiveness Analysis
      1. 7.6.1. By Type
      2. 7.6.2. By Application
      3. 7.6.3. By Region
  8. Chapter 8 Industrial Chain, Sourcing Strategy, and Downstream Buyers
    1. 8.1. Cosmetic Ingredients Industrial Chain Analysis
    2. 8.2. Downstream Buyers
    3. 8.3. Distributors/Traders List
  9. Chapter 9 Marketing Strategy Analysis
    1. 9.1. Marketing Channel
    2. 9.2. Direct Marketing
    3. 9.3. Indirect Marketing
    4. 9.4. Marketing Channel Development Trends
    5. 9.5. Economic/Political Environmental Change
  10. Chapter 10 Report Conclusion & Key Insights
    1. 10.1. Key Insights from Primary Interviews & Surveys Respondents
    2. 10.2. Key Takeaways from Analysts, Consultants, and Industry Leaders
  11. Chapter 11 Research Approach & Methodology
    1. 11.1. Report Description
    2. 11.2. Research Scope
    3. 11.3. Research Methodology
      1. 11.3.1. Secondary Research
      2. 11.3.2. Primary Research
      3. 11.3.3. Statistical Models
        1. 11.3.3.1. Company Share Analysis Model
        2. 11.3.3.2. Revenue Based Modeling
      4. 11.3.4. Research Limitations

      List of Figures

      Fig.1 Product Picture of Cosmetic Ingredients
      Fig.2 Global Cosmetic Ingredients Market, 2016 – 2026 (USD Million)
      Fig.3 Global Cosmetic Ingredients Market Absolute Revenue Opportunity, 2016 – 2026 (USD Million)
      Fig.4 Global Cosmetic Ingredients Market Incremental Revenue Opportunity, 2020 – 2026 (USD Million)
      Fig.5 Global Cosmetic Ingredients Market Share, by Type, 2019 & 2026 (USD Million)
      Fig.6 Global Surfactants Cosmetic Ingredients Market, 2016 – 2026 (USD Million)
      Fig.7 Global Conditioning Polymers Cosmetic Ingredients Market, 2016 – 2026 (USD Million)
      Fig.8 Global Emulsifiers Cosmetic Ingredients Market, 2016 – 2026 (USD Million)
      Fig.9 Global Emollients Cosmetic Ingredients Market, 2016 – 2026 (USD Million)
      Fig.10 Global Antimicrobials Cosmetic Ingredients Market, 2016 – 2026 (USD Million)
      Fig.11 Global UV Absorbers Cosmetic Ingredients Market, 2016 – 2026 (USD Million)
      Fig.12 Global Antioxidants and Preservatives Cosmetic Ingredients Market, 2016 – 2026 (USD Million)
      Fig.13 Global Rheology Modifiers Cosmetic Ingredients Market, 2016 – 2026 (USD Million)
      Fig.14 Global Others Cosmetic Ingredients Market, 2016 – 2026 (USD Million)
      Fig.15 Global Cosmetic Ingredients Market Share, by Application, 2019 & 2026 (USD Million)
      Fig.16 Global Skin Care Cosmetic Ingredients Market, 2016 – 2026 (USD Million)
      Fig.17 Global Hair Care Cosmetic Ingredients Market, 2016 – 2026 (USD Million)
      Fig.18 Global Make Up Cosmetic Ingredients Market, 2016 – 2026 (USD Million)
      Fig.19 Global Oral Care Cosmetic Ingredients Market, 2016 – 2026 (USD Million)
      Fig.20 Global Others Cosmetic Ingredients Market, 2016 – 2026 (USD Million)
      Fig.21 Global Cosmetic Ingredients Market Share, by Region, 2019 & 2026 (USD Million)
      Fig.22 North America Cosmetic Ingredients Market, 2016 – 2026 (USD Million)
      Fig.23 U.S. Cosmetic Ingredients Market, 2016 – 2026 (USD Million)
      Fig.24 Canada Cosmetic Ingredients Market, 2016 – 2026 (USD Million)
      Fig.25 Europe Cosmetic Ingredients Market, 2016 – 2026 (USD Million)
      Fig.26 Germany Cosmetic Ingredients Market, 2016 – 2026 (USD Million)
      Fig.27 France Cosmetic Ingredients Market, 2016 – 2026 (USD Million)
      Fig.28 U.K. Cosmetic Ingredients Market, 2016 – 2026 (USD Million)
      Fig.29 Italy Cosmetic Ingredients Market, 2016 – 2026 (USD Million)
      Fig.30 Spain Cosmetic Ingredients Market, 2016 – 2026 (USD Million)
      Fig.31 Rest of Europe Cosmetic Ingredients Market, 2016 – 2026 (USD Million)
      Fig.32 Asia Pacific Cosmetic Ingredients Market, 2016 – 2026 (USD Million)
      Fig.33 China Cosmetic Ingredients Market, 2016 – 2026 (USD Million)
      Fig.34 Japan Cosmetic Ingredients Market, 2016 – 2026 (USD Million)
      Fig.35 India Cosmetic Ingredients Market, 2016 – 2026 (USD Million)
      Fig.36 South  Korea Cosmetic Ingredients Market, 2016 – 2026 (USD Million)
      Fig.37 South-East Asia Cosmetic Ingredients Market, 2016 – 2026 (USD Million)
      Fig.38 Rest of Asia Pacific Cosmetic Ingredients Market, 2016 – 2026 (USD Million)
      Fig.39 Latin America Cosmetic Ingredients Market, 2016 – 2026 (USD Million)
      Fig.40 Brazil Cosmetic Ingredients Market, 2016 – 2026 (USD Million)
      Fig.41 Mexico Cosmetic Ingredients Market, 2016 – 2026 (USD Million)
      Fig.42 Rest of Latin America Cosmetic Ingredients Market, 2016 – 2026 (USD Million)
      Fig.43 The Middle-East and Africa Cosmetic Ingredients Market, 2016 – 2026 (USD Million)
      Fig.44 GCC Countries Cosmetic Ingredients Market, 2016 – 2026 (USD Million)
      Fig.45 South Africa Cosmetic Ingredients Market, 2016 – 2026 (USD Million)
      Fig.46 Rest of Middle-East Africa Cosmetic Ingredients Market, 2016 – 2026 (USD Million)
      Fig.47 Competitor Market Share – Revenue
      Fig.48 Actives International LLC. Revenue and Growth Rate
      Fig.49 Actives International LLC. Market Share
      Fig.50 Akzo Nobel N.V. Revenue and Growth Rate
      Fig.51 Akzo Nobel N.V. Market Share
      Fig.52 Archer Daniels Midland Company Revenue and Growth Rate
      Fig.53 Archer Daniels Midland Company Market Share
      Fig.54 Ashland Global Specialty Chemicals Inc. Revenue and Growth Rate
      Fig.55 Ashland Global Specialty Chemicals Inc. Market Share
      Fig.56 BASF SE Revenue and Growth Rate
      Fig.57 BASF SE Market Share
      Fig.58 Clariant AG Revenue and Growth Rate
      Fig.59 Clariant AG Market Share
      Fig.60 COBIOSA Revenue and Growth Rate
      Fig.61 COBIOSA Market Share
      Fig.62 Croda International Plc Revenue and Growth Rate
      Fig.63 Croda International Plc Market Share
      Fig.64 DuPont de Nemours Inc. Revenue and Growth Rate
      Fig.65 DuPont de Nemours Inc. Market Share
      Fig.66 Eastman Chemical Company Revenue and Growth Rate
      Fig.67 Eastman Chemical Company Market Share
      Fig.68 Evonik Industries AG Revenue and Growth Rate
      Fig.69 Evonik Industries AG Market Share
      Fig.70 Innospec Inc. Revenue and Growth Rate
      Fig.71 Innospec Inc. Market Share
      Fig.72 INOLEX Inc. Revenue and Growth Rate
      Fig.73 INOLEX Inc. Market Share
      Fig.74 Kao Corporation Revenue and Growth Rate
      Fig.75 Kao Corporation Market Share
      Fig.76 Kolmar BNH Co Ltd. Revenue and Growth Rate
      Fig.77 Kolmar BNH Co Ltd. Market Share
      Fig.78 Lonza Group Revenue and Growth Rate
      Fig.79 Lonza Group Market Share
      Fig.80 Novacap Group (SEQENS) Revenue and Growth Rate
      Fig.81 Novacap Group (SEQENS) Market Share
      Fig.82 Solvay SA Revenue and Growth Rate
      Fig.83 Solvay SA Market Share
      Fig.84 The Dow Chemical Co Revenue and Growth Rate
      Fig.85 The Dow Chemical Co Market Share
      Fig.86 Market Dynamics
      Fig.87 Global Cosmetic Ingredients – Value Chain Analysis
      Fig.88 Key Mandates and Regulations
      Fig.89 Technology Roadmap and Timeline
      Fig.90 Market Attractiveness Analysis – By Type
      Fig.91 Market Attractiveness Analysis – By Application
      Fig.92 Market Attractiveness Analysis – By Region
      Fig.93 Cosmetic Ingredients Industrial Chain Analysis
      Fig.94 Market Channels
      Fig.95 Marketing Channel Development Trend
      Fig.96 Growth in World Gross Product, 2008-2018 

      List of Tables

      Table 1 Global Cosmetic Ingredients Market, 2019 & 2026 (USD Million)
      Table 2 Global Cosmetic Ingredients Market, by Type, 2016 – 2026 (USD Million)
      Table 3 Global Cosmetic Ingredients Market, by Application, 2016 – 2026 (USD Million)
      Table 4 Global Cosmetic Ingredients Market, by Region, 2016 – 2026 (USD Million)
      Table 5 North America Cosmetic Ingredients Market, by Country, 2016 – 2026 (USD Million)
      Table 6 North America Cosmetic Ingredients Market, by Type, 2016 – 2026 (USD Million)
      Table 7 North America Cosmetic Ingredients Market, by Application, 2016 – 2026 (USD Million)
      Table 8 Europe Cosmetic Ingredients Market, by Country, 2016 – 2026 (USD Million)
      Table 9 Europe Cosmetic Ingredients Market, by Type, 2016 – 2026 (USD Million)
      Table 10 Europe Cosmetic Ingredients Market, by Application, 2016 – 2026 (USD Million)
      Table 11 Asia Pacific Cosmetic Ingredients Market, by Country, 2016 – 2026 (USD Million)
      Table 12 Asia Pacific Cosmetic Ingredients Market, by Type, 2016 – 2026 (USD Million)
      Table 13 Asia Pacific Cosmetic Ingredients Market, by Application, 2016 – 2026 (USD Million)
      Table 14 Latin America Cosmetic Ingredients Market, by Country, 2016 – 2026 (USD Million)
      Table 15 Latin America Cosmetic Ingredients Market, by Type, 2016 – 2026 (USD Million)
      Table 16 Latin America Cosmetic Ingredients Market, by Application, 2016 – 2026 (USD Million)
      Table 17 The Middle-East and Africa Cosmetic Ingredients Market, by Country, 2016 – 2026 (USD Million)
      Table 18 The Middle-East and Africa Cosmetic Ingredients Market, by Type, 2016 – 2026 (USD Million)
      Table 19 The Middle-East and Africa Cosmetic Ingredients Market, by Application, 2016 – 2026 (USD Million)
      Table 20 Global Cosmetic Ingredients Market - Company Revenue Analysis, 2016 – 2019 (USD Million)
      Table 21 Global Cosmetic Ingredients Market - Company Revenue Share Analysis, 2016 – 2019 (%)
      Table 22 Acquisitions and Mergers
      Table 23 Market Drivers – Impact Analysis
      Table 24 Market Restraints
      Table 25 Market Opportunities
      Table 26 Major Buyers of Cosmetic Ingredients
      Table 27 Distributors/Traders of Cosmetic Ingredients by Region

Industry Major Market Players

  •  Actives International LLC
  •  Akzo Nobel N.V.
  •  Archer Daniels Midland Company
  •  Ashland Global Specialty Chemicals Inc.
  •  BASF SE
  •  Clariant AG
  •  COBIOSA
  •  Croda International Plc
  •  DuPont de Nemours Inc.
  •  Eastman Chemical Company
  •  Evonik Industries AG
  •  Innospec Inc.
  •  INOLEX Inc.
  •  Kao Corporation
  •  Kolmar BNH Co Ltd.
  •  Lonza Group
  •  Novacap Group (SEQENS)
  •  Solvay SA
  •  The Dow Chemical Co