Search Market Research Report

Discover Our Latest Reports
Discover Our Featured Reports
Discover Top Selling Reports

Conveyor System Market Size, Share Global Analysis Report, 2021 – 2026

report img

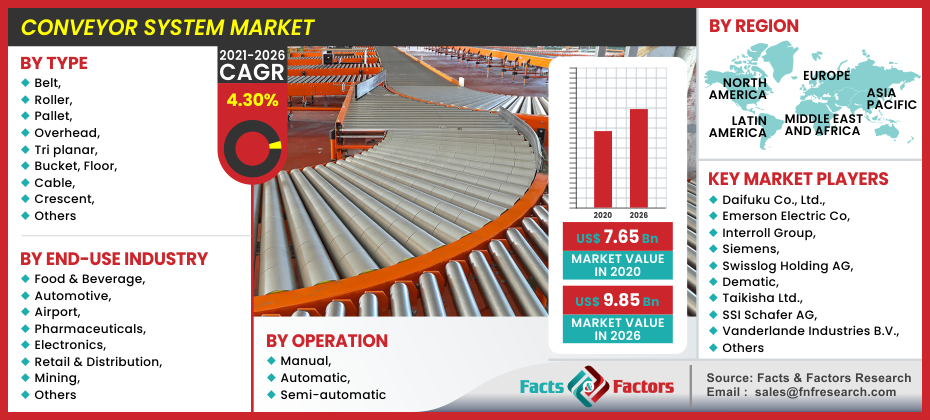
Conveyor System Market By Type (Belt, Roller, Pallet, Overhead, Tri planar, Bucket, Floor, Cable, Crescent, and Others), By Operation (Manual, Automatic, Semi-automatic), By End-Use Industry (Food & Beverage, Automotive, Airport, Pharmaceuticals, Electronics, Retail & Distribution, Mining, and Others) By Region: Global & Regional Industry Perspective, Comprehensive Analysis, and Forecast 2021 – 2026

Industry Insights

[221+ Pages Report] According to a survey released by Facts and Factors, the global conveyor systems market stood at USD 7.65 billion in 2020 and is predicted to register USD 9.85 billion by the end of 2026, rising at a CAGR of nearly 4.30% between 2021 and 2026.

logoMarket Overview      

A conveyor system is one of the most often used and favored pieces of equipment in the world, and it may be utilized in a variety of situations. It is a piece of machinery that is used to handle and carry items inside the confines of an industry. It is used in a variety of sectors, including automotive, manufacturing, retail, food and beverage, and transportation. Conveyor systems encompass a wide range of items, including belt conveyors, rollers, and pallets, among others. The usage of a conveyor system enables that a bigger volume of commodities is handled with greater efficiency. Conveyor systems are material handling machinery and equipment that transfer heavy or bulky raw materials and/or completed goods from one location to another in a fraction of the time that human labor would take.

Conveyor System Market

To know more about this report | Request Free Sample Copy

logoIndustry Growth Factors

Increasing investments in automotive, increased need for handling bigger volumes of products and boosting process efficiency, food & beverage, retail, and airport sectors, as well as material safety concerns, are among the primary drivers for the conveyor belt market. Manufacturers of conveyor belts use them extensively at airports for luggage screening and collection. The worldwide conveyor belt market will be driven by the expansion of current airports and the creation of new airports. Conveyor belts are being driven by the increase of industrial development activities in emerging nations as a result of government reforms. The need for powered roller conveyors is increasing as the worldwide packaging business grows with the global steel industry. The need for belt conveyors is rising as the number of assembly units grows, as these conveyor systems assist in the transfer of both normal and irregularly shaped objects from one location to another, regardless of their weight. Airport infrastructure construction has increased internationally as a result of rising disposable incomes in emerging nations, lower airfares, and burgeoning tourist industry.

logoSegmentation Analysis

The global conveyor system market is segregated based on type, operation, end-use industry, and region. Based on type, the global conveyor system industry is categorized into the roller, belt, overhead, pallet, bucket, tri-planar, cable, floor, crescent, and others. Based on operation, the global conveyor system industry is categorized into automatic, semi-automatic, and manual. Based on the end-use industry, the global conveyor system industry is categorized into automotive, food & beverage, pharmaceuticals, airport, retail & distribution, electronics, mining, and others.     

logoReport Scope

Report Attribute

Details

Market Size in 2020

USD 7.65 Billion

Projected Market Size in 2026

USD 9.85 Billion

CAGR Growth Rate

4.3% CAGR

Base Year

2020

Forecast Years

2021-2026

Key Market Players

Daifuku Co., Ltd., Emerson Electric Co, Interroll Group, Siemens, Swisslog Holding AG, Dematic, Taikisha Ltd., SSI Schafer AG, Vanderlande Industries B.V., Honeywell Intelligrated, Fives, TGW Logistics Group GmbH, Continental Conveyor, Shuttleworth, RUD, Redler, Nordstrong, Murata Machinery, Mahindra Conveyor Systems, FMC Technologies, Flexlink, Allied Conveyor Systems, Durr AG, Toyata Industries, and Bastian Solutions Inc. amongst others.

Key Segment

By Type, Operation, End-Use Industry, and Region

Major Regions Covered

North America, Europe, Asia Pacific, Latin America, and the Middle East & Africa

Purchase Options

Request customized purchase options to meet your research needs. Explore purchase options

logo Regional Analysis

In 2020, Asia Pacific is likely to be the leading regional conveyor systems market. Conveyor systems are prospering in emerging e-commerce businesses in promising locations such as North America and APAC. Consumers want the return procedure to be as quick and easy as the purchase process if they buy anything online and decide to return it for any reason. Conveyor systems are required for such procedures so that products may be moved efficiently. Rising industrialization in the Asia Pacific area, owing to strong GDP growth, rising employment, and high buying power, is expected to boost the regional market over the projected period. In order to compete in the market, Asian manufacturers have raised their quality requirements, throughout the forecast period. The improvement in economic conditions in nations like India, Thailand, and China is largely responsible for this. The rapidly growing populations in China and India are boosting demand for a variety of industries, including food and beverage, automotive, and e-commerce, to name a few. In addition, Asia-Pacific has 20-23 airports under development, with targeted completion dates ranging up to 2030. For example, China's Beijing Daxing International Airport, which is the city's second airport, began operations in 2019. This new airport has seven runways and can handle 620 thousand flights and 100 million people annually. The United States had the majority of the market share in the North American market. The presence of growing nations like Mexico and Brazil has boosted the demand for conveyor systems. The development of sophisticated & innovative goods such as malfunction detection systems, lean manufacturing techniques, and the rising food & beverage industry are some of the reasons that are predicted to contribute to market expansion.

logo Competitive Players

Some main participants of the global conveyor system market are :

  • Daifuku Co. Ltd.
  • Emerson Electric Co
  • Interroll Group
  • Siemens, Swisslog Holding AG
  • Dematic
  • Taikisha Ltd.
  • SSI Schafer AG
  • Vanderlande Industries B.V.
  • Honeywell Intelligrated
  • Fives
  • TGW Logistics Group GmbH
  • Continental Conveyor
  • Shuttleworth
  • RUD
  • Redler
  • Nordstrong
  • Murata Machinery
  • Mahindra Conveyor Systems
  • FMC Technologies
  • Flexlink
  • Allied Conveyor Systems
  • Durr AG
  • Toyata Industries
  • Bastian Solutions Inc.

logoConveyor System Market: Regional Segment Analysis

  • North America
    • U.S.
    • Canada
  • Europe
    • UK
    • France
    • Germany
    • Italy
    • Spain
    • Rest of Europe
  • Asia Pacific
    • China
    • Japan
    • India
    • South Korea
    • Southeast Asia
    • Rest of Asia Pacific
  • Latin America
    • Brazil
    • Mexico
    • Rest of Latin America
  • Middle East and Africa
    • GCC Countries
    • South Africa
    • Rest of MEA

Table of Content

  1. Chapter 1 Executive Summary
    1. 1.1. Introduction of Conveyor System
    2. 1.2. Global Conveyor System Market, 2020 & 2026 (USD Million)
    3. 1.3. Global Conveyor System Market, 2016 – 2026 (USD Million)
    4. 1.4. Global Conveyor System Market Absolute Revenue Opportunity, 2016 – 2026 (USD Million)
    5. 1.5. Global Conveyor System Market Incremental Revenue Opportunity, 2020 – 2026 (USD Million)
  2. Chapter 2 Conveyor System Market – Type Analysis
    1. 2.1. Global Conveyor System Market – Type Overview
    2. 2.2. Global Conveyor System Market Share, by Type, 2020 & 2026 (USD Million)
    3. 2.3. Belt
      1. 2.3.1. Global Belt Conveyor System Market, 2016 – 2026 (USD Million)
    4. 2.4. Roller
      1. 2.4.1. Global Roller Conveyor System Market, 2016 – 2026 (USD Million)
    5. 2.5. Pallet
      1. 2.5.1. Global Pallet Conveyor System Market, 2016 – 2026 (USD Million)
    6. 2.6. Overhead
      1. 2.6.1. Global Overhead Conveyor System Market, 2016 – 2026 (USD Million)
    7. 2.7. Tri planar
      1. 2.7.1. Global Tri planar Conveyor System Market, 2016 – 2026 (USD Million)
    8. 2.8. Bucket
      1. 2.8.1. Global Bucket Conveyor System Market, 2016 – 2026 (USD Million)
    9. 2.9. Floor
      1. 2.9.1. Global Floor Conveyor System Market, 2016 – 2026 (USD Million)
    10. 2.10. Cable
      1. 2.10.1. Global Cable Conveyor System Market, 2016 – 2026 (USD Million)
    11. 2.11. Crescent
      1. 2.11.1. Global Crescent Conveyor System Market, 2016 – 2026 (USD Million)
    12. 2.12. Others
      1. 2.12.1. Global Others Conveyor System Market, 2016 – 2026 (USD Million)
  3. Chapter 3 Conveyor System Market – Operation Analysis
    1. 3.1. Global Conveyor System Market – Operation Overview
    2. 3.2. Global Conveyor System Market Share, by Operation, 2020 & 2026 (USD Million)
    3. 3.3. Manual
      1. 3.3.1. Global Manual Conveyor System Market, 2016 – 2026 (USD Million)
    4. 3.4. Automatic
      1. 3.4.1. Global Automatic Conveyor System Market, 2016 – 2026 (USD Million)
    5. 3.5. Semi-automatic
      1. 3.5.1. Global Semi-automatic Conveyor System Market, 2016 – 2026 (USD Million)
  4. Chapter 4 Conveyor System Market – End-Use Industry Analysis
    1. 4.1. Global Conveyor System Market – End-Use Industry Overview
    2. 4.2. Global Conveyor System Market Share, by End-Use Industry, 2020 & 2026 (USD Million)
    3. 4.3. Food & Beverage
      1. 4.3.1. Global Food & Beverage Conveyor System Market, 2016 – 2026 (USD Million)
    4. 4.4. Automotive
      1. 4.4.1. Global Automotive Conveyor System Market, 2016 – 2026 (USD Million)
    5. 4.5. Airport
      1. 4.5.1. Global Airport Conveyor System Market, 2016 – 2026 (USD Million)
    6. 4.6. Pharmaceuticals
      1. 4.6.1. Global Pharmaceuticals Conveyor System Market, 2016 – 2026 (USD Million)
    7. 4.7. Electronics
      1. 4.7.1. Global Electronics Conveyor System Market, 2016 – 2026 (USD Million)
    8. 4.8. Retail & Distribution
      1. 4.8.1. Global Retail & Distribution Conveyor System Market, 2016 – 2026 (USD Million)
    9. 4.9. Mining
      1. 4.9.1. Global Mining Conveyor System Market, 2016 – 2026 (USD Million)
    10. 4.10. Others
      1. 4.10.1. Global Others Conveyor System Market, 2016 – 2026 (USD Million)
  5. Chapter 5 Conveyor System Market – Regional Analysis
    1. 5.1. Global Conveyor System Market Regional Overview
    2. 5.2. Global Conveyor System Market Share, by Region, 2020 & 2026 (USD Million)
    3. 5.3. North America
      1. 5.3.1. North America Conveyor System Market, 2016 – 2026 (USD Million)
        1. 5.3.1.1. North America Conveyor System Market, by Country, 2016 - 2026 (USD Million)
      2. 5.3.2. North America Conveyor System Market, by Type, 2016 – 2026
        1. 5.3.2.1. North America Conveyor System Market, by Type, 2016 – 2026 (USD Million)
      3. 5.3.3. North America Conveyor System Market, by Operation, 2016 – 2026
        1. 5.3.3.1. North America Conveyor System Market, by Operation, 2016 – 2026 (USD Million)
      4. 5.3.4. North America Conveyor System Market, by End-Use Industry, 2016 – 2026
        1. 5.3.4.1. North America Conveyor System Market, by End-Use Industry, 2016 – 2026 (USD Million)
      5. 5.3.5. U.S.
        1. 5.3.5.1. U.S. Conveyor System Market, 2016 – 2026 (USD Million)
      6. 5.3.6. Canada
        1. 5.3.6.1. Canada Conveyor System Market, 2016 – 2026 (USD Million)
    4. 5.4. Europe
      1. 5.4.1. Europe Conveyor System Market, 2016 – 2026 (USD Million)
        1. 5.4.1.1. Europe Conveyor System Market, by Country, 2016 - 2026 (USD Million)
      2. 5.4.2. Europe Conveyor System Market, by Type, 2016 – 2026
        1. 5.4.2.1. Europe Conveyor System Market, by Type, 2016 – 2026 (USD Million)
      3. 5.4.3. Europe Conveyor System Market, by Operation, 2016 – 2026
        1. 5.4.3.1. Europe Conveyor System Market, by Operation, 2016 – 2026 (USD Million)
      4. 5.4.4. Europe Conveyor System Market, by End-Use Industry, 2016 – 2026
        1. 5.4.4.1. Europe Conveyor System Market, by End-Use Industry, 2016 – 2026 (USD Million)
      5. 5.4.5. Germany
        1. 5.4.5.1. Germany Conveyor System Market, 2016 – 2026 (USD Million)
      6. 5.4.6. France
        1. 5.4.6.1. France Conveyor System Market, 2016 – 2026 (USD Million)
      7. 5.4.7. U.K.
        1. 5.4.7.1. U.K. Conveyor System Market, 2016 – 2026 (USD Million)
      8. 5.4.8. Italy
        1. 5.4.8.1. Italy Conveyor System Market, 2016 – 2026 (USD Million)
      9. 5.4.9. Spain
        1. 5.4.9.1. Spain Conveyor System Market, 2016 – 2026 (USD Million)
      10. 5.4.10. Rest of Europe
        1. 5.4.10.1. Rest of Europe Conveyor System Market, 2016 – 2026 (USD Million)
    5. 5.5. Asia Pacific
      1. 5.5.1. Asia Pacific Conveyor System Market, 2016 – 2026 (USD Million)
        1. 5.5.1.1. Asia Pacific Conveyor System Market, by Country, 2016 - 2026 (USD Million)
      2. 5.5.2. Asia Pacific Conveyor System Market, by Type, 2016 – 2026
        1. 5.5.2.1. Asia Pacific Conveyor System Market, by Type, 2016 – 2026 (USD Million)
      3. 5.5.3. Asia Pacific Conveyor System Market, by Operation, 2016 – 2026
        1. 5.5.3.1. Asia Pacific Conveyor System Market, by Operation, 2016 – 2026 (USD Million)
      4. 5.5.4. Asia Pacific Conveyor System Market, by End-Use Industry, 2016 – 2026
        1. 5.5.4.1. Asia Pacific Conveyor System Market, by End-Use Industry, 2016 – 2026 (USD Million)
      5. 5.5.5. China
        1. 5.5.5.1. China Conveyor System Market, 2016 – 2026 (USD Million)
      6. 5.5.6. Japan
        1. 5.5.6.1. Japan Conveyor System Market, 2016 – 2026 (USD Million)
      7. 5.5.7. India
        1. 5.5.7.1. India Conveyor System Market, 2016 – 2026 (USD Million)
      8. 5.5.8. South Korea
        1. 5.5.8.1. South Korea Conveyor System Market, 2016 – 2026 (USD Million)
      9. 5.5.9. South-East Asia
        1. 5.5.9.1. South-East Asia Conveyor System Market, 2016 – 2026 (USD Million)
      10. 5.5.10. Rest of Asia Pacific
        1. 5.5.10.1. Rest of Asia Pacific Conveyor System Market, 2016 – 2026 (USD Million)
    6. 5.6. Latin America
      1. 5.6.1. Latin America Conveyor System Market, 2016 – 2026 (USD Million)
        1. 5.6.1.1. Latin America Conveyor System Market, by Country, 2016 - 2026 (USD Million)
      2. 5.6.2. Latin America Conveyor System Market, by Type, 2016 – 2026
        1. 5.6.2.1. Latin America Conveyor System Market, by Type, 2016 – 2026 (USD Million)
      3. 5.6.3. Latin America Conveyor System Market, by Operation, 2016 – 2026
        1. 5.6.3.1. Latin America Conveyor System Market, by Operation, 2016 – 2026 (USD Million)
      4. 5.6.4. Latin America Conveyor System Market, by End-Use Industry, 2016 – 2026
        1. 5.6.4.1. Latin America Conveyor System Market, by End-Use Industry, 2016 – 2026 (USD Million)
      5. 5.6.5. Brazil
        1. 5.6.5.1. Brazil Conveyor System Market, 2016 – 2026 (USD Million)
      6. 5.6.6. Mexico
        1. 5.6.6.1. Mexico Conveyor System Market, 2016 – 2026 (USD Million)
      7. 5.6.7. Rest of Latin America
        1. 5.6.7.1. Rest of Latin America Conveyor System Market, 2016 – 2026 (USD Million)
    7. 5.7. The Middle-East and Africa
      1. 5.7.1. The Middle-East and Africa Conveyor System Market, 2016 – 2026 (USD Million)
        1. 5.7.1.1. The Middle-East and Africa Conveyor System Market, by Country, 2016 - 2026 (USD Million)
      2. 5.7.2. The Middle-East and Africa Conveyor System Market, by Type, 2016 – 2026
        1. 5.7.2.1. The Middle-East and Africa Conveyor System Market, by Type, 2016 – 2026 (USD Million)
      3. 5.7.3. The Middle-East and Africa Conveyor System Market, by Operation, 2016 – 2026
        1. 5.7.3.1. The Middle-East and Africa Conveyor System Market, by Operation, 2016 – 2026 (USD Million)
      4. 5.7.4. The Middle-East and Africa Conveyor System Market, by End-Use Industry, 2016 – 2026
        1. 5.7.4.1. The Middle-East and Africa Conveyor System Market, by End-Use Industry, 2016 – 2026 (USD Million)
      5. 5.7.5. GCC Countries
        1. 5.7.5.1. GCC Countries Conveyor System Market, 2016 – 2026 (USD Million)
      6. 5.7.6. South Africa
        1. 5.7.6.1. South Africa Conveyor System Market, 2016 – 2026 (USD Million)
      7. 5.7.7. Rest of Middle-East Africa
        1. 5.7.7.1. Rest of Middle-East Africa Conveyor System Market, 2016 – 2026 (USD Million)
  6. Chapter 6 Conveyor System Market – Competitive Landscape
    1. 6.1. Competitor Market Share – Revenue
    2. 6.2. Market Concentration Rate Analysis, Top 3 and Top 5 Players
    3. 6.3. Strategic Developments
      1. 6.3.1. Acquisitions and Mergers
      2. 6.3.2. New Products
      3. 6.3.3. Research & Development Activities
  7. Chapter 7 Company Profiles
    1. 7.1. Daifuku Co., Ltd.
      1. 7.1.1. Company Overview
      2. 7.1.2. Product/Service Portfolio
      3. 7.1.3. Daifuku Co., Ltd. Sales, Revenue, and Gross Margin
      4. 7.1.4. Daifuku Co., Ltd. Revenue and Growth Rate
      5. 7.1.5. Daifuku Co., Ltd. Market Share
      6. 7.1.6. Recent Initiatives, Funding/VC Activities, and Technological Innovations
    2. 7.2. Emerson Electric Co
      1. 7.2.1. Company Overview
      2. 7.2.2. Product/Service Portfolio
      3. 7.2.3. Emerson Electric Co Sales, Revenue, and Gross Margin
      4. 7.2.4. Emerson Electric Co Revenue and Growth Rate
      5. 7.2.5. Emerson Electric Co Market Share
      6. 7.2.6. Recent Initiatives, Funding/VC Activities, and Technological Innovations
    3. 7.3. Interroll Group
      1. 7.3.1. Company Overview
      2. 7.3.2. Product/Service Portfolio
      3. 7.3.3. Interroll Group Sales, Revenue, and Gross Margin
      4. 7.3.4. Interroll Group Revenue and Growth Rate
      5. 7.3.5. Interroll Group Market Share
      6. 7.3.6. Recent Initiatives, Funding/VC Activities, and Technological Innovations
    4. 7.4. Swisslog Holding AG
      1. 7.4.1. Company Overview
      2. 7.4.2. Product/Service Portfolio
      3. 7.4.3. Swisslog Holding AG Sales, Revenue, and Gross Margin
      4. 7.4.4. Swisslog Holding AG Revenue and Growth Rate
      5. 7.4.5. Swisslog Holding AG Market Share
      6. 7.4.6. Recent Initiatives, Funding/VC Activities, and Technological Innovations
    5. 7.5. Siemens
      1. 7.5.1. Company Overview
      2. 7.5.2. Product/Service Portfolio
      3. 7.5.3. Siemens Sales, Revenue, and Gross Margin
      4. 7.5.4. Siemens Revenue and Growth Rate
      5. 7.5.5. Siemens Market Share
      6. 7.5.6. Recent Initiatives, Funding/VC Activities, and Technological Innovations
    6. 7.6. Taikisha Ltd.
      1. 7.6.1. Company Overview
      2. 7.6.2. Product/Service Portfolio
      3. 7.6.3. Taikisha Ltd. Sales, Revenue, and Gross Margin
      4. 7.6.4. Taikisha Ltd. Revenue and Growth Rate
      5. 7.6.5. Taikisha Ltd. Market Share
      6. 7.6.6. Recent Initiatives, Funding/VC Activities, and Technological Innovations
    7. 7.7. Dematic
      1. 7.7.1. Company Overview
      2. 7.7.2. Product/Service Portfolio
      3. 7.7.3. Dematic Sales, Revenue, and Gross Margin
      4. 7.7.4. Dematic Revenue and Growth Rate
      5. 7.7.5. Dematic Market Share
      6. 7.7.6. Recent Initiatives, Funding/VC Activities, and Technological Innovations
    8. 7.8. Vanderlande Industries B.V.
      1. 7.8.1. Company Overview
      2. 7.8.2. Product/Service Portfolio
      3. 7.8.3. Vanderlande Industries B.V. Sales, Revenue, and Gross Margin
      4. 7.8.4. Vanderlande Industries B.V. Revenue and Growth Rate
      5. 7.8.5. Vanderlande Industries B.V. Market Share
      6. 7.8.6. Recent Initiatives, Funding/VC Activities, and Technological Innovations
    9. 7.9. SSI Schafer AG
      1. 7.9.1. Company Overview
      2. 7.9.2. Product/Service Portfolio
      3. 7.9.3. SSI Schafer AG Sales, Revenue, and Gross Margin
      4. 7.9.4. SSI Schafer AG Revenue and Growth Rate
      5. 7.9.5. SSI Schafer AG Market Share
      6. 7.9.6. Recent Initiatives, Funding/VC Activities, and Technological Innovations
    10. 7.10. TGW Logistics Group GmbH
      1. 7.10.1. Company Overview
      2. 7.10.2. Product/Service Portfolio
      3. 7.10.3. TGW Logistics Group GmbH Sales, Revenue, and Gross Margin
      4. 7.10.4. TGW Logistics Group GmbH Revenue and Growth Rate
      5. 7.10.5. TGW Logistics Group GmbH Market Share
      6. 7.10.6. Recent Initiatives, Funding/VC Activities, and Technological Innovations
    11. 7.11. Honeywell Intelligrated
      1. 7.11.1. Company Overview
      2. 7.11.2. Product/Service Portfolio
      3. 7.11.3. Honeywell Intelligrated Sales, Revenue, and Gross Margin
      4. 7.11.4. Honeywell Intelligrated Revenue and Growth Rate
      5. 7.11.5. Honeywell Intelligrated Market Share
      6. 7.11.6. Recent Initiatives, Funding/VC Activities, and Technological Innovations
    12. 7.12. Fives
      1. 7.12.1. Company Overview
      2. 7.12.2. Product/Service Portfolio
      3. 7.12.3. Fives Sales, Revenue, and Gross Margin
      4. 7.12.4. Fives Revenue and Growth Rate
      5. 7.12.5. Fives Market Share
      6. 7.12.6. Recent Initiatives, Funding/VC Activities, and Technological Innovations
    13. 7.13. Continental Conveyor
      1. 7.13.1. Company Overview
      2. 7.13.2. Product/Service Portfolio
      3. 7.13.3. Continental Conveyor Sales, Revenue, and Gross Margin
      4. 7.13.4. Continental Conveyor Revenue and Growth Rate
      5. 7.13.5. Continental Conveyor Market Share
      6. 7.13.6. Recent Initiatives, Funding/VC Activities, and Technological Innovations
    14. 7.14. Shuttleworth
      1. 7.14.1. Company Overview
      2. 7.14.2. Product/Service Portfolio
      3. 7.14.3. Shuttleworth Sales, Revenue, and Gross Margin
      4. 7.14.4. Shuttleworth Revenue and Growth Rate
      5. 7.14.5. Shuttleworth Market Share
      6. 7.14.6. Recent Initiatives, Funding/VC Activities, and Technological Innovations
    15. 7.15. RUD
      1. 7.15.1. Company Overview
      2. 7.15.2. Product/Service Portfolio
      3. 7.15.3. RUD Sales, Revenue, and Gross Margin
      4. 7.15.4. RUD Revenue and Growth Rate
      5. 7.15.5. RUD Market Share
      6. 7.15.6. Recent Initiatives, Funding/VC Activities, and Technological Innovations
    16. 7.16. Redler
      1. 7.16.1. Company Overview
      2. 7.16.2. Product/Service Portfolio
      3. 7.16.3. Redler Sales, Revenue, and Gross Margin
      4. 7.16.4. Redler Revenue and Growth Rate
      5. 7.16.5. Redler Market Share
      6. 7.16.6. Recent Initiatives, Funding/VC Activities, and Technological Innovations
    17. 7.17. Nordstrong
      1. 7.17.1. Company Overview
      2. 7.17.2. Product/Service Portfolio
      3. 7.17.3. Nordstrong Sales, Revenue, and Gross Margin
      4. 7.17.4. Nordstrong Revenue and Growth Rate
      5. 7.17.5. Nordstrong Market Share
      6. 7.17.6. Recent Initiatives, Funding/VC Activities, and Technological Innovations
    18. 7.18. Murata Machinery
      1. 7.18.1. Company Overview
      2. 7.18.2. Product/Service Portfolio
      3. 7.18.3. Murata Machinery Sales, Revenue, and Gross Margin
      4. 7.18.4. Murata Machinery Revenue and Growth Rate
      5. 7.18.5. Murata Machinery Market Share
      6. 7.18.6. Recent Initiatives, Funding/VC Activities, and Technological Innovations
    19. 7.19. Mahindra Conveyor Systems
      1. 7.19.1. Company Overview
      2. 7.19.2. Product/Service Portfolio
      3. 7.19.3. Mahindra Conveyor Systems Sales, Revenue, and Gross Margin
      4. 7.19.4. Mahindra Conveyor Systems Revenue and Growth Rate
      5. 7.19.5. Mahindra Conveyor Systems Market Share
      6. 7.19.6. Recent Initiatives, Funding/VC Activities, and Technological Innovations
    20. 7.20. FMC Technologies
      1. 7.20.1. Company Overview
      2. 7.20.2. Product/Service Portfolio
      3. 7.20.3. FMC Technologies Sales, Revenue, and Gross Margin
      4. 7.20.4. FMC Technologies Revenue and Growth Rate
      5. 7.20.5. FMC Technologies Market Share
      6. 7.20.6. Recent Initiatives, Funding/VC Activities, and Technological Innovations
    21. 7.21. Flexlink
      1. 7.21.1. Company Overview
      2. 7.21.2. Product/Service Portfolio
      3. 7.21.3. Flexlink Sales, Revenue, and Gross Margin
      4. 7.21.4. Flexlink Revenue and Growth Rate
      5. 7.21.5. Flexlink Market Share
      6. 7.21.6. Recent Initiatives, Funding/VC Activities, and Technological Innovations
    22. 7.22. Allied Conveyor Systems
      1. 7.22.1. Company Overview
      2. 7.22.2. Product/Service Portfolio
      3. 7.22.3. Allied Conveyor Systems Sales, Revenue, and Gross Margin
      4. 7.22.4. Allied Conveyor Systems Revenue and Growth Rate
      5. 7.22.5. Allied Conveyor Systems Market Share
      6. 7.22.6. Recent Initiatives, Funding/VC Activities, and Technological Innovations
    23. 7.23. Durr AG
      1. 7.23.1. Company Overview
      2. 7.23.2. Product/Service Portfolio
      3. 7.23.3. Durr AG Sales, Revenue, and Gross Margin
      4. 7.23.4. Durr AG Revenue and Growth Rate
      5. 7.23.5. Durr AG Market Share
      6. 7.23.6. Recent Initiatives, Funding/VC Activities, and Technological Innovations
    24. 7.24. Toyata Industries
      1. 7.24.1. Company Overview
      2. 7.24.2. Product/Service Portfolio
      3. 7.24.3. Toyata Industries Sales, Revenue, and Gross Margin
      4. 7.24.4. Toyata Industries Revenue and Growth Rate
      5. 7.24.5. Toyata Industries Market Share
      6. 7.24.6. Recent Initiatives, Funding/VC Activities, and Technological Innovations
    25. 7.25. Bastian Solutions Inc.
      1. 7.25.1. Company Overview
      2. 7.25.2. Product/Service Portfolio
      3. 7.25.3. Bastian Solutions Inc. Sales, Revenue, and Gross Margin
      4. 7.25.4. Bastian Solutions Inc. Revenue and Growth Rate
      5. 7.25.5. Bastian Solutions Inc. Market Share
      6. 7.25.6. Recent Initiatives, Funding/VC Activities, and Technological Innovations
  8. Chapter 8 Conveyor System — Industry Analysis
    1. 8.1. Introduction and Taxonomy
    2. 8.2. Conveyor System Market – Key Trends
      1. 8.2.1. Market Drivers
      2. 8.2.2. Market Restraints
      3. 8.2.3. Market Opportunities
    3. 8.3. Value Chain Analysis
    4. 8.4. Key Mandates and Regulations
    5. 8.5. Technology Roadmap and Timeline
    6. 8.6. Conveyor System Market – Attractiveness Analysis
      1. 8.6.1. By Type
      2. 8.6.2. By Operation
      3. 8.6.3. By End-Use Industry
      4. 8.6.4. By Region
  9. Chapter 9 Industrial Chain, Sourcing Strategy, and Downstream Buyers
    1. 9.1. Conveyor System Industrial Chain Analysis
    2. 9.2. Downstream Buyers
    3. 9.3. Distributors/Traders List
  10. Chapter 10 Marketing Strategy Analysis
    1. 10.1. Marketing Channel
    2. 10.2. Direct Marketing
    3. 10.3. Indirect Marketing
    4. 10.4. Marketing Channel Development Trends
    5. 10.5. Economic/Political Environmental Change
  11. Chapter 11 Report Conclusion & Key Insights
    1. 11.1. Key Insights from Primary Interviews & Surveys Respondents
    2. 11.2. Key Takeaways from Analysts, Consultants, and Industry Leaders
  12. Chapter 12 Research Approach & Methodology
    1. 12.1. Report Description
    2. 12.2. Research Scope
    3. 12.3. Research Methodology
      1. 12.3.1. Secondary Research
      2. 12.3.2. Primary Research
      3. 12.3.3. Statistical Models
        1. 12.3.3.1. Company Share Analysis Model
        2. 12.3.3.2. Revenue Based Modeling
      4. 12.3.4. Research Limitations

      List of Figures

      Fig.1	Product Picture of Conveyor System
      Fig.2	Global Conveyor System Market, 2016 – 2026 (USD Million)
      Fig.3	Global Conveyor System Market Absolute Revenue Opportunity, 2016 – 2026 (USD Million)
      Fig.4	Global Conveyor System Market Incremental Revenue Opportunity, 2020 – 2026 (USD Million)
      Fig.5	Global Conveyor System Market Share, by Type, 2020 & 2026 (USD Million)
      Fig.6	Global Belt Conveyor System Market, 2016 – 2026 (USD Million)
      Fig.7	Global Roller Conveyor System Market, 2016 – 2026 (USD Million)
      Fig.8	Global Pallet Conveyor System Market, 2016 – 2026 (USD Million)
      Fig.9	Global Overhead Conveyor System Market, 2016 – 2026 (USD Million)
      Fig.10	Global Tri planar Conveyor System Market, 2016 – 2026 (USD Million)
      Fig.11	Global Bucket Conveyor System Market, 2016 – 2026 (USD Million)
      Fig.12	Global Floor Conveyor System Market, 2016 – 2026 (USD Million)
      Fig.13	Global Cable Conveyor System Market, 2016 – 2026 (USD Million)
      Fig.14	Global Crescent Conveyor System Market, 2016 – 2026 (USD Million)
      Fig.15	Global Others Conveyor System Market, 2016 – 2026 (USD Million)
      Fig.16	Global Conveyor System Market Share, by Operation, 2020 & 2026 (USD Million)
      Fig.17	Global Manual Conveyor System Market, 2016 – 2026 (USD Million)
      Fig.18	Global Automatic Conveyor System Market, 2016 – 2026 (USD Million)
      Fig.19	Global Semi-automatic Conveyor System Market, 2016 – 2026 (USD Million)
      Fig.20	Global Conveyor System Market Share, by End-Use Industry, 2020 & 2026 (USD Million)
      Fig.21	Global Food & Beverage Conveyor System Market, 2016 – 2026 (USD Million)
      Fig.22	Global Automotive  Conveyor System Market, 2016 – 2026 (USD Million)
      Fig.23	Global Airport Conveyor System Market, 2016 – 2026 (USD Million)
      Fig.24	Global Pharmaceuticals Conveyor System Market, 2016 – 2026 (USD Million)
      Fig.25	Global Electronics Conveyor System Market, 2016 – 2026 (USD Million)
      Fig.26	Global Retail & Distribution Conveyor System Market, 2016 – 2026 (USD Million)
      Fig.27	Global Mining Conveyor System Market, 2016 – 2026 (USD Million)
      Fig.28	Global Others Conveyor System Market, 2016 – 2026 (USD Million)
      Fig.29	Global Conveyor System Market Share, by Region, 2020 & 2026 (USD Million)
      Fig.30	North America Conveyor System Market, 2016 – 2026 (USD Million)
      Fig.31	U.S. Conveyor System Market, 2016 – 2026 (USD Million)
      Fig.32	Canada Conveyor System Market, 2016 – 2026 (USD Million)
      Fig.33	Europe Conveyor System Market, 2016 – 2026 (USD Million)
      Fig.34	Germany Conveyor System Market, 2016 – 2026 (USD Million)
      Fig.35	France Conveyor System Market, 2016 – 2026 (USD Million)
      Fig.36	U.K. Conveyor System Market, 2016 – 2026 (USD Million)
      Fig.37	Italy Conveyor System Market, 2016 – 2026 (USD Million)
      Fig.38	Spain Conveyor System Market, 2016 – 2026 (USD Million)
      Fig.39	Rest of Europe Conveyor System Market, 2016 – 2026 (USD Million)
      Fig.40	Asia Pacific Conveyor System Market, 2016 – 2026 (USD Million)
      Fig.41	China Conveyor System Market, 2016 – 2026 (USD Million)
      Fig.42	Japan Conveyor System Market, 2016 – 2026 (USD Million)
      Fig.43	India Conveyor System Market, 2016 – 2026 (USD Million)
      Fig.44	South  Korea Conveyor System Market, 2016 – 2026 (USD Million)
      Fig.45	South-East Asia Conveyor System Market, 2016 – 2026 (USD Million)
      Fig.46	Rest of Asia Pacific Conveyor System Market, 2016 – 2026 (USD Million)
      Fig.47	Latin America Conveyor System Market, 2016 – 2026 (USD Million)
      Fig.48	Brazil Conveyor System Market, 2016 – 2026 (USD Million)
      Fig.49	Mexico Conveyor System Market, 2016 – 2026 (USD Million)
      Fig.50	Rest of Latin America Conveyor System Market, 2016 – 2026 (USD Million)
      Fig.51	The Middle-East and Africa Conveyor System Market, 2016 – 2026 (USD Million)
      Fig.52	GCC Countries Conveyor System Market, 2016 – 2026 (USD Million)
      Fig.53	South Africa Conveyor System Market, 2016 – 2026 (USD Million)
      Fig.54	Rest of Middle-East Africa Conveyor System Market, 2016 – 2026 (USD Million)
      Fig.55	Competitor Market Share – Revenue
      Fig.56	Daifuku Co., Ltd. Revenue and Growth Rate
      Fig.57	Daifuku Co., Ltd. Market Share
      Fig.58	Emerson Electric Co Revenue and Growth Rate
      Fig.59	Emerson Electric Co Market Share
      Fig.60	Interroll Group Revenue and Growth Rate
      Fig.61	Interroll Group Market Share
      Fig.62	Swisslog Holding AG Revenue and Growth Rate
      Fig.63	Swisslog Holding AG Market Share
      Fig.64	Siemens Revenue and Growth Rate
      Fig.65	Siemens Market Share
      Fig.66	Taikisha Ltd. Revenue and Growth Rate
      Fig.67	Taikisha Ltd. Market Share
      Fig.68	Dematic Revenue and Growth Rate
      Fig.69	Dematic Market Share
      Fig.70	Vanderlande Industries B.V. Revenue and Growth Rate
      Fig.71	Vanderlande Industries B.V. Market Share
      Fig.72	SSI Schafer AG Revenue and Growth Rate
      Fig.73	SSI Schafer AG Market Share
      Fig.74	TGW Logistics Group GmbH Revenue and Growth Rate
      Fig.75	TGW Logistics Group GmbH Market Share
      Fig.76	Honeywell Intelligrated Revenue and Growth Rate
      Fig.77	Honeywell Intelligrated Market Share
      Fig.78	Fives Revenue and Growth Rate
      Fig.79	Fives Market Share
      Fig.80	Continental Conveyor Revenue and Growth Rate
      Fig.81	Continental Conveyor Market Share
      Fig.82	Shuttleworth Revenue and Growth Rate
      Fig.83	Shuttleworth Market Share
      Fig.84	RUD Revenue and Growth Rate
      Fig.85	RUD Market Share
      Fig.86	Redler Revenue and Growth Rate
      Fig.87	Redler Market Share
      Fig.88	Nordstrong Revenue and Growth Rate
      Fig.89	Nordstrong Market Share
      Fig.90	Murata Machinery Revenue and Growth Rate
      Fig.91	Murata Machinery Market Share
      Fig.92	Mahindra Conveyor Systems Revenue and Growth Rate
      Fig.93	Mahindra Conveyor Systems Market Share
      Fig.94	FMC Technologies Revenue and Growth Rate
      Fig.95	FMC Technologies Market Share
      Fig.96	Flexlink Revenue and Growth Rate
      Fig.97	Flexlink Market Share
      Fig.98	Allied Conveyor Systems Revenue and Growth Rate
      Fig.99	Allied Conveyor Systems Market Share
      Fig.100	Durr AG Revenue and Growth Rate
      Fig.101	Durr AG Market Share
      Fig.102	Toyata Industries Revenue and Growth Rate
      Fig.103	Toyata Industries Market Share
      Fig.104	Bastian Solutions Inc. Revenue and Growth Rate
      Fig.105	Bastian Solutions Inc. Market Share
      Fig.106	Market Dynamics
      Fig.107	Global Conveyor System – Value Chain Analysis
      Fig.108	Key Mandates and Regulations
      Fig.109	Technology Roadmap and Timeline
      Fig.110	Market Attractiveness Analysis – By Type
      Fig.111	Market Attractiveness Analysis – By Operation
      Fig.112	Market Attractiveness Analysis – By End-Use Industry
      Fig.113	Market Attractiveness Analysis – By Region
      Fig.114	Conveyor System Industrial Chain Analysis
      Fig.115	Market Channels
      Fig.116	Marketing Channel Development Trend
      Fig.117	Growth in World Gross Product, 2008-2018
      

      List of Tables

      Table 1	Global Conveyor System Market, 2020 & 2026 (USD Million)
      Table 2	Global Conveyor System Market, by Type, 2016 – 2026 (USD Million)
      Table 3	Global Conveyor System Market, by Operation, 2016 – 2026 (USD Million)
      Table 4	Global Conveyor System Market, by End-Use Industry, 2016 – 2026 (USD Million)
      Table 5	Global Conveyor System Market, by Region, 2016 – 2026 (USD Million)
      Table 6	North America Conveyor System Market, by Country, 2016 – 2026 (USD Million)
      Table 7	North America Conveyor System Market, by Type, 2016 – 2026 (USD Million)
      Table 8	North America Conveyor System Market, by Operation, 2016 – 2026 (USD Million)
      Table 9	North America Conveyor System Market, by End-Use Industry, 2016 – 2026 (USD Million)
      Table 10 Europe Conveyor System Market, by Country, 2016 – 2026 (USD Million)
      Table 11 Europe Conveyor System Market, by Type, 2016 – 2026 (USD Million)
      Table 12 Europe Conveyor System Market, by Operation, 2016 – 2026 (USD Million)
      Table 13 Europe Conveyor System Market, by End-Use Industry, 2016 – 2026 (USD Million)
      Table 14 Asia Pacific Conveyor System Market, by Country, 2016 – 2026 (USD Million)
      Table 15 Asia Pacific Conveyor System Market, by Type, 2016 – 2026 (USD Million)
      Table 16 Asia Pacific Conveyor System Market, by Operation, 2016 – 2026 (USD Million)
      Table 17 Asia Pacific Conveyor System Market, by End-Use Industry, 2016 – 2026 (USD Million)
      Table 18 Latin America Conveyor System Market, by Country, 2016 – 2026 (USD Million)
      Table 19 Latin America Conveyor System Market, by Type, 2016 – 2026 (USD Million)
      Table 20 Latin America Conveyor System Market, by Operation, 2016 – 2026 (USD Million)
      Table 21 Latin America Conveyor System Market, by End-Use Industry, 2016 – 2026 (USD Million)
      Table 22 The Middle-East and Africa Conveyor System Market, by Country, 2016 – 2026 (USD Million)
      Table 23 The Middle-East and Africa Conveyor System Market, by Type, 2016 – 2026 (USD Million)
      Table 24 The Middle-East and Africa Conveyor System Market, by Operation, 2016 – 2026 (USD Million)
      Table 25 The Middle-East and Africa Conveyor System Market, by End-Use Industry, 2016 – 2026 (USD Million)
      Table 26 Global Conveyor System Market - Company Revenue Analysis, 2016 – 2020 (USD Million)
      Table 27 Global Conveyor System Market - Company Revenue Share Analysis, 2016 – 2020 (%)
      Table 28 Acquisitions and Mergers
      Table 29 Market Drivers – Impact Analysis
      Table 30 Market Restraints
      Table 31 Market Opportunities
      Table 32 Major Buyers of Conveyor System
      Table 33 Distributors/Traders of Conveyor System by Region
      

Industry Major Market Players

  • Daifuku Co. Ltd.
  • Emerson Electric Co
  • Interroll Group
  • Siemens, Swisslog Holding AG
  • Dematic
  • Taikisha Ltd.
  • SSI Schafer AG
  • Vanderlande Industries B.V.
  • Honeywell Intelligrated
  • Fives
  • TGW Logistics Group GmbH
  • Continental Conveyor
  • Shuttleworth
  • RUD
  • Redler
  • Nordstrong
  • Murata Machinery
  • Mahindra Conveyor Systems
  • FMC Technologies
  • Flexlink
  • Allied Conveyor Systems
  • Durr AG
  • Toyata Industries
  • Bastian Solutions Inc.