Search Market Research Report

Discover Our Latest Reports
Discover Our Featured Reports
Discover Top Selling Reports

Construction Non-Woven Fabrics Market Size, Share Global Analysis Report, 2020–2026

report img

Construction Non-Woven Fabrics Market By Type (Meltblown, Spunbonded, Spunlace, Needle Punch, and Others) and By Application (Reinforced Material, Roofing Waterproof Material, and Others): Global Industry Outlook, Market Size, Business Intelligence, Consumer Preferences, Statistical Surveys, Comprehensive Analysis, Historical Developments, Current Trends, and Forecast 2020–2026

Industry Insights

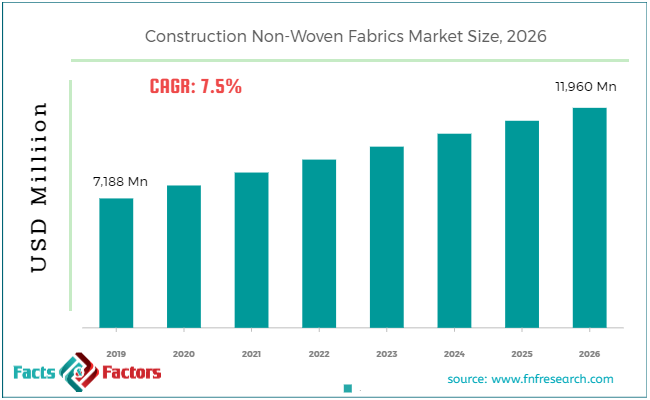
According to the report published by Facts & Factors, the global Construction Non-Woven Fabrics market size was worth around USD 7188 million in 2019 and is predicted to grow around USD 11,960 million by 2026 with a compound annual growth rate (CAGR) of roughly 7.5% between 2020 and 2026. The report analyzes the global Construction Non-Woven Fabrics market drivers, restraints/challenges, and the effect they have on the demands during the projection period. In addition, the report explores emerging opportunities in the Construction Non-Woven Fabrics market.

The construction non-woven fabrics market report analyzes and notifies the industry statistics at the global as well as regional and country levels in order to acquire a thorough perspective of the entire construction non-woven fabrics market. The historical and past insights are provided for FY 2016 to FY 2019 whereas projected trends are delivered for FY 2020 to FY 2026. The quantitative and numerical data is represented in terms of both volume (Kilotons) and value (USD Million) from FY 2016 – 2026.

Construction Non-Woven Fabrics Market

To know more about this report | Request Free Sample Copy

This specialized and expertise-oriented industry research report scrutinizes the technical and commercial business outlook of the construction non-woven fabrics industry. The report analyzes and declares the historical and current trends analysis of the construction non-woven fabrics industry and subsequently recommends the projected trends anticipated to be observed in the construction non-woven fabrics market during the upcoming years.

logoKey Insights from Primary Research

  • As per our primary analysis, the construction non-woven fabrics market is set to grow in upcoming years owing to a sturdy recovery in the developed region and high growth in developing countries in the construction industry.
  • It was established through primary research that the melt-blown type segment holds around 30% share of the market.
  • The reinforced material application segment holds the maximum share and is also anticipated to witness the highest growth rate.
  • Asia Pacific region held the leading share of the market and is projected to maintain the trend throughout the forecast period.

logoKey Recommendations from Analysts

  • As per our analysts, the global construction non-woven fabrics market revenue was around USD 7,188 million in 2019.
  • Growing at a CAGR of around 7.5%, the construction non-woven fabrics market provides numerous opportunities to grow in upcoming years owing to factors such as supportive government policies to boost construction and infrastructure activities around the world.
  • In the global construction non-woven fabrics market, the spun-bonded segment was valued for a major portion of the pie in 2019.
  • DuPontCompany is the leading player responsible for contributing the maximum volume share of the market.

The quantitative data is further underlined and reinforced by comprehensive qualitative data which comprises various across-the-board market dynamics. The rationales which directly or indirectly impact the construction non-woven fabrics industry are exemplified through parameters such as growth drivers, restraints, challenges, and opportunities among other impacting factors.

Throughout our research report, we have encompassed all the proven models and tools of industry analysis and extensively illustrated all the key business strategies and business models adopted in the construction non-woven fabrics industry. The report provides an all-inclusive and detailed competitive landscape prevalent in the construction non-woven fabrics market.

The report utilizes established industry analysis tools and models such as Porter’s Five Forces framework to analyze and recognize critical business strategies adopted by various stakeholders involved in the entire value chain of the construction non-woven fabrics industry. The construction non-woven fabrics market report additionally employs SWOT analysis and PESTLE analysis models for further in-depth analysis.

The report study further includes an in-depth analysis of industry players' market shares and provides an overview of leading players' market position in the construction non-woven fabrics sector. Key strategic developments in the construction non-woven fabrics market competitive landscape such as acquisitions & mergers, inaugurations of different products and services, partnerships & joint ventures, MoU agreements, VC & funding activities, R&D activities, and geographic expansion among other noteworthy activities by key players of the construction non-woven fabrics market are appropriately highlighted in the report.

Non-woven fabric offers excellent weather protection, especially in fluctuating weather conditions, and hence is generating the demand for non-woven fabric in the construction industry. Other application of non-woven construction fabric includes carpet backing, flooring, and sound insulation among others. An increase in renovation activities in the developed regions is also fueling product growth in an upward trajectory. Residential re-roofing continues to be the primary driver for the construction nonwoven fabric market.

In developed regions demanding building standards, energy-saving schemes, and changing weather patterns are also driving the need for breathable and impervious underlays for pitched roofs. All of these factors are contributing to market growth. However, a lack of awareness coupled with volatility in raw material prices is expected to hamper the market growth. Focus on infrastructural developments may open new opportunities in the global construction non-woven fabrics market.

logoReport Scope

Report Attribute

Details

Market Size in 2019

USD 7,188 Million

Projected Market Size in 2026

USD 11,960 Million

CAGR Growth Rate

7.5% CAGR

Base Year

2019

Forecast Years

2020-2026

Key Market Players

Kimberly-Clark, Ahlstrom, Fitesa, Low & Bonar, Avgol, Glatfelter, Georgia-Pacific, Freudenberg, Johns Manville, DuPont, AVINTIV, ,and others.

Key Segment

By, Type, Application, and Region

Major Regions Covered

North America, Europe, Asia Pacific, Latin America, and the Middle East &, Africa

Purchase Options

Request customized purchase options to meet your research needs. Explore purchase options

logoRegional Overview:

The construction non-woven fabrics market research report delivers an acute valuation and taxonomy of the construction non-woven fabrics industry by practically splitting the market on the basis of different types, applications, and regions. Through the analysis of the historical and projected trends, all the segments and sub-segments were evaluated through the bottom-up approach, and different market sizes have been projected for FY 2020 to FY 2026.

The regional segmentation of the construction non-woven fabrics industry includes the complete classification of all the major continents including North America, Latin America, Europe, Asia Pacific, and the Middle East & Africa. Further, country-wise data for the construction non-woven fabrics industry is provided for the leading economies of the world.

The construction non-woven fabrics market is segmented based on Type and Application.  On the basis of type segmentation, the market is classified into melt-blown, spun-bonded, spun lace, needle punch, and others. In terms of application segmentation, the market is bifurcated into reinforced material, roofing waterproof material, and others.

logoSome of the essential players operating in the construction non-woven fabrics market, but not restricted to include

  • Kimberly-Clark
  •  Ahlstrom
  •  Fitesa
  •  Low & Bonar
  •  Avgol
  •  Glatfelter
  •  Georgia-Pacific
  •  Freudenberg
  •  Johns Manville
  •  DuPont
  •  AVINTIV
  •  Lydall

The taxonomy of the construction non-woven fabrics industry by its scope and segmentation is as follows:

logo By Type Segmentation Analysis (Customizable)

  • Meltblown
  • Spunbonded
  • Spunlace
  • Needle Punch
  • Others

logo By Application Segmentation Analysis (Customizable)

  • Reinforced Material
  • Roofing Waterproof Material
  • Others

logo Regional Segmentation Analysis (Customizable)

  • North America
    • The U.S.
    • Canada
  • Europe
    • Germany
    • The UK
    • France
    • Spain
    • Italy
    • Rest of Europe
  • Asia Pacific
    • China
    • Japan
    • India
    • South Korea
    • Southeast Asia
    • Rest of Asia Pacific
  • Latin America
    • Brazil
    • Mexico
    • Rest of Latin America
  • Middle East & Africa
    • GCC
    • South Africa
    • Rest of the Middle East & Africa

Table of Content

  1. CHAPTER 1. Executive Summary
  2. CHAPTER 2. Construction Non-Woven Fabrics market – Type Analysis
    1. 2.1. Global Construction Non-Woven Fabrics Market – Type Overview
    2. 2.2. Global Construction Non-Woven Fabrics Market Share, by Type, 2019 & 2026 (USD Million)
    3. 2.3. Global Construction Non-Woven Fabrics Market share, by Type, 2019 & 2026 (Kilo Tons)
    4. 2.4. Meltblown
      1. 2.4.1. Global Meltblown Construction Non-Woven Fabrics Market, 2016-2019 (USD Million)
      2. 2.4.2. Global Meltblown Construction Non-Woven Fabrics Market, 2016-2019 (Kilo Tons)
    5. 2.5. Spunbonded
      1. 2.5.1. Global Spunbonded Construction Non-Woven Fabrics Market, 2016-2019 (USD Million)
      2. 2.5.2. Global Spunbonded Construction Non-Woven Fabrics Market, 2016-2019 (Kilo Tons)
    6. 2.6. Spunlace
      1. 2.6.1. Global Spunlace Construction Non-Woven Fabrics Market, 2016-2019 (USD Million)
      2. 2.6.2. Global Spunlace Construction Non-Woven Fabrics Market, 2016-2019 (Kilo Tons)
    7. 2.7. Needle Punch
      1. 2.7.1. Global Needle Punch Construction Non-Woven Fabrics Market, 2016-2019 (USD Million)
      2. 2.7.2. Global Needle Punch Construction Non-Woven Fabrics Market, 2016-2019 (Kilo Tons)
    8. 2.8. Others
      1. 2.8.1. Global Others Construction Non-Woven Fabrics Market, 2016-2019 (USD Million)
      2. 2.8.2. Global Others Construction Non-Woven Fabrics Market, 2016-2019 (Kilo Tons)
  3. CHAPTER 3. Construction Non-Woven Fabrics market – Application Analysis
    1. 3.1. Global Construction Non-Woven Fabrics Market – Application Overview
    2. 3.2. Global Construction Non-Woven Fabrics Market Share, by Application, 2019 & 2026 (USD Million)
    3. 3.3. Global Construction Non-Woven Fabrics Market share, by Application, 2019 & 2026 (Kilo Tons)
    4. 3.4. Reinforced Material
      1. 3.4.1. Global Reinforced Material Construction Non-Woven Fabrics Market, 2016-2019 (USD Million)
      2. 3.4.2. Global Reinforced Material Construction Non-Woven Fabrics Market, 2016-2019 (Kilo Tons)
    5. 3.5. Roofing Waterproof Material
      1. 3.5.1. Global Roofing Waterproof Material Construction Non-Woven Fabrics Market, 2016-2019 (USD Million)
      2. 3.5.2. Global Roofing Waterproof Material Construction Non-Woven Fabrics Market, 2016-2019 (Kilo Tons)
    6. 3.6. Others
      1. 3.6.1. Global Others Construction Non-Woven Fabrics Market, 2016-2019 (USD Million)
      2. 3.6.2. Global Others Construction Non-Woven Fabrics Market, 2016-2019 (Kilo Tons)
  4. CHAPTER 4. Construction Non-Woven Fabrics market – Regional Analysis
    1. 4.1. Global Construction Non-Woven Fabrics Market Regional Overview
    2. 4.2. Global Construction Non-Woven Fabrics Market Share, by Region, 2019 & 2026 (Value)
    3. 4.3. Global Construction Non-Woven Fabrics Market Share, by Region, 2019 & 2026 (Volume)
    4. 4.4. North America
      1. 4.4.1. North America Construction Non-Woven Fabrics Market size and forecast, 2016-2019
      2. 4.4.2. North America Construction Non-Woven Fabrics Market, by Country, 2019 - 2026 (USD Million)
      3. 4.4.3. North America Market size and forecast, 2016-2019 (Kilo Tons)
      4. 4.4.4. North America Construction Non-Woven Fabrics Market, by Country, 2019 - 2026 (Kilo Tons)
      5. 4.4.5. North America Construction Non-Woven Fabrics Market, by Type, 2016-2019
        1. 4.4.5.1. North America Construction Non-Woven Fabrics Market, by Type, 2016-2019 (USD Million)
        2. 4.4.5.2. North America Construction Non-Woven Fabrics Market, by Type, 2016-2019 (Kilo Tons)
      6. 4.4.6. North America Construction Non-Woven Fabrics Market, by Application, 2016-2019
        1. 4.4.6.1. North America Construction Non-Woven Fabrics Market, by Application, 2016-2019 (USD Million)
        2. 4.4.6.2. North America Construction Non-Woven Fabrics Market, by Application, 2016-2019 (Kilo Tons)
      7. 4.4.7. U.S.
        1. 4.4.7.1. U.S. Market size and forecast, 2016-2019 (USD Million)
        2. 4.4.7.2. U.S. Market size and forecast, 2016-2019 (Kilo Tons)
      8. 4.4.8. Canada
        1. 4.4.8.1. Canada Market size and forecast, 2016-2019 (USD Million)
        2. 4.4.8.2. Canada Market size and forecast, 2016-2019 (Kilo Tons)
    5. 4.5. Europe
      1. 4.5.1. Europe Construction Non-Woven Fabrics Market size and forecast, 2016-2019
      2. 4.5.2. Europe Construction Non-Woven Fabrics Market, by Country, 2019 - 2026 (USD Million)
      3. 4.5.3. Europe Market size and forecast, 2016-2019 (Kilo Tons)
      4. 4.5.4. Europe Construction Non-Woven Fabrics Market, by Country, 2019 - 2026 (Kilo Tons)
      5. 4.5.5. Europe Construction Non-Woven Fabrics Market, by Type, 2016-2019
        1. 4.5.5.1. Europe Construction Non-Woven Fabrics Market, by Type, 2016-2019 (USD Million)
        2. 4.5.5.2. Europe Construction Non-Woven Fabrics Market, by Type, 2016-2019 (Kilo Tons)
      6. 4.5.6. Europe Construction Non-Woven Fabrics Market, by Application, 2016-2019
        1. 4.5.6.1. Europe Construction Non-Woven Fabrics Market, by Application, 2016-2019 (USD Million)
        2. 4.5.6.2. Europe Construction Non-Woven Fabrics Market, by Application, 2016-2019 (Kilo Tons)
      7. 4.5.7. Germany
        1. 4.5.7.1. Germany Market size and forecast, 2016-2019 (USD Million)
        2. 4.5.7.2. Germany Market size and forecast, 2016-2019 (Kilo Tons)
      8. 4.5.8. France
        1. 4.5.8.1. France Market size and forecast, 2016-2019 (USD Million)
        2. 4.5.8.2. France Market size and forecast, 2016-2019 (Kilo Tons)
      9. 4.5.9. U.K.
        1. 4.5.9.1. U.K. Market size and forecast, 2016-2019 (USD Million)
        2. 4.5.9.2. U.K. Market size and forecast, 2016-2019 (Kilo Tons)
      10. 4.5.10. Italy
        1. 4.5.10.1. Italy Market size and forecast, 2016-2019 (USD Million)
        2. 4.5.10.2. Italy Market size and forecast, 2016-2019 (Kilo Tons)
      11. 4.5.11. Spain
        1. 4.5.11.1. Spain Market size and forecast, 2016-2019 (USD Million)
        2. 4.5.11.2. Spain Market size and forecast, 2016-2019 (Kilo Tons)
      12. 4.5.12. Rest of Europe
        1. 4.5.12.1. Rest of Europe Market size and forecast, 2016-2019 (USD Million)
        2. 4.5.12.2. Rest of Europe Market size and forecast, 2016-2019 (Kilo Tons)
    6. 4.6. Asia Pacific
      1. 4.6.1. Asia Pacific Construction Non-Woven Fabrics Market size and forecast, 2016-2019
      2. 4.6.2. Asia Pacific Construction Non-Woven Fabrics Market, by Country, 2019 - 2026 (USD Million)
      3. 4.6.3. Asia Pacific Market size and forecast, 2016-2019 (Kilo Tons)
      4. 4.6.4. Asia Pacific Construction Non-Woven Fabrics Market, by Country, 2019 - 2026 (Kilo Tons)
      5. 4.6.5. Asia Pacific Construction Non-Woven Fabrics Market, by Type, 2016-2019
        1. 4.6.5.1. Asia Pacific Construction Non-Woven Fabrics Market, by Type, 2016-2019 (USD Million)
        2. 4.6.5.2. Asia Pacific Construction Non-Woven Fabrics Market, by Type, 2016-2019 (Kilo Tons)
      6. 4.6.6. Asia Pacific Construction Non-Woven Fabrics Market, by Application, 2016-2019
        1. 4.6.6.1. Asia Pacific Construction Non-Woven Fabrics Market, by Application, 2016-2019 (USD Million)
        2. 4.6.6.2. Asia Pacific Construction Non-Woven Fabrics Market, by Application, 2016-2019 (Kilo Tons)
      7. 4.6.7. China
        1. 4.6.7.1. China Market size and forecast, 2016-2019 (USD Million)
        2. 4.6.7.2. China Market size and forecast, 2016-2019 (Kilo Tons)
      8. 4.6.8. Japan
        1. 4.6.8.1. Japan Market size and forecast, 2016-2019 (USD Million)
        2. 4.6.8.2. Japan Market size and forecast, 2016-2019 (Kilo Tons)
      9. 4.6.9. India
        1. 4.6.9.1. India Market size and forecast, 2016-2019 (USD Million)
        2. 4.6.9.2. India Market size and forecast, 2016-2019 (Kilo Tons)
      10. 4.6.10. South Korea
        1. 4.6.10.1. South Korea Market size and forecast, 2016-2019 (USD Million)
        2. 4.6.10.2. South Korea Market size and forecast, 2016-2019 (Kilo Tons)
      11. 4.6.11. South-East Asia
        1. 4.6.11.1. South-East Asia Market size and forecast, 2016-2019 (USD Million)
        2. 4.6.11.2. South-East Asia Market size and forecast, 2016-2019 (Kilo Tons)
      12. 4.6.12. Rest of Asia Pacific
        1. 4.6.12.1. Rest of Asia Pacific Market size and forecast, 2016-2019 (USD Million)
        2. 4.6.12.2. Rest of Asia Pacific Market size and forecast, 2016-2019 (Kilo Tons)
    7. 4.7. Latin America
      1. 4.7.1. Latin America Construction Non-Woven Fabrics Market size and forecast, 2016-2019
      2. 4.7.2. Latin America Construction Non-Woven Fabrics Market, by Country, 2019 - 2026 (USD Million)
      3. 4.7.3. Latin America Market size and forecast, 2016-2019 (Kilo Tons)
      4. 4.7.4. Latin America Construction Non-Woven Fabrics Market, by Country, 2019 - 2026 (Kilo Tons)
      5. 4.7.5. Latin America Construction Non-Woven Fabrics Market, by Type, 2016-2019
        1. 4.7.5.1. Latin America Construction Non-Woven Fabrics Market, by Type, 2016-2019 (USD Million)
        2. 4.7.5.2. Latin America Construction Non-Woven Fabrics Market, by Type, 2016-2019 (Kilo Tons)
      6. 4.7.6. Latin America Construction Non-Woven Fabrics Market, by Application, 2016-2019
        1. 4.7.6.1. Latin America Construction Non-Woven Fabrics Market, by Application, 2016-2019 (USD Million)
        2. 4.7.6.2. Latin America Construction Non-Woven Fabrics Market, by Application, 2016-2019 (Kilo Tons)
      7. 4.7.7. Brazil
        1. 4.7.7.1. Brazil Market size and forecast, 2016-2019 (USD Million)
        2. 4.7.7.2. Brazil Market size and forecast, 2016-2019 (Kilo Tons)
      8. 4.7.8. Mexico
        1. 4.7.8.1. Mexico Market size and forecast, 2016-2019 (USD Million)
        2. 4.7.8.2. Mexico Market size and forecast, 2016-2019 (Kilo Tons)
      9. 4.7.9. Rest of Latin America
        1. 4.7.9.1. Rest of Latin America Market size and forecast, 2016-2019 (USD Million)
        2. 4.7.9.2. Rest of Latin America Market size and forecast, 2016-2019 (Kilo Tons)
    8. 4.8. The Middle-East and Africa
      1. 4.8.1. The Middle-East and Africa Construction Non-Woven Fabrics Market size and forecast, 2016-2019
      2. 4.8.2. The Middle-East and Africa Construction Non-Woven Fabrics Market, by Country, 2019 - 2026 (USD Million)
      3. 4.8.3. The Middle-East and Africa Market size and forecast, 2016-2019 (Kilo Tons)
      4. 4.8.4. The Middle-East and Africa Construction Non-Woven Fabrics Market, by Country, 2019 - 2026 (Kilo Tons)
      5. 4.8.5. The Middle-East and Africa Construction Non-Woven Fabrics Market, by Type, 2016-2019
        1. 4.8.5.1. The Middle-East and Africa Construction Non-Woven Fabrics Market, by Type, 2016-2019 (USD Million)
        2. 4.8.5.2. The Middle-East and Africa Construction Non-Woven Fabrics Market, by Type, 2016-2019 (Kilo Tons)
      6. 4.8.6. The Middle-East and Africa Construction Non-Woven Fabrics Market, by Application, 2016-2019
        1. 4.8.6.1. The Middle-East and Africa Construction Non-Woven Fabrics Market, by Application, 2016-2019 (USD Million)
        2. 4.8.6.2. The Middle-East and Africa Construction Non-Woven Fabrics Market, by Application, 2016-2019 (Kilo Tons)
      7. 4.8.7. GCC Countries
        1. 4.8.7.1. GCC Countries Market size and forecast, 2016-2019 (USD Million)
        2. 4.8.7.2. GCC Countries Market size and forecast, 2016-2019 (Kilo Tons)
      8. 4.8.8. South Africa
        1. 4.8.8.1. South Africa Market size and forecast, 2016-2019 (USD Million)
        2. 4.8.8.2. South Africa Market size and forecast, 2016-2019 (Kilo Tons)
      9. 4.8.9. Rest of Middle-East Africa
        1. 4.8.9.1. Rest of Middle-East Africa Market size and forecast, 2016-2019 (USD Million)
        2. 4.8.9.2. Rest of Middle-East Africa Market size and forecast, 2016-2019 (Kilo Tons)
  5. CHAPTER 5. Construction Non-Woven Fabrics Production, Consumption, Export, Import by Regions
    1. 5.1. Global Construction Non-Woven Fabrics production and revenue, 2016-2026 (USD Million) (Kilo Tons)
    2. 5.2. Global Import and Export Analysis, by Region
  6. CHAPTER 6. Construction Non-Woven Fabrics market – Competitive Landscape
    1. 6.1. Competitor Market Share – Revenue
    2. 6.2. Market Concentration Rate Analysis, Top 3 and Top 5 Players
    3. 6.3. Competitor Market Share – Volume
    4. 6.4. Strategic Development
      1. 6.4.1. Acquisitions and Mergers
      2. 6.4.2. New Products
      3. 6.4.3. Research & Development Activities
  7. CHAPTER 7. Company Profiles
    1. 7.1. Kimberly-Clark
      1. 7.1.1. Company Overview
      2. 7.1.2. Kimberly-Clark Sales, Revenue, Price, and Gross Margin
      3. 7.1.3. Product portfolio
      4. 7.1.4. Recent initiatives
    2. 7.2. Ahlstrom
      1. 7.2.1. Company Overview
      2. 7.2.2. Ahlstrom Sales, Revenue, Price, and Gross Margin
      3. 7.2.3. Product portfolio
      4. 7.2.4. Recent initiatives
    3. 7.3. Fitesa
      1. 7.3.1. Company Overview
      2. 7.3.2. Fitesa Sales, Revenue, Price, and Gross Margin
      3. 7.3.3. Product portfolio
      4. 7.3.4. Recent initiatives
    4. 7.4. Low & Bonar
      1. 7.4.1. Company Overview
      2. 7.4.2. Low & Bonar Sales, Revenue, Price, and Gross Margin
      3. 7.4.3. Product portfolio
      4. 7.4.4. Recent initiatives
    5. 7.5. Avgol
      1. 7.5.1. Company Overview
      2. 7.5.2. Avgol Sales, Revenue, Price, and Gross Margin
      3. 7.5.3. Product portfolio
      4. 7.5.4. Recent initiatives
    6. 7.6. Glatfelter
      1. 7.6.1. Company Overview
      2. 7.6.2. Glatfelter Sales, Revenue, Price, and Gross Margin
      3. 7.6.3. Product portfolio
      4. 7.6.4. Recent initiatives
    7. 7.7. Georgia-Pacific
      1. 7.7.1. Company Overview
      2. 7.7.2. Georgia-Pacific Sales, Revenue, Price, and Gross Margin
      3. 7.7.3. Product portfolio
      4. 7.7.4. Recent initiatives
    8. 7.8. Freudenberg
      1. 7.8.1. Company Overview
      2. 7.8.2. Freudenberg Sales, Revenue, Price, and Gross Margin
      3. 7.8.3. Product portfolio
      4. 7.8.4. Recent initiatives
    9. 7.9. Johns Manville
      1. 7.9.1. Company Overview
      2. 7.9.2. Johns Manville Sales, Revenue, Price, and Gross Margin
      3. 7.9.3. Product portfolio
      4. 7.9.4. Recent initiatives
    10. 7.10. DuPont
      1. 7.10.1. Company Overview
      2. 7.10.2. DuPont Sales, Revenue, Price, and Gross Margin
      3. 7.10.3. Product portfolio
      4. 7.10.4. Recent initiatives
    11. 7.11. AVINTIV
      1. 7.11.1. Company Overview
      2. 7.11.2. AVINTIV Sales, Revenue, Price, and Gross Margin
      3. 7.11.3. Product portfolio
      4. 7.11.4. Recent initiatives
    12. 7.12. Lydall
      1. 7.12.1. Company Overview
      2. 7.12.2. Lydall Sales, Revenue, Price, and Gross Margin
      3. 7.12.3. Product portfolio
      4. 7.12.4. Recent initiatives
  8. CHAPTER 8. Construction Non-Woven Fabrics — Industry Analysis
    1. 8.1. Introduction and Taxonomy
    2. 8.2. Construction Non-Woven Fabrics Market – Key Trends
      1. 8.2.1. Market Drivers
      2. 8.2.2. Market Restraints
      3. 8.2.3. Market Opportunities
    3. 8.3. Value Chain Analysis
    4. 8.4. Key Mandates and Regulations
    5. 8.5. Technology Roadmap and Timeline
    6. 8.6. Construction Non-Woven Fabrics market – Attractiveness Analysis
      1. 8.6.1. By Type
      2. 8.6.2. By Application
      3. 8.6.3. By Region
  9. CHAPTER 9. Raw Material analysis
    1. 9.1. Construction Non-Woven Fabrics Key Raw Material Analysis
      1. 9.1.1. Key Raw Materials
      2. 9.1.2. Price Trend of Key Raw Materials
    2. 9.2. Key Suppliers of Raw Materials
    3. 9.3. Proportion of Manufacturing Cost Structure
      1. 9.3.1. Raw Materials
      2. 9.3.2. Labor Cost
    4. 9.4. Manufacturing Expenses Analysis of Construction Non-Woven Fabrics
  10. CHAPTER 10. Industrial Chain, Sourcing Strategy and Downstream Buyers
    1. 10.1. Construction Non-Woven Fabrics Industrial Chain Analysis
    2. 10.2. Upstream Raw Materials Sourcing
      1. 10.2.1. Risk Mitigation:
      2. 10.2.2. Supplier Relationships:
      3. 10.2.3. Business Processes:
      4. 10.2.4. Securing the Product:
    3. 10.3. Raw Materials Sources of Construction Non-Woven Fabrics Major Manufacturers in 2016
    4. 10.4. Downstream Buyers
    5. 10.5. Distributors/Traders List
  11. CHAPTER 11. Marketing Strategy Analysis, Distributors
    1. 11.1. Marketing Channel
    2. 11.2. Direct Marketing
    3. 11.3. Indirect Marketing
    4. 11.4. Marketing Channel Development Trend
    5. 11.5. Economic/Political Environmental Change
  12. CHAPTER 12. Report Conclusion
  13. CHAPTER 13. Research Approach & Methodology
    1. 13.1. Report Description
    2. 13.2. Research Scope
    3. 13.3. Research Methodology
      1. 13.3.1. Secondary Research
      2. 13.3.2. Primary Research
      3. 13.3.3. Models
        1. 13.3.3.1. Company Share Analysis Model
        2. 13.3.3.2. Revenue Based Modeling
        3. 13.3.3.3. Research Limitations

        List of Figures

        FIG. 1 Global Construction Non-Woven Fabrics Market, 2016-2019 (USD Million)
        FIG. 2 Global Construction Non-Woven Fabrics Market Share, by Type, 2019 & 2026 (USD Million)
        FIG. 3 Global Construction Non-Woven Fabrics Market share, by Type, 2019 & 2026 (Kilo Tons)
        FIG. 4 Global Meltblown Construction Non-Woven Fabrics Market, 2016-2019 (USD Million)
        FIG. 5 Global Meltblown Construction Non-Woven Fabrics  Market, 2016-2019 (Kilo Tons)
        FIG. 6 Global Spunbonded Construction Non-Woven Fabrics Market, 2016-2019 (USD Million)
        FIG. 7 Global Spunbonded Construction Non-Woven Fabrics  Market, 2016-2019 (Kilo Tons)
        FIG. 8 Global Spunlace Construction Non-Woven Fabrics Market, 2016-2019 (USD Million)
        FIG. 9 Global Spunlace Construction Non-Woven Fabrics  Market, 2016-2019 (Kilo Tons)
        FIG. 10 Global Needle Punch Construction Non-Woven Fabrics Market, 2016-2019 (USD Million)
        FIG. 11 Global Needle Punch Construction Non-Woven Fabrics  Market, 2016-2019 (Kilo Tons)
        FIG. 12 Global Others Construction Non-Woven Fabrics Market, 2016-2019 (USD Million)
        FIG. 13 Global Others Construction Non-Woven Fabrics  Market, 2016-2019 (Kilo Tons)
        FIG. 14 Global Construction Non-Woven Fabrics Market Share, by Application, 2019 & 2026 (USD Million)
        FIG. 15 Global Construction Non-Woven Fabrics Market share, by Application, 2019 & 2026 (Kilo Tons)
        FIG. 16 Global Reinforced Material Construction Non-Woven Fabrics Market, 2016-2019 (USD Million)
        FIG. 17 Global Reinforced Material Construction Non-Woven Fabrics  Market, 2016-2019 (Kilo Tons)
        FIG. 18 Global Roofing Waterproof Material Construction Non-Woven Fabrics Market, 2016-2019 (USD Million)
        FIG. 19 Global Roofing Waterproof Material Construction Non-Woven Fabrics  Market, 2016-2019 (Kilo Tons)
        FIG. 20 Global Others Construction Non-Woven Fabrics Market, 2016-2019 (USD Million)
        FIG. 21 Global Others Construction Non-Woven Fabrics  Market, 2016-2019 (Kilo Tons)
        FIG. 22 Global Construction Non-Woven Fabrics Market Share, by Region, 2019 & 2026
        FIG. 23 Global Construction Non-Woven Fabrics Market Share, by Region, 2019 & 2026
        FIG. 24 North America Construction Non-Woven Fabrics Market, 2016-2019
        FIG. 25 North America Construction Non-Woven Fabrics  Market, 2016-2019 (Kilo Tons)
        FIG. 26 U.S. Construction Non-Woven Fabrics Market, 2016-2019
        FIG. 27 U.S. Construction Non-Woven Fabrics  Market, 2016-2019 (Kilo Tons)
        FIG. 28 Canada Construction Non-Woven Fabrics Market, 2016-2019
        FIG. 29 Canada Construction Non-Woven Fabrics  Market, 2016-2019 (Kilo Tons)
        FIG. 30 Europe Construction Non-Woven Fabrics Market, 2016-2019
        FIG. 31 Europe Construction Non-Woven Fabrics  Market, 2016-2019 (Kilo Tons)
        FIG. 32 Germany Construction Non-Woven Fabrics Market, 2016-2019
        FIG. 33 Germany Construction Non-Woven Fabrics  Market, 2016-2019 (Kilo Tons)
        FIG. 34 France Construction Non-Woven Fabrics Market, 2016-2019
        FIG. 35 France Construction Non-Woven Fabrics  Market, 2016-2019 (Kilo Tons)
        FIG. 36 U.K. Construction Non-Woven Fabrics Market, 2016-2019
        FIG. 37 U.K. Construction Non-Woven Fabrics  Market, 2016-2019 (Kilo Tons)
        FIG. 38 Italy Construction Non-Woven Fabrics Market, 2016-2019
        FIG. 39 Italy Construction Non-Woven Fabrics  Market, 2016-2019 (Kilo Tons)
        FIG. 40 Spain Construction Non-Woven Fabrics Market, 2016-2019
        FIG. 41 Spain Construction Non-Woven Fabrics  Market, 2016-2019 (Kilo Tons)
        FIG. 42 Rest of Europe Construction Non-Woven Fabrics Market, 2016-2019
        FIG. 43 Rest of Europe Construction Non-Woven Fabrics  Market, 2016-2019 (Kilo Tons)
        FIG. 44 Asia Pacific Construction Non-Woven Fabrics Market, 2016-2019
        FIG. 45 Asia Pacific Construction Non-Woven Fabrics  Market, 2016-2019 (Kilo Tons)
        FIG. 46 China Construction Non-Woven Fabrics Market, 2016-2019
        FIG. 47 China Construction Non-Woven Fabrics  Market, 2016-2019 (Kilo Tons)
        FIG. 48 Japan Construction Non-Woven Fabrics Market, 2016-2019
        FIG. 49 Japan Construction Non-Woven Fabrics  Market, 2016-2019 (Kilo Tons)
        FIG. 50 India Construction Non-Woven Fabrics Market, 2016-2019
        FIG. 51 India Construction Non-Woven Fabrics  Market, 2016-2019 (Kilo Tons)
        FIG. 52 South  Korea Construction Non-Woven Fabrics Market, 2016-2019
        FIG. 53 South  Korea Construction Non-Woven Fabrics  Market, 2016-2019 (Kilo Tons)
        FIG. 54 South-East Asia Construction Non-Woven Fabrics Market, 2016-2019
        FIG. 55 South-East Asia Construction Non-Woven Fabrics  Market, 2016-2019 (Kilo Tons)
        FIG. 56 Rest of Asia Pacific Construction Non-Woven Fabrics Market, 2016-2019
        FIG. 57 Rest of Asia Pacific Construction Non-Woven Fabrics  Market, 2016-2019 (Kilo Tons)
        FIG. 58 Latin America Construction Non-Woven Fabrics Market, 2016-2019
        FIG. 59 Latin America Construction Non-Woven Fabrics  Market, 2016-2019 (Kilo Tons)
        FIG. 60 Brazil Construction Non-Woven Fabrics Market, 2016-2019
        FIG. 61 Brazil Construction Non-Woven Fabrics  Market, 2016-2019 (Kilo Tons)
        FIG. 62 Mexico Construction Non-Woven Fabrics Market, 2016-2019
        FIG. 63 Mexico Construction Non-Woven Fabrics  Market, 2016-2019 (Kilo Tons)
        FIG. 64 Rest of Latin America Construction Non-Woven Fabrics Market, 2016-2019
        FIG. 65 Rest of Latin America Construction Non-Woven Fabrics  Market, 2016-2019 (Kilo Tons)
        FIG. 66 The Middle-East and Africa Construction Non-Woven Fabrics Market, 2016-2019
        FIG. 67 The Middle-East and Africa Construction Non-Woven Fabrics  Market, 2016-2019 (Kilo Tons)
        FIG. 68 GCC Countries Construction Non-Woven Fabrics Market, 2016-2019
        FIG. 69 GCC Countries Construction Non-Woven Fabrics  Market, 2016-2019 (Kilo Tons)
        FIG. 70 South Africa Construction Non-Woven Fabrics Market, 2016-2019
        FIG. 71 South Africa Construction Non-Woven Fabrics  Market, 2016-2019 (Kilo Tons)
        FIG. 72 Rest of Middle-East Africa Construction Non-Woven Fabrics Market, 2016-2019
        FIG. 73 Rest of Middle-East Africa Construction Non-Woven Fabrics  Market, 2016-2019 (Kilo Tons)
        FIG. 74 Global Construction Non-Woven Fabrics production and revenue, 2016-2026 (USD Million) (Kilo Tons)
        FIG. 75 North America Construction Non-Woven Fabrics production and revenue, 2016-2026 (USD Million) (Kilo Tons)
        FIG. 76 Europe Construction Non-Woven Fabrics production and revenue, 2016-2026 (USD Million) (Kilo Tons)
        FIG. 77 Asia Pacific Construction Non-Woven Fabrics production and revenue, 2016-2026 (USD Million) (Kilo Tons)
        FIG. 78 Latin America Construction Non-Woven Fabrics production and revenue, 2016-2026 (USD Million) (Kilo Tons)
        FIG. 79 Middle East and Africa Construction Non-Woven Fabrics production and revenue, 2016-2026 (USD Million) (Kilo Tons)
        FIG. 80 Competitor Market Share – Revenue
        FIG. 81 Competitor Market Share – Volume
        FIG. 82 Kimberly-Clark Revenue and Growth Rate
        FIG. 83 Kimberly-Clark Market Share
        FIG. 84 Ahlstrom Revenue and Growth Rate
        FIG. 85 Ahlstrom Market Share
        FIG. 86 Fitesa Revenue and Growth Rate
        FIG. 87 Fitesa Market Share
        FIG. 88 Low & Bonar Revenue and Growth Rate
        FIG. 89 Low & Bonar Market Share
        FIG. 90 Avgol Revenue and Growth Rate
        FIG. 91 Avgol Market Share
        FIG. 92 Glatfelter Revenue and Growth Rate
        FIG. 93 Glatfelter Market Share
        FIG. 94 Georgia-Pacific Revenue and Growth Rate
        FIG. 95 Georgia-Pacific Market Share
        FIG. 96 Freudenberg Revenue and Growth Rate
        FIG. 97 Freudenberg Market Share
        FIG. 98 Johns Manville Revenue and Growth Rate
        FIG. 99 Johns Manville Market Share
        FIG. 100 DuPont Revenue and Growth Rate
        FIG. 101 DuPont Market Share
        FIG. 102 AVINTIV Revenue and Growth Rate
        FIG. 103 AVINTIV Market Share
        FIG. 104 Lydall Revenue and Growth Rate
        FIG. 105 Lydall Market Share
        FIG. 106 Market Dynamics
        FIG. 107 Global Construction Non-Woven Fabrics – Value Chain Analysis
        FIG. 108 Key Mandates and Regulations
        FIG. 109 Technology Roadmap and Timeline
        FIG. 110 Market Attractiveness Analysis – By Type
        FIG. 111 Market Attractiveness Analysis – By Application
        FIG. 112 Market Attractiveness Analysis – By Region
        FIG. 113 Manufacturing Cost Structure of Construction Non-Woven Fabrics
        FIG. 114 Construction Non-Woven Fabrics Industrial Chain Analysis
        FIG. 115 Market Channel
        FIG. 116 Marketing Channel Development Trend
        FIG. 117 Growth in World Gross Product, 2008-2018
        

        List of Tables

        TABLE 1 Global Construction Non-Woven Fabrics market, 2019 & 2026 (USD Million)
        TABLE 2 Global Construction Non-Woven Fabrics market, by Type, 2016-2019 (USD Million)
        TABLE 3 Global Construction Non-Woven Fabrics market, by Type, 2016-2019 (Kilo Tons)
        TABLE 4 Global Construction Non-Woven Fabrics market, by Application, 2016-2019 (USD Million)
        TABLE 5 Global Construction Non-Woven Fabrics market, by Application, 2016-2019 (Kilo Tons)
        TABLE 6 Global Construction Non-Woven Fabrics market, by region, 2016-2019 (USD Million)
        TABLE 7 Global Construction Non-Woven Fabrics market, by region, 2016-2019 (Kilo Tons)
        TABLE 8 North America Construction Non-Woven Fabrics Market, by Type, 2016-2019 (USD Million)
        TABLE 9 North America Construction Non-Woven Fabrics Market, by Type, 2016-2019 (Kilo Tons)
        TABLE 10 North America Construction Non-Woven Fabrics Market, by Application, 2016-2019 (USD Million)
        TABLE 11 North America Construction Non-Woven Fabrics Market, by Application, 2016-2019 (Kilo Tons)
        TABLE 12 Europe Construction Non-Woven Fabrics Market, by Type, 2016-2019 (USD Million)
        TABLE 13 Europe Construction Non-Woven Fabrics Market, by Type, 2016-2019 (Kilo Tons)
        TABLE 14 Europe Construction Non-Woven Fabrics Market, by Application, 2016-2019 (USD Million)
        TABLE 15 Europe Construction Non-Woven Fabrics Market, by Application, 2016-2019 (Kilo Tons)
        TABLE 16 Asia Pacific Construction Non-Woven Fabrics Market, by Type, 2016-2019 (USD Million)
        TABLE 17 Asia Pacific Construction Non-Woven Fabrics Market, by Type, 2016-2019 (Kilo Tons)
        TABLE 18 Asia Pacific Construction Non-Woven Fabrics Market, by Application, 2016-2019 (USD Million)
        TABLE 19 Asia Pacific Construction Non-Woven Fabrics Market, by Application, 2016-2019 (Kilo Tons)
        TABLE 20 Latin America Construction Non-Woven Fabrics Market, by Type, 2016-2019 (USD Million)
        TABLE 21 Latin America Construction Non-Woven Fabrics Market, by Type, 2016-2019 (Kilo Tons)
        TABLE 22 Latin America Construction Non-Woven Fabrics Market, by Application, 2016-2019 (USD Million)
        TABLE 23 Latin America Construction Non-Woven Fabrics Market, by Application, 2016-2019 (Kilo Tons)
        TABLE 24 The Middle-East and Africa Construction Non-Woven Fabrics Market, by Type, 2016-2019 (USD Million)
        TABLE 25 The Middle-East and Africa Construction Non-Woven Fabrics Market, by Type, 2016-2019 (Kilo Tons)
        TABLE 26 The Middle-East and Africa Construction Non-Woven Fabrics Market, by Application, 2016-2019 (USD Million)
        TABLE 27 The Middle-East and Africa Construction Non-Woven Fabrics Market, by Application, 2016-2019 (Kilo Tons)
        TABLE 28 North America Construction Non-Woven Fabrics Production, Consumption, Export, Import, 2016-2026
        TABLE 29 Europe Construction Non-Woven Fabrics Production, Consumption, Export, Import, 2016-2026
        TABLE 30 Asia Pacific Construction Non-Woven Fabrics Production, Consumption, Export, Import, 2016-2026
        TABLE 31 Latin America Construction Non-Woven Fabrics Production, Consumption, Export, Import, 2016-2026
        TABLE 32 Middle East & Africa Construction Non-Woven Fabrics Production, Consumption, Export, Import, 2016-2026
        TABLE 33 Global Construction Non-Woven Fabrics Market - Company Revenue Analysis 2016-2026 (USD Million)
        TABLE 34 Global Construction Non-Woven Fabrics Market - Company Revenue Share Analysis 2016-2026(%)
        TABLE 35 Global Construction Non-Woven Fabrics Market - Company Volume Analysis 2016-2026 (Kilo Tons)
        TABLE 36 Global Construction Non-Woven Fabrics Market - Company Volume Share Analysis 2016-2026(%)
        TABLE 37 Acquisitions and Mergers
        TABLE 38 New Product/Service Launch
        TABLE 39 Research & Development Activities
        TABLE 40 Market Drivers
        TABLE 41 Market Restraints
        TABLE 42 Market Opportunities
        TABLE 43 Production Base and Market Concentration Rate of Raw Material
        TABLE 44 Key Suppliers of Raw Materials
        TABLE 45 Raw Materials Sources of Construction Non-Woven Fabrics Major Manufacturers in 2016
        TABLE 46 Major Buyers of Construction Non-Woven Fabrics
        TABLE 47 Distributors/Traders of Construction Non-Woven Fabrics by Region

Industry Major Market Players

  • Kimberly-Clark
  •  Ahlstrom
  •  Fitesa
  •  Low & Bonar
  •  Avgol
  •  Glatfelter
  •  Georgia-Pacific
  •  Freudenberg
  •  Johns Manville
  •  DuPont
  •  AVINTIV
  •  Lydall