Search Market Research Report

Discover Our Latest Reports
Discover Our Featured Reports
Discover Top Selling Reports

Construction Chemicals Market Size, Share Global Analysis Report, 2020–2026

report img

Construction Chemicals Market By Product (Concrete Admixture, Concrete adhesives and Concrete sealants) and By End-user (Non-residential & infrastructure and Residential): Global Industry Outlook, Market Size, Business Intelligence, Consumer Preferences, Statistical Surveys, Comprehensive Analysis, Historical Developments, Current Trends, and Forecast 2020–2026

Industry Insights

The Construction Chemicals market report analyzes and notifies the industry statistics at the global as well as regional and country levels in order to acquire a thorough perspective of the entire construction Chemicals market. The historical and past insights are provided for FY 2016 to FY 2019 whereas projected trends are delivered for FY 2020 to FY 2026. The quantitative and numerical data is represented in terms of value USD Billion from FY 2016 – 2026.

This specialized and expertise-oriented industry research report scrutinizes the technical and commercial business outlook of the Construction Chemicals industry. The report analyzes and declares the historical and current trends analysis of the Construction Chemicals industry and subsequently recommends the projected trends anticipated to be observed in the Construction Chemicals market during the upcoming years.

Construction Chemicals Market Size

To know more about this report | Request Free Sample Copy


logoKey Insights from Primary Research

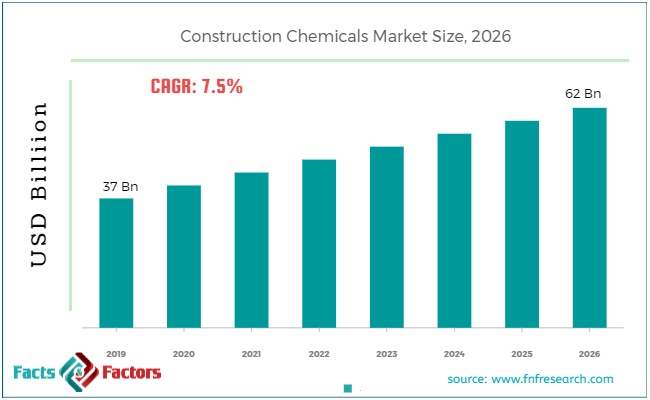
  • As per our primary respondents, the Construction Chemicals market is set to grow annually at a rate of around 7.5%.
  • It was established through primary research that the Construction Chemicals market was valued at around USD 35 billion in 2019.
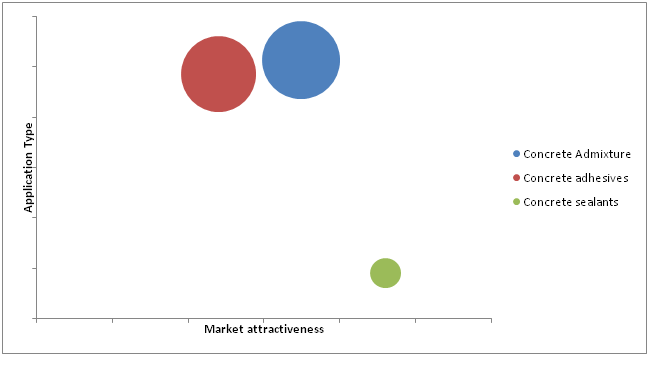
  • After secondary research, we performed face to face interviews to validate our data. The insights interviewee’s declared that Concrete Admixture is the most used product for the global Construction Chemicals market.
  • On the basis of the end-user, the residential segment dominated the global Construction Chemicals market in 2019. It accounted for around a 62% share of the total market in 2019.
  • The Concrete Admixture segment, on the basis of product segmentation, was the leading revenue-generating category accounting for around 39% share, in 2019.

logoKey Recommendations from Analysts

  • Based on the exhaustive secondary research done by our team, the Concrete Admixture is anticipated to become the most demanding product in the upcoming years, owing to the growing demand for Construction Chemicals from the construction industry for various end-use applications.
  • As per our analysts, APAC recorded the highest market share of more than 40% by 2026, and the market is expected to bolster in this region, resulting in creating lucrative opportunities for new players.
  • Growing at a CAGR around 7.5%, the Construction Chemicals market provides numerous opportunities for all of the involved stakeholders across the entire value chain.
  • Our analysts have identified Concrete Admixture and Residentialcategories as the leading investment pockets for the Construction Chemicals market in terms of product and end-user segmentation respectively.
  • Our analysts recommend the emerging players to focus on residential segment owing to the substantial growth of the construction industry, especially in APAC and Middle-eastern regions and increased adaptation of the residential building.

logoMarket Attractiveness – By Product

Construction Chemicals Market

To know more about this report | Request Free Sample Copy


The quantitative data is further underlined and reinforced by comprehensive qualitative data which comprises various across-the-board market dynamics. The rationales which directly or indirectly impact the Construction Chemicals industry are exemplified through parameters such as growth drivers, restraints, challenges, and opportunities among other impacting factors.

Throughout our research report, we have encompassed all the proven models and tools of industry analysis and extensively illustrated all the key business strategies and business models adopted in the Construction Chemicals industry. The report provides an all-inclusive and detailed competitive landscape prevalent in the Construction Chemicals market.

The report utilizes established industry analysis tools and models such as Porter’s Five Forces framework to analyze and recognize critical business strategies adopted by various stakeholders involved in the entire value chain of the Construction Chemicals industry. The Construction Chemicals market report additionally employs SWOT analysis and PESTLE analysis models for further in-depth analysis.

The report study further includes an in-depth analysis of industry players' market shares and provides an overview of leading players' market positions in the Construction Chemicals sector. Key strategic developments in the Construction Chemicals market competitive landscape such as acquisitions & mergers, inaugurations of different products and services, partnerships & joint ventures, MoU agreements, VC & funding activities, R&D activities, and geographic expansion among other noteworthy activities by key players of the Construction Chemicals market are appropriately highlighted in the report.

The global Construction Chemicals market is estimated to be valued at USD 35 billion by 2019 and is projected to register a CAGR of 7.5% throughout the forecast period. The market for chemical building is anticipated to bolster over the forecast period. Increased construction work in the Asia-Pacific region, enhanced adoption of new technology, and advanced building processes are some of the variables that drive the market growth studied. Increased environmental legislation on VOC emissions continues to be a barrier to market growth.

The building chemical industry is powered solely by multinational construction and infrastructure development operations worldwide. The fast-growing Asia-Pacific construction industry, led by China and India, will have a significant impact on product demand during the forecast period. The growing demand for earthquake-resistant structures around the Asia Pacific Fire Ring and the East Coast of North and Latin America, along with Europe and the Asia Pacific Alpine Belt, is increasing the market demand for more weather-proof structures and installations.

The Construction Chemicals market research report delivers an acutevaluationand taxonomy of the Construction Chemicals industry by practically splitting the market on the basis of different types, applications, and regions. Through the analysis of the historical and projected trends, all the segments and sub-segments were evaluated through the bottom-up approach, and different market sizes have been projected for FY 2020 to FY 2026. The regional segmentation of the Construction Chemicals industry includes the complete classification of all the major continents including North America, Latin America, Europe, Asia Pacific, and the Middle East & Africa. Further, country-wise data for the Construction Chemicals industry is provided for the leading economies of the world.

The Construction Chemicals market is segmented based on Product and End-User.  On the basis of product segmentation, the market is classified into Concrete Admixture, Concrete adhesives, and Concrete sealants. In terms of End-User segmentation, the market is bifurcated into Non-residential & infrastructure and Residential.

logoReport Scope

Report Attribute

Details

Market Size in 2019

USD 37 Billion

Projected Market Size in 2026

USD 62 Billion

CAGR Growth Rate

7.5% CAGR

Base Year

2019

Forecast Years

2020-2026

Key Market Players

3M, Arkema Group, Ashland, BASF SE, Bolton Group, Cemetaid (N.S.W.) Pty Ltd, Chryso SAS, CICO Group, Conmix Ltd, DowDuPont, Fosroc Inc., Franklin International, GCP Applied Technologies Inc., Henkel AG & Co. KGaA, LafargeHolcim, MAPEI SpA, MUHU Construction Materials Co. Ltd, Nouryon, RPM International Inc., Sika AG, Thermax Global , and others.

Key Segment

By Type, Application, and Region

Major Regions Covered

North America, Europe, Asia Pacific, Latin America, and the Middle East &, Africa

Purchase Options

Request customized purchase options to meet your research needs. Explore purchase options

logoSome of the essential players operating in the construction chemicals market, but not restricted to include

  • 3M
  • Arkema Group
  • Ashland
  • BASF SE
  • Bolton Group
  • Cemetaid (N.S.W.) Pty Ltd
  • Chryso SAS
  • CICO Group
  • Conmix Ltd
  • DowDuPont
  • Fosroc Inc.
  • Franklin International
  • GCP Applied Technologies Inc.
  • Henkel AG & Co. KGaA
  • LafargeHolcim
  • MAPEI SpA
  • MUHU Construction Materials Co. Ltd
  • Nouryon
  • RPM International Inc.
  • Sika AG
  • Thermax Global

The taxonomy of the Construction Chemicals Market by its scope and segmentation is as follows:

logoGlobal Construction chemicals Market: By Type Segmentation Analysis

  • Concrete Admixture
  • Concrete adhesives
  • Concrete sealants

logoGlobal Construction chemicals Market: By Application Segmentation Analysis

  • Non-residential & Infrastructure
  • Residential

logoGlobal Construction chemicals Market: Regional Segmentation Analysis

  • North America
    • The U.S.
    • Canada
  • Europe
    • Germany
    • The UK
    • France
    • Spain
    • Italy
    • Rest of Europe
  • Asia Pacific
    • China
    • Japan
    • India
    • South Korea
    • Southeast Asia
    • Rest of Asia Pacific
  • Latin America
    • Brazil
    • Mexico
    • Rest of Latin America
  • Middle East & Africa
    • GCC
    • South Africa
    • Rest of the Middle East & Africa

Table of Content

  1. CHAPTER 1. Executive Summary
  2. CHAPTER 2. Construction Chemicals market – Product Analysis
    1. 2.1. Global Construction Chemicals Market – Product Overview
    2. 2.2. Global Construction Chemicals Market Share, by Product, 2019&2026 (USD Billion)
    3. 2.3. Concrete Admixture
      1. 2.3.1. Global Concrete Admixture Construction Chemicals Market, 2016-2026 (USD Billion)
    4. 2.4. Concrete adhesives
      1. 2.4.1. Global Concrete adhesives Construction Chemicals Market, 2016-2026 (USD Billion)
    5. 2.5. Concrete sealants
      1. 2.5.1. Global Concrete sealants Construction Chemicals Market, 2016-2026 (USD Billion)
  3. CHAPTER 3. Construction Chemicals market – End User Analysis
    1. 3.1. Global Construction Chemicals Market – End User Overview
    2. 3.2. Global Construction Chemicals Market Share, by End User, 2019&2026 (USD Billion)
    3. 3.3. Non-residential & infrastructure
      1. 3.3.1. Global Non-residential & infrastructure Construction Chemicals Market, 2016-2026 (USD Billion)
    4. 3.4. Residential
      1. 3.4.1. Global Residential Construction Chemicals Market, 2016-2026 (USD Billion)
  4. CHAPTER 4. Construction Chemicals market – Regional Analysis
    1. 4.1. Global Construction Chemicals Market Regional Overview
    2. 4.2. Global Construction Chemicals Market Share, by Region, 2019&2026 (Value)
    3. 4.3. North America
      1. 4.3.1. North America Construction Chemicals Market size and forecast, 2016-2026
      2. 4.3.2. North America Construction Chemicals Market, by Country, 2019&2026 (USD Billion)
      3. 4.3.3. North America Construction Chemicals Market, by Product, 2016-2026
        1. 4.3.3.1. North America Construction Chemicals Market, by Product, 2016-2026 (USD Billion)
      4. 4.3.4. North America Construction Chemicals Market, by End User, 2016-2026
        1. 4.3.4.1. North America Construction Chemicals Market, by End User, 2016-2026 (USD Billion)
      5. 4.3.5. U.S.
        1. 4.3.5.1. U.S. Market size and forecast, 2016-2026 (USD Billion)
      6. 4.3.6. Canada
        1. 4.3.6.1. Canada Market size and forecast, 2016-2026 (USD Billion)
    4. 4.4. Europe
      1. 4.4.1. Europe Construction Chemicals Market size and forecast, 2016-2026
      2. 4.4.2. Europe Construction Chemicals Market, by Country, 2019&2026 (USD Billion)
      3. 4.4.3. Europe Construction Chemicals Market, by Product, 2016-2026
        1. 4.4.3.1. Europe Construction Chemicals Market, by Product, 2016-2026 (USD Billion)
      4. 4.4.4. Europe Construction Chemicals Market, by End User, 2016-2026
        1. 4.4.4.1. Europe Construction Chemicals Market, by End User, 2016-2026 (USD Billion)
      5. 4.4.5. Germany
        1. 4.4.5.1. Germany Market size and forecast, 2016-2026 (USD Billion)
      6. 4.4.6. France
        1. 4.4.6.1. France Market size and forecast, 2016-2026 (USD Billion)
      7. 4.4.7. U.K.
        1. 4.4.7.1. U.K. Market size and forecast, 2016-2026 (USD Billion)
      8. 4.4.8. Italy
        1. 4.4.8.1. Italy Market size and forecast, 2016-2026 (USD Billion)
      9. 4.4.9. Spain
        1. 4.4.9.1. Spain Market size and forecast, 2016-2026 (USD Billion)
      10. 4.4.10. Rest of Europe
        1. 4.4.10.1. Rest of Europe Market size and forecast, 2016-2026 (USD Billion)
    5. 4.5. Asia Pacific
      1. 4.5.1. Asia Pacific Construction Chemicals Market size and forecast, 2016-2026
      2. 4.5.2. Asia Pacific Construction Chemicals Market, by Country, 2019&2026 (USD Billion)
      3. 4.5.3. Asia Pacific Construction Chemicals Market, by Product, 2016-2026
        1. 4.5.3.1. Asia Pacific Construction Chemicals Market, by Product, 2016-2026 (USD Billion)
      4. 4.5.4. Asia Pacific Construction Chemicals Market, by End User, 2016-2026
        1. 4.5.4.1. Asia Pacific Construction Chemicals Market, by End User, 2016-2026 (USD Billion)
      5. 4.5.5. China
        1. 4.5.5.1. China Market size and forecast, 2016-2026 (USD Billion)
      6. 4.5.6. Japan
        1. 4.5.6.1. Japan Market size and forecast, 2016-2026 (USD Billion)
      7. 4.5.7. India
        1. 4.5.7.1. India Market size and forecast, 2016-2026 (USD Billion)
      8. 4.5.8. South Korea
        1. 4.5.8.1. South Korea Market size and forecast, 2016-2026 (USD Billion)
      9. 4.5.9. South-East Asia
        1. 4.5.9.1. South-East Asia Market size and forecast, 2016-2026 (USD Billion)
      10. 4.5.10. Rest of Asia Pacific
        1. 4.5.10.1. Rest of Asia Pacific Market size and forecast, 2016-2026 (USD Billion)
    6. 4.6. Latin America
      1. 4.6.1. Latin America Construction Chemicals Market size and forecast, 2016-2026
      2. 4.6.2. Latin America Construction Chemicals Market, by Country, 2019&2026 (USD Billion)
      3. 4.6.3. Latin America Construction Chemicals Market, by Product, 2016-2026
        1. 4.6.3.1. Latin America Construction Chemicals Market, by Product, 2016-2026 (USD Billion)
      4. 4.6.4. Latin America Construction Chemicals Market, by End User, 2016-2026
        1. 4.6.4.1. Latin America Construction Chemicals Market, by End User, 2016-2026 (USD Billion)
      5. 4.6.5. Brazil
        1. 4.6.5.1. Brazil Market size and forecast, 2016-2026 (USD Billion)
      6. 4.6.6. Mexico
        1. 4.6.6.1. Mexico Market size and forecast, 2016-2026 (USD Billion)
      7. 4.6.7. Rest of Latin America
        1. 4.6.7.1. Rest of Latin America Market size and forecast, 2016-2026 (USD Billion)
    7. 4.7. The Middle-East and Africa
      1. 4.7.1. The Middle-East and Africa Construction Chemicals Market size and forecast, 2016-2026
      2. 4.7.2. The Middle-East and Africa Construction Chemicals Market, by Country, 2019&2026 (USD Billion)
      3. 4.7.3. The Middle-East and Africa Construction Chemicals Market, by Product, 2016-2026
        1. 4.7.3.1. The Middle-East and Africa Construction Chemicals Market, by Product, 2016-2026 (USD Billion)
      4. 4.7.4. The Middle-East and Africa Construction Chemicals Market, by End User, 2016-2026
        1. 4.7.4.1. The Middle-East and Africa Construction Chemicals Market, by End User, 2016-2026 (USD Billion)
      5. 4.7.5. GCC Countries
        1. 4.7.5.1. GCC Countries Market size and forecast, 2016-2026 (USD Billion)
      6. 4.7.6. South Africa
        1. 4.7.6.1. South Africa Market size and forecast, 2016-2026 (USD Billion)
      7. 4.7.7. Rest of Middle-East Africa
        1. 4.7.7.1. Rest of Middle-East Africa Market size and forecast, 2016-2026 (USD Billion)
  5. CHAPTER 5. Construction Chemicals market – Competitive Landscape
    1. 5.1. Competitor Market Share – Revenue
    2. 5.2. Market Concentration Rate Analysis, Top 3 and Top 5 Players
    3. 5.3. Strategic Development
      1. 5.3.1. Acquisitions and Mergers
      2. 5.3.2. New Products
      3. 5.3.3. Research & Development Activities
  6. CHAPTER 6. Company Profiles
    1. 6.1. 3M
      1. 6.1.1. Company Overview
      2. 6.1.2. 3M Revenue and Gross Margin
      3. 6.1.3. Product portfolio
      4. 6.1.4. Recent initiatives
    2. 6.2. Arkema Group
      1. 6.2.1. Company Overview
      2. 6.2.2. Arkema Group Revenue and Gross Margin
      3. 6.2.3. Product portfolio
      4. 6.2.4. Recent initiatives
    3. 6.3. Ashland
      1. 6.3.1. Company Overview
      2. 6.3.2. Ashland Revenue and Gross Margin
      3. 6.3.3. Product portfolio
      4. 6.3.4. Recent initiatives
    4. 6.4. BASF SE
      1. 6.4.1. Company Overview
      2. 6.4.2. BASF SE Revenue and Gross Margin
      3. 6.4.3. Product portfolio
      4. 6.4.4. Recent initiatives
    5. 6.5. Bolton Group
      1. 6.5.1. Company Overview
      2. 6.5.2. Bolton Group Revenue and Gross Margin
      3. 6.5.3. Product portfolio
      4. 6.5.4. Recent initiatives
    6. 6.6. Cemetaid (N.S.W.) Pty Ltd
      1. 6.6.1. Company Overview
      2. 6.6.2. Cemetaid (N.S.W.) Pty Ltd Revenue and Gross Margin
      3. 6.6.3. Product portfolio
      4. 6.6.4. Recent initiatives
    7. 6.7. Chryso SAS
      1. 6.7.1. Company Overview
      2. 6.7.2. Chryso SAS Revenue and Gross Margin
      3. 6.7.3. Product portfolio
      4. 6.7.4. Recent initiatives
    8. 6.8. CICO Group
      1. 6.8.1. Company Overview
      2. 6.8.2. CICO Group Revenue and Gross Margin
      3. 6.8.3. Product portfolio
      4. 6.8.4. Recent initiatives
    9. 6.9. Conmix Ltd
      1. 6.9.1. Company Overview
      2. 6.9.2. Conmix Ltd Revenue and Gross Margin
      3. 6.9.3. Product portfolio
      4. 6.9.4. Recent initiatives
    10. 6.10. DowDuPont
      1. 6.10.1. Company Overview
      2. 6.10.2. DowDuPont Revenue and Gross Margin
      3. 6.10.3. Product portfolio
      4. 6.10.4. Recent initiatives
    11. 6.11. Fosroc Inc.
      1. 6.11.1. Company Overview
      2. 6.11.2. Fosroc Inc. Revenue and Gross Margin
      3. 6.11.3. Product portfolio
      4. 6.11.4. Recent initiatives
    12. 6.12. Franklin International
      1. 6.12.1. Company Overview
      2. 6.12.2. Franklin International Revenue and Gross Margin
      3. 6.12.3. Product portfolio
      4. 6.12.4. Recent initiatives
    13. 6.13. GCP Applied Technologies Inc.
      1. 6.13.1. Company Overview
      2. 6.13.2. GCP Applied Technologies Inc. Revenue and Gross Margin
      3. 6.13.3. Product portfolio
      4. 6.13.4. Recent initiatives
    14. 6.14. Henkel AG & Co. KGaA
      1. 6.14.1. Company Overview
      2. 6.14.2. Henkel AG & Co. KGaA Revenue and Gross Margin
      3. 6.14.3. Product portfolio
      4. 6.14.4. Recent initiatives
    15. 6.15. LafargeHolcim
      1. 6.15.1. Company Overview
      2. 6.15.2. LafargeHolcim Revenue and Gross Margin
      3. 6.15.3. Product portfolio
      4. 6.15.4. Recent initiatives
    16. 6.16. MAPEI SpA
      1. 6.16.1. Company Overview
      2. 6.16.2. MAPEI SpA Revenue and Gross Margin
      3. 6.16.3. Product portfolio
      4. 6.16.4. Recent initiatives
    17. 6.17. MUHU Construction Materials Co. Ltd
      1. 6.17.1. Company Overview
      2. 6.17.2. MUHU Construction Materials Co. Ltd Revenue and Gross Margin
      3. 6.17.3. Product portfolio
      4. 6.17.4. Recent initiatives
    18. 6.18. Nouryon
      1. 6.18.1. Company Overview
      2. 6.18.2. Nouryon Revenue and Gross Margin
      3. 6.18.3. Product portfolio
      4. 6.18.4. Recent initiatives
    19. 6.19. RPM International Inc.
      1. 6.19.1. Company Overview
      2. 6.19.2. RPM International Inc. Revenue and Gross Margin
      3. 6.19.3. Product portfolio
      4. 6.19.4. Recent initiatives
    20. 6.20. Sika AG
      1. 6.20.1. Company Overview
      2. 6.20.2. Sika AG Revenue and Gross Margin
      3. 6.20.3. Product portfolio
      4. 6.20.4. Recent initiatives
    21. 6.21. Thermax Global
      1. 6.21.1. Company Overview
      2. 6.21.2. Thermax Global Revenue and Gross Margin
      3. 6.21.3. Product portfolio
      4. 6.21.4. Recent initiatives
  7. CHAPTER 7. Construction Chemicals — Industry Analysis
    1. 7.1. Construction Chemicals Market – Key Trends
      1. 7.1.1. Market Drivers
      2. 7.1.2. Market Restraints
      3. 7.1.3. Market Opportunities
    2. 7.2. Value Chain Analysis
    3. 7.3. Technology Roadmap and Timeline
    4. 7.4. Construction Chemicals Market – Attractiveness Analysis
      1. 7.4.1. By Product
      2. 7.4.2. By End User
      3. 7.4.3. By Region
  8. CHAPTER 8. Marketing Strategy Analysis, Distributors
    1. 8.1. Marketing Channel
    2. 8.2. Direct Marketing
    3. 8.3. Indirect Marketing
    4. 8.4. Marketing Channel Development Trend
    5. 8.5. Economic/Political Environmental Change
  9. CHAPTER 9. Report Conclusion
  10. CHAPTER 10. Research Approach & Methodology
    1. 10.1. Report Description
    2. 10.2. Research Scope
    3. 10.3. Research Methodology
      1. 10.3.1. Secondary Research
      2. 10.3.2. Primary Research
      3. 10.3.3. Models
        1. 10.3.3.1. Company Share Analysis Model
        2. 10.3.3.2. Revenue Based Modeling
        3. 10.3.3.3. Research Limitations

        List of Figures

        FIG. 1 Global Construction Chemicals Market, 2016-2026 (USD Billion)
        FIG. 2 Global Construction Chemicals Market Share, by Product, 2019&2026 (USD Billion)
        FIG. 3 Global Concrete Admixture Construction Chemicals Market, 2016-2026 (USD Billion)
        FIG. 4 Global Concrete adhesives Construction Chemicals Market, 2016-2026 (USD Billion)
        FIG. 5 Global Concrete sealants Construction Chemicals Market, 2016-2026 (USD Billion)
        FIG. 6 Global Construction Chemicals Market Share, by End User, 2019&2026 (USD Billion)
        FIG. 7 Global Non-residential & infrastructure Construction Chemicals Market, 2016-2026 (USD Billion)
        FIG. 8 Global Residential Construction Chemicals Market, 2016-2026 (USD Billion)
        FIG. 9 Global Construction Chemicals Market Share, by Region, 2019&2026
        FIG. 10 North America Construction Chemicals Market, 2016-2026
        FIG. 11 U.S. Construction Chemicals Market, 2016-2026
        FIG. 12 Canada Construction Chemicals Market, 2016-2026
        FIG. 13 Europe Construction Chemicals Market, 2016-2026
        FIG. 14 Germany Construction Chemicals Market, 2016-2026
        FIG. 15 France Construction Chemicals Market, 2016-2026
        FIG. 16 U.K. Construction Chemicals Market, 2016-2026
        FIG. 17 Italy Construction Chemicals Market, 2016-2026
        FIG. 18 Spain Construction Chemicals Market, 2016-2026
        FIG. 19 Rest of Europe Construction Chemicals Market, 2016-2026
        FIG. 20 Asia Pacific Construction Chemicals Market, 2016-2026
        FIG. 21 China Construction Chemicals Market, 2016-2026
        FIG. 22 Japan Construction Chemicals Market, 2016-2026
        FIG. 23 India Construction Chemicals Market, 2016-2026
        FIG. 24 South  Korea Construction Chemicals Market, 2016-2026
        FIG. 25 South-East Asia Construction Chemicals Market, 2016-2026
        FIG. 26 Rest of Asia Pacific Construction Chemicals Market, 2016-2026
        FIG. 27 Latin America Construction Chemicals Market, 2016-2026
        FIG. 28 Brazil Construction Chemicals Market, 2016-2026
        FIG. 29 Mexico Construction Chemicals Market, 2016-2026
        FIG. 30 Rest of Latin America Construction Chemicals Market, 2016-2026
        FIG. 31 The Middle-East and Africa Construction Chemicals Market, 2016-2026
        FIG. 32 GCC Countries Construction Chemicals Market, 2016-2026
        FIG. 33 South Africa Construction Chemicals Market, 2016-2026
        FIG. 34 Rest of Middle-East Africa Construction Chemicals Market, 2016-2026
        FIG. 35 Competitor Market Share – Revenue
        FIG. 36 3M Revenue and Growth Rate
        FIG. 37 3M Market Share
        FIG. 38 Arkema Group Revenue and Growth Rate
        FIG. 39 Arkema Group Market Share
        FIG. 40 Ashland Revenue and Growth Rate
        FIG. 41 Ashland Market Share
        FIG. 42 BASF SE Revenue and Growth Rate
        FIG. 43 BASF SE Market Share
        FIG. 44 Bolton Group Revenue and Growth Rate
        FIG. 45 Bolton Group Market Share
        FIG. 46 Cemetaid (N.S.W.) Pty Ltd Revenue and Growth Rate
        FIG. 47 Cemetaid (N.S.W.) Pty Ltd Market Share
        FIG. 48 Chryso SAS Revenue and Growth Rate
        FIG. 49 Chryso SAS Market Share
        FIG. 50 CICO Group Revenue and Growth Rate
        FIG. 51 CICO Group Market Share
        FIG. 52 Conmix Ltd Revenue and Growth Rate
        FIG. 53 Conmix Ltd Market Share
        FIG. 54 DowDuPont Revenue and Growth Rate
        FIG. 55 DowDuPont Market Share
        FIG. 56 Fosroc Inc. Revenue and Growth Rate
        FIG. 57 Fosroc Inc. Market Share
        FIG. 58 Franklin International Revenue and Growth Rate
        FIG. 59 Franklin International Market Share
        FIG. 60 GCP Applied Technologies Inc. Revenue and Growth Rate
        FIG. 61 GCP Applied Technologies Inc. Market Share
        FIG. 62 Henkel AG & Co. KGaA Revenue and Growth Rate
        FIG. 63 Henkel AG & Co. KGaA Market Share
        FIG. 64 LafargeHolcim Revenue and Growth Rate
        FIG. 65 LafargeHolcim Market Share
        FIG. 66 MAPEI SpA Revenue and Growth Rate
        FIG. 67 MAPEI SpA Market Share
        FIG. 68 MUHU Construction Materials Co. Ltd Revenue and Growth Rate
        FIG. 69 MUHU Construction Materials Co. Ltd Market Share
        FIG. 70 Nouryon Revenue and Growth Rate
        FIG. 71 Nouryon Market Share
        FIG. 72 RPM International Inc. Revenue and Growth Rate
        FIG. 73 RPM International Inc. Market Share
        FIG. 74 Sika AG Revenue and Growth Rate
        FIG. 75 Sika AG Market Share
        FIG. 76 Thermax Global Revenue and Growth Rate
        FIG. 77 Thermax Global Market Share
        FIG. 78 Market Dynamics
        FIG. 79 Global Construction Chemicals – Value Chain Analysis
        FIG. 80 Technology Roadmap and Timeline
        FIG. 81 Market Attractiveness Analysis – By Product
        FIG. 82 Market Attractiveness Analysis – By End User
        FIG. 83 Market Attractiveness Analysis – By Region
        FIG. 84 Market Channel
        FIG. 85 Marketing Channel Development Trend
        FIG. 86 Growth in World Gross Product, 2008-2019

        List of Tables

        TABLE 1 Global Construction Chemicals Market, 2019&2026 (USD Billion)
        TABLE 2 Global Construction Chemicals market, by Product, 2016-2026 (USD Billion)
        TABLE 3 Global Construction Chemicals market, by End User, 2016-2026 (USD Billion)
        TABLE 4 Global Construction Chemicals market, by Region, 2016-2026 (USD Billion)
        TABLE 5 North America Construction Chemicals Market, by Product, 2016-2026 (USD Billion)
        TABLE 6 North America Construction Chemicals Market, by End User, 2016-2026 (USD Billion)
        TABLE 7 Europe Construction Chemicals Market, by Product, 2016-2026 (USD Billion)
        TABLE 8 Europe Construction Chemicals Market, by End User, 2016-2026 (USD Billion)
        TABLE 9 Asia Pacific Construction Chemicals Market, by Product, 2016-2026 (USD Billion)
        TABLE 10 Asia Pacific Construction Chemicals Market, by End User, 2016-2026 (USD Billion)
        TABLE 11 Latin America Construction Chemicals Market, by Product, 2016-2026 (USD Billion)
        TABLE 12 Latin America Construction Chemicals Market, by End User, 2016-2026 (USD Billion)
        TABLE 13 The Middle-East and Africa Construction Chemicals Market, by Product, 2016-2026 (USD Billion)
        TABLE 14 The Middle-East and Africa Construction Chemicals Market, by End User, 2016-2026 (USD Billion)
        TABLE 15 Global Construction Chemicals Market - Company Revenue Analysis 2016-2019 (USD Billion)
        TABLE 16 Global Construction Chemicals Market - Company Revenue Share Analysis 2016-2019(%)
        TABLE 17 Acquisitions and Mergers
        TABLE 18 New Product/Service Launch
        TABLE 19 Research & Development Activities
        TABLE 20 Market Drivers
        TABLE 21 Market Restraints
        TABLE 22 Market Opportunities

Industry Major Market Players

  • 3M
  • Arkema Group
  • Ashland
  • BASF SE
  • Bolton Group
  • Cemetaid (N.S.W.) Pty Ltd
  • Chryso SAS
  • CICO Group
  • Conmix Ltd
  • DowDuPont
  • Fosroc Inc.
  • Franklin International
  • GCP Applied Technologies Inc.
  • Henkel AG & Co. KGaA
  • LafargeHolcim
  • MAPEI SpA
  • MUHU Construction Materials Co. Ltd
  • Nouryon
  • RPM International Inc.
  • Sika AG
  • Thermax Global