Search Market Research Report

Discover Our Latest Reports
Discover Our Featured Reports
Discover Top Selling Reports

Cone Beam Computed Tomography (CBCT) Market Size, Share Global Analysis Report, , 2019 – 2026

report img

Cone Beam Computed Tomography (CBCT) Market By Application (Dental Applications, Implantology, Oral and Maxillofacial Surgery, Orthodontics, Endodontics, General Dentistry, Temporomandibular Joint (TMJ) Disorders, Periodontics, Forensic Dentistry and Other Applications) By patient Position (Standing/Seated, Seated and Supine) For Hospitals, Clinics and Research Institutes: Global Industry Perspective, Comprehensive Analysis, and Forecast, 2019 – 2026

Industry Insights

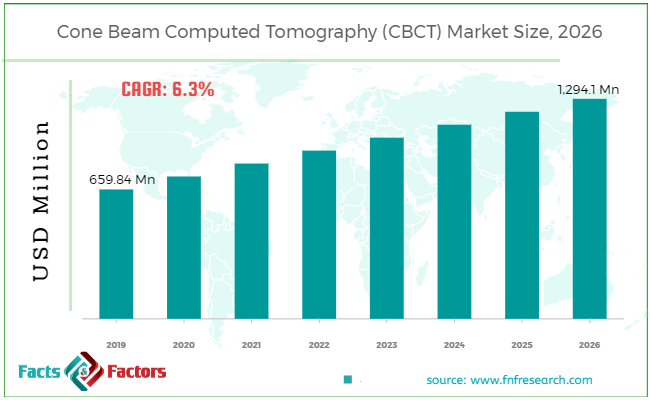
[190+ Pages Report] According to the report published by Facts Factors, the global cone beam computed tomography (CBCT) market size was worth around USD 659.84 million in 2019 and is predicted to grow to around USD 1,294.1 million by 2026 with a compound annual growth rate (CAGR) of roughly 10.1% between 2020 and 2026. The report analyzes the global cone beam computed tomography (CBCT) market drivers, restraints/challenges, and the effect they have on the demands during the projection period. In addition, the report explores emerging opportunities in the cone beam computed tomography (CBCT) market.

Cone Beam Computed Tomography (CBCT) Market Size

To know more about this report | Request Free Sample Copy

This specialized expertise oriented industry research report scrutinizes the technical and commercial business outlook of the Cone beam computed tomography (CBCT) industry. The report analyzes and declares the historical and current trends analysis of the Cone beam computed tomography (CBCT) industry and subsequently recommends the projected trends anticipated to be observed in the Cone beam computed tomography (CBCT) market during the upcoming years.

The Cone beam computed tomography (CBCT) market report analyzes and notifies the industry statistics at the global as well as regional and country levels to acquire a thorough perspective of the entire Cone beam computed tomography (CBCT) market. The historical and past insights are provided for FY 2016 to FY 2019 whereas projected trends are delivered for FY 2020 to FY 2026. The quantitative and numerical data is represented in terms of value in USD Million from FY 2016 – 2026.


logoKey Insights from Primary Research

  • As per our primary respondents, the global Cone beam computed tomography (CBCT) market is set to grow annually at a rate of around 10.1%.
  • It was established through primary research that the global Cone beam computed tomography (CBCT) market was valued at around USD 659.84 Million in 2019.
  • The “Dental Application” category, on the basis of Application segmentation, was the leading revenue-generating category in 2019 and will remain same within the forecasted year.
  • On the basis of End-Users segmentation, the “Hospital and Dental CLinics” category was the most attractive segment for global Cone beam computed tomography (CBCT) market.
  • Based on the region, North America was the leading revenue-generating category in 2019.

logoKey Recommendations from Analysts

  • As per our analysis, the global Cone beam computed tomography (CBCT) market is growing at high CAGR and various end-use industries are aware of this potential market and applications of the Cone beam computed tomography (CBCT).
  • Growing at a CAGR around 10.1%, the global Cone beam computed tomography (CBCT) market provides numerous opportunities for all of the involved stakeholders across the entire value chain.
  • Our analysts have identified break of Viral Infection COVID 19 is considered  one of the major factor for the growth of the market in the year 2020 and 2021
  • As per our analysis, North America is expected to account for maximum revenue share, in the target market.

Cone beam computed tomography (CBCT) Market

To know more about this report | Request Free Sample Copy


The quantitative data is further underlined and reinforced by comprehensive qualitative data which comprises various across-the-board market dynamics. The rationales which directly or indirectly impact the Cone beam computed tomography (CBCT) industry are exemplified through parameters such as growth drivers, restraints, challenges, and opportunities among other impacting factors.

Throughout our research report, we have encompassed all the proven models and tools of industry analysis and extensively illustrated all the key business strategies and business models adopted in the Cone beam computed tomography (CBCT) industry. The report provides an all-inclusive and detailed competitive landscape prevalent in the Cone beam computed tomography (CBCT) market.

The report utilizes established industry analysis tools and models such as Porter’s Five Forces framework to analyze and recognize critical business strategies adopted by various stakeholders involved in the entire value chain of the Cone beam computed tomography (CBCT) industry. The Cone beam computed tomography (CBCT) market report additionally employs SWOT analysis and PESTLE analysis models for further in-depth analysis.

The report study further includes an in-depth analysis of industry players' market shares and provides an overview of leading players' market position in the Cone beam computed tomography (CBCT) sector. Key strategic developments in the Cone beam computed tomography (CBCT) market competitive landscape such as acquisitions & mergers, inaugurations of different products and services, partnerships & joint ventures, MoU agreements, VC & funding activities, R&D activities, and geographic expansion among other noteworthy activities by key players of the Cone beam computed tomography (CBCT) market are appropriately highlighted in the report.

The Cone beam computed tomography (CBCT) market is estimated to develop with a healthy CAGR in upcoming years. The vital sign has wide applications that lead to the growth of the industry. COVID 19 Break out is considered one of the major opportunities for the market.

logoReport Scope

Report Attribute

Details

Market Size in 2019

USD 659.84 Million

Projected Market Size in 2026

USD 1,294.1 Million

CAGR Growth Rate

10.1% CAGR

Base Year

2019

Forecast Years

2020-2026

Key Market Players

PLANMED OY, CurveBeam, PreXion Corporation, J.Morita Mfg Corp, Cefla S.C, Dentsply Sirona, Inc, Danaher Corporation, ASAHIROENTGEN IND.CO., LTD., VATECH CO., LTD., Planmeca Oy, and Carestream Health India Pvt. Ltd., and Others

Key Segment

By Application, Patient, End-users, and Region

Major Regions Covered

North America, Europe, Asia Pacific, Latin America, and the Middle East & Africa

Purchase Options

Request customized purchase options to meet your research needs.Explore purchase options

The study provides a decisive view on the Cone beam computed tomography (CBCT) market by segmenting the market based on the application, patient position, End-Users, and region. All the segments have been analyzed based on present and future trends and the market is estimated from 2016 to 2026. Based on Application the market is segmented into Dental Applications, Implantology, Oral and Maxillofacial Surgery, Orthodontics, Endodontics, General Dentistry, Temporomandibular Joint (TMJ) Disorders, Periodontics, Forensic Dentistry, and Other Applications.

On the basis of the patient position, the market is segmented into Standing/Seated, Seated, and Supine. Based on End-users the market is segmented into Hospitals, Clinics, and Research Institutes.

 The regional segmentation includes the current and forecast demand for North America, Europe, Asia Pacific, Latin America, and the Middle East and The report covers a detailed competitive outlook including company profiles of the key participants operating in the global Cone beam computed tomography (CBCT) market.

logoSome of the leading players in the global market include

  •  PLANMED OY
  •  CurveBeam
  •  PreXion Corporation
  •  J.Morita Mfg Corp
  •  Cefla S.C
  •  Dentsply Sirona Inc
  •  Danaher Corporation
  •  ASAHIROENTGEN IND.CO. Ltd.
  •  VATECH CO. Ltd.
  •  Planmeca Oy
  •  Carestream Health India Pvt. Ltd

The taxonomy of the Cone beam computed tomography (CBCT) Market by its scope and segmentation is as follows:

logoBy Application type Segment Analysis

  • Dental Applications
  • Implantology
  • Oral and Maxillofacial Surgery
  • Orthodontics
  • Endodontics
  • General Dentistry
  • Temporomandibular Joint (TMJ) Disorders
  • Periodontics
  • Forensic Dentistry
  • Other Applications*

logoBy Patient Position type Segment Analysis

  • Standing/Seated
  • Seated
  • Supine

logoBy End-users type Segment Analysis

  • Hospitals
  • Private  Practices
  • Academic & Research Institutes

logoBy Region Segment Analysis

  • North America
    • The U.S.
    • Canada
  • Europe
    • Germany
    • France
    • UK
    • Italy
    • Spain
    • Rest Of Europe
  • Asia Pacific
    • China
    • Japan
    • India
    • South Korea
    • Southeast Asia
    • Rest of Asia Pacific
  • Latin America
    • Brazil
    • Mexico
    • Rest of Latin America
  • The Middle East & Africa
    • GCC Countries
    • South Africa
    • Rest of Middle East & Africa         

Table of Content

  1. CHAPTER 1. Executive Summary
  2. CHAPTER 2. Cone beam computed tomography (CBCT) market – Application Analysis
    1. 2.1. Global Cone beam computed tomography (CBCT) Market–ApplicationOverview
    2. 2.2. Global Cone beam computed tomography (CBCT)MarketShare, by Application, 2019 & 2026 (USD Million)
    3. 2.3. Dental Applications
      1. 2.3.1. Global Dental ApplicationsCone beam computed tomography (CBCT)Market,2016-2026 (USD Million)
    4. 2.4. Implantology
      1. 2.4.1. Global ImplantologyCone beam computed tomography (CBCT)Market,2016-2026 (USD Million)
    5. 2.5. Oral and Maxillofacial Surgery
      1. 2.5.1. Global Oral and Maxillofacial SurgeryCone beam computed tomography (CBCT)Market,2016-2026 (USD Million)
    6. 2.6. Orthodontics
      1. 2.6.1. Global OrthodonticsCone beam computed tomography (CBCT)Market,2016-2026 (USD Million)
    7. 2.7. Endodontics
      1. 2.7.1. Global EndodonticsCone beam computed tomography (CBCT)Market,2016-2026 (USD Million)
    8. 2.8. General Dentistry
      1. 2.8.1. Global General DentistryCone beam computed tomography (CBCT)Market,2016-2026 (USD Million)
    9. 2.9. Temporomandibular Joint (TMJ) Disorders
      1. 2.9.1. Global Temporomandibular Joint (TMJ) DisordersCone beam computed tomography (CBCT)Market,2016-2026 (USD Million)
    10. 2.10. Periodontics
      1. 2.10.1. Global PeriodonticsCone beam computed tomography (CBCT)Market,2016-2026 (USD Million)
    11. 2.11. Forensic Dentistry
      1. 2.11.1. Global Forensic DentistryCone beam computed tomography (CBCT)Market,2016-2026 (USD Million)
    12. 2.12. Other Applications
      1. 2.12.1. Global Other ApplicationsCone beam computed tomography (CBCT)Market,2016-2026 (USD Million)
  3. CHAPTER 3. Cone beam computed tomography (CBCT) market – Patient Position Analysis
    1. 3.1. Global Cone beam computed tomography (CBCT) Market–Patient PositionOverview
    2. 3.2. Global Cone beam computed tomography (CBCT)MarketShare, by Patient Position, 2019 & 2026 (USD Million)
    3. 3.3. Standing/Seated
      1. 3.3.1. Global Standing/SeatedCone beam computed tomography (CBCT)Market,2016-2026 (USD Million)
    4. 3.4. Seated
      1. 3.4.1. Global SeatedCone beam computed tomography (CBCT)Market,2016-2026 (USD Million)
    5. 3.5. Supine
      1. 3.5.1. Global SupineCone beam computed tomography (CBCT)Market,2016-2026 (USD Million)
  4. CHAPTER 4. Cone beam computed tomography (CBCT) market – End-users Analysis
    1. 4.1. Global Cone beam computed tomography (CBCT) Market–End-usersOverview
    2. 4.2. Global Cone beam computed tomography (CBCT)MarketShare, by End-users, 2019 & 2026 (USD Million)
    3. 4.3. Hospitals
      1. 4.3.1. Global HospitalsCone beam computed tomography (CBCT)Market,2016-2026 (USD Million)
    4. 4.4. Private Practices
      1. 4.4.1. Global Private PracticesCone beam computed tomography (CBCT)Market,2016-2026 (USD Million)
    5. 4.5. Academic & Research Institutes
      1. 4.5.1. Global Academic & Research InstitutesCone beam computed tomography (CBCT)Market,2016-2026 (USD Million)
  5. CHAPTER 5. Cone beam computed tomography (CBCT) market – Regional Analysis
    1. 5.1. Global Cone beam computed tomography (CBCT) MarketRegionalOverview
    2. 5.2. Global Cone beam computed tomography (CBCT)MarketShare, by Region, 2019 & 2026 (Value)
    3. 5.3. North America
      1. 5.3.1. North AmericaCone beam computed tomography (CBCT) Market size and forecast, 2016-2026
      2. 5.3.2. North AmericaCone beam computed tomography (CBCT) Market, by Country, 2019 & 2026 (USD Million)
      3. 5.3.3. North AmericaCone beam computed tomography (CBCT) Market, by Application, 2016-2026
        1. 5.3.3.1. North AmericaCone beam computed tomography (CBCT) Market, by Application, 2016-2026 (USD Million)
      4. 5.3.4. North AmericaCone beam computed tomography (CBCT) Market, by Patient Position, 2016-2026
        1. 5.3.4.1. North AmericaCone beam computed tomography (CBCT) Market, by Patient Position, 2016-2026 (USD Million)
      5. 5.3.5. North AmericaCone beam computed tomography (CBCT) Market, by End-users, 2016-2026
        1. 5.3.5.1. North AmericaCone beam computed tomography (CBCT) Market, by End-users, 2016-2026 (USD Million)
      6. 5.3.6. U.S.
        1. 5.3.6.1. U.S. Market size and forecast, 2016-2026 (USD Million)
      7. 5.3.7. Canada
        1. 5.3.7.1. Canada Market size and forecast, 2016-2026 (USD Million)
    4. 5.4. Europe
      1. 5.4.1. EuropeCone beam computed tomography (CBCT) Market size and forecast, 2016-2026
      2. 5.4.2. EuropeCone beam computed tomography (CBCT) Market, by Country, 2019 & 2026 (USD Million)
      3. 5.4.3. EuropeCone beam computed tomography (CBCT) Market, by Application, 2016-2026
        1. 5.4.3.1. EuropeCone beam computed tomography (CBCT) Market, by Application, 2016-2026 (USD Million)
      4. 5.4.4. EuropeCone beam computed tomography (CBCT) Market, by Patient Position, 2016-2026
        1. 5.4.4.1. EuropeCone beam computed tomography (CBCT) Market, by Patient Position, 2016-2026 (USD Million)
      5. 5.4.5. EuropeCone beam computed tomography (CBCT) Market, by End-users, 2016-2026
        1. 5.4.5.1. EuropeCone beam computed tomography (CBCT) Market, by End-users, 2016-2026 (USD Million)
      6. 5.4.6. Germany
        1. 5.4.6.1. Germany Market size and forecast, 2016-2026 (USD Million)
      7. 5.4.7. France
        1. 5.4.7.1. France Market size and forecast, 2016-2026 (USD Million)
      8. 5.4.8. U.K.
        1. 5.4.8.1. U.K. Market size and forecast, 2016-2026 (USD Million)
      9. 5.4.9. Italy
        1. 5.4.9.1. Italy Market size and forecast, 2016-2026 (USD Million)
      10. 5.4.10. Spain
        1. 5.4.10.1. Spain Market size and forecast, 2016-2026 (USD Million)
      11. 5.4.11. Rest of Europe
        1. 5.4.11.1. Rest of Europe Market size and forecast, 2016-2026 (USD Million)
    5. 5.5. Asia Pacific
      1. 5.5.1. Asia PacificCone beam computed tomography (CBCT) Market size and forecast, 2016-2026
      2. 5.5.2. Asia PacificCone beam computed tomography (CBCT) Market, by Country, 2019 & 2026 (USD Million)
      3. 5.5.3. Asia PacificCone beam computed tomography (CBCT) Market, by Application, 2016-2026
        1. 5.5.3.1. Asia PacificCone beam computed tomography (CBCT) Market, by Application, 2016-2026 (USD Million)
      4. 5.5.4. Asia PacificCone beam computed tomography (CBCT) Market, by Patient Position, 2016-2026
        1. 5.5.4.1. Asia PacificCone beam computed tomography (CBCT) Market, by Patient Position, 2016-2026 (USD Million)
      5. 5.5.5. Asia PacificCone beam computed tomography (CBCT) Market, by End-users, 2016-2026
        1. 5.5.5.1. Asia PacificCone beam computed tomography (CBCT) Market, by End-users, 2016-2026 (USD Million)
      6. 5.5.6. China
        1. 5.5.6.1. China Market size and forecast, 2016-2026 (USD Million)
      7. 5.5.7. Japan
        1. 5.5.7.1. Japan Market size and forecast, 2016-2026 (USD Million)
      8. 5.5.8. India
        1. 5.5.8.1. India Market size and forecast, 2016-2026 (USD Million)
      9. 5.5.9. South Korea
        1. 5.5.9.1. South Korea Market size and forecast, 2016-2026 (USD Million)
      10. 5.5.10. South-East Asia
        1. 5.5.10.1. South-East Asia Market size and forecast, 2016-2026 (USD Million)
      11. 5.5.11. Rest of Asia Pacific
        1. 5.5.11.1. Rest of Asia Pacific Market size and forecast, 2016-2026 (USD Million)
    6. 5.6. Latin America
      1. 5.6.1. Latin AmericaCone beam computed tomography (CBCT) Market size and forecast, 2016-2026
      2. 5.6.2. Latin AmericaCone beam computed tomography (CBCT) Market, by Country, 2019 & 2026 (USD Million)
      3. 5.6.3. Latin AmericaCone beam computed tomography (CBCT) Market, by Application, 2016-2026
        1. 5.6.3.1. Latin AmericaCone beam computed tomography (CBCT) Market, by Application, 2016-2026 (USD Million)
      4. 5.6.4. Latin AmericaCone beam computed tomography (CBCT) Market, by Patient Position, 2016-2026
        1. 5.6.4.1. Latin AmericaCone beam computed tomography (CBCT) Market, by Patient Position, 2016-2026 (USD Million)
      5. 5.6.5. Latin AmericaCone beam computed tomography (CBCT) Market, by End-users, 2016-2026
        1. 5.6.5.1. Latin AmericaCone beam computed tomography (CBCT) Market, by End-users, 2016-2026 (USD Million)
      6. 5.6.6. Brazil
        1. 5.6.6.1. Brazil Market size and forecast, 2016-2026 (USD Million)
      7. 5.6.7. Mexico
        1. 5.6.7.1. Mexico Market size and forecast, 2016-2026 (USD Million)
      8. 5.6.8. Rest of Latin America
        1. 5.6.8.1. Rest of Latin America Market size and forecast, 2016-2026 (USD Million)
    7. 5.7. The Middle-East and Africa
      1. 5.7.1. The Middle-East and AfricaCone beam computed tomography (CBCT) Market size and forecast, 2016-2026
      2. 5.7.2. The Middle-East and AfricaCone beam computed tomography (CBCT) Market, by Country, 2019 & 2026 (USD Million)
      3. 5.7.3. The Middle-East and AfricaCone beam computed tomography (CBCT) Market, by Application, 2016-2026
        1. 5.7.3.1. The Middle-East and AfricaCone beam computed tomography (CBCT) Market, by Application, 2016-2026 (USD Million)
      4. 5.7.4. The Middle-East and AfricaCone beam computed tomography (CBCT) Market, by Patient Position, 2016-2026
        1. 5.7.4.1. The Middle-East and AfricaCone beam computed tomography (CBCT) Market, by Patient Position, 2016-2026 (USD Million)
      5. 5.7.5. The Middle-East and AfricaCone beam computed tomography (CBCT) Market, by End-users, 2016-2026
        1. 5.7.5.1. The Middle-East and AfricaCone beam computed tomography (CBCT) Market, by End-users, 2016-2026 (USD Million)
      6. 5.7.6. GCC Countries
        1. 5.7.6.1. GCC Countries Market size and forecast, 2016-2026 (USD Million)
      7. 5.7.7. South Africa
        1. 5.7.7.1. South Africa Market size and forecast, 2016-2026 (USD Million)
      8. 5.7.8. Rest of Middle-East Africa
        1. 5.7.8.1. Rest of Middle-East Africa Market size and forecast, 2016-2026 (USD Million)
  6. CHAPTER 6. Cone beam computed tomography (CBCT) market – Competitive Landscape
    1. 6.1. Competitor Market Share – Revenue
    2. 6.2. Market Concentration Rate Analysis, Top 3 and Top 5 Players
    3. 6.3. Strategic Development
      1. 6.3.1. Acquisitions and Mergers
      2. 6.3.2. New Products
      3. 6.3.3. Research & Development Activities
  7. CHAPTER 7. Company Profiles
    1. 7.1. PLANMED OY
      1. 7.1.1. Company Overview
      2. 7.1.2. PLANMED OYRevenue and Gross Margin
      3. 7.1.3. Product portfolio
      4. 7.1.4. Recent initiatives
    2. 7.2. CurveBeam
      1. 7.2.1. Company Overview
      2. 7.2.2. CurveBeamRevenue and Gross Margin
      3. 7.2.3. Product portfolio
      4. 7.2.4. Recent initiatives
    3. 7.3. PreXion Corporation
      1. 7.3.1. Company Overview
      2. 7.3.2. PreXion CorporationRevenue and Gross Margin
      3. 7.3.3. Product portfolio
      4. 7.3.4. Recent initiatives
    4. 7.4. J.Morita Mfg Corp
      1. 7.4.1. Company Overview
      2. 7.4.2. J.Morita Mfg CorpRevenue and Gross Margin
      3. 7.4.3. Product portfolio
      4. 7.4.4. Recent initiatives
    5. 7.5. Cefla S.C
      1. 7.5.1. Company Overview
      2. 7.5.2. Cefla S.CRevenue and Gross Margin
      3. 7.5.3. Product portfolio
      4. 7.5.4. Recent initiatives
    6. 7.6. Dentsply Sirona, Inc
      1. 7.6.1. Company Overview
      2. 7.6.2. Dentsply Sirona, IncRevenue and Gross Margin
      3. 7.6.3. Product portfolio
      4. 7.6.4. Recent initiatives
    7. 7.7. Danaher Corporation
      1. 7.7.1. Company Overview
      2. 7.7.2. Danaher CorporationRevenue and Gross Margin
      3. 7.7.3. Product portfolio
      4. 7.7.4. Recent initiatives
    8. 7.8. ASAHIROENTGEN IND.CO., LTD.
      1. 7.8.1. Company Overview
      2. 7.8.2. ASAHIROENTGEN IND.CO., LTD.Revenue and Gross Margin
      3. 7.8.3. Product portfolio
      4. 7.8.4. Recent initiatives
    9. 7.9. VATECH CO., LTD.
      1. 7.9.1. Company Overview
      2. 7.9.2. VATECH CO., LTD.Revenue and Gross Margin
      3. 7.9.3. Product portfolio
      4. 7.9.4. Recent initiatives
    10. 7.10. Planmeca Oy
      1. 7.10.1. Company Overview
      2. 7.10.2. Planmeca OyRevenue and Gross Margin
      3. 7.10.3. Product portfolio
      4. 7.10.4. Recent initiatives
    11. 7.11. Carestream Health India Pvt. Ltd
      1. 7.11.1. Company Overview
      2. 7.11.2. Carestream Health India Pvt. LtdRevenue and Gross Margin
      3. 7.11.3. Product portfolio
      4. 7.11.4. Recent initiatives
    12. 7.12. Others
      1. 7.12.1. Company Overview
      2. 7.12.2. OthersRevenue and Gross Margin
      3. 7.12.3. Product portfolio
      4. 7.12.4. Recent initiatives
  8. CHAPTER 8. Cone beam computed tomography (CBCT) — Industry Analysis
    1. 8.1. Cone beam computed tomography (CBCT) Market – Key Trends
      1. 8.1.1. Market Drivers
      2. 8.1.2. Market Restraints
      3. 8.1.3. Market Opportunities
    2. 8.2. Value Chain Analysis
    3. 8.3. Technology Roadmap and Timeline
    4. 8.4. Cone beam computed tomography (CBCT) Market – Attractiveness Analysis
      1. 8.4.1. By Application
      2. 8.4.2. By Patient Position
      3. 8.4.3. By End-users
      4. 8.4.4. By Region
  9. CHAPTER 9. Marketing Strategy Analysis, Distributors
    1. 9.1. Marketing Channel
    2. 9.2. Direct Marketing
    3. 9.3. Indirect Marketing
    4. 9.4. Marketing Channel Development Trend
    5. 9.5. Economic/Political Environmental Change
  10. CHAPTER 10. Report Conclusion
  11. CHAPTER 11. Research Approach & Methodology
    1. 11.1. Report Description
    2. 11.2. Research Scope
    3. 11.3. Research Methodology
      1. 11.3.1. Secondary Research
      2. 11.3.2. Primary Research
      3. 11.3.3. Models
        1. 11.3.3.1. Company Share Analysis Model
        2. 11.3.3.2. Revenue Based Modeling
        3. 11.3.3.3. Research Limitations

        List of Figures

        FIG. 1 Global Cone beam computed tomography (CBCT) Market, 2016-2026(USD Million)
        FIG. 2 Global Cone beam computed tomography (CBCT) MarketShare, by Application, 2019 & 2026 (USD Million)
        FIG. 3 Global Dental ApplicationsCone beam computed tomography (CBCT)Market,2016-2026 (USD Million)
        FIG. 4 Global ImplantologyCone beam computed tomography (CBCT)Market,2016-2026 (USD Million)
        FIG. 5 Global Oral and Maxillofacial SurgeryCone beam computed tomography (CBCT)Market,2016-2026 (USD Million)
        FIG. 6 Global OrthodonticsCone beam computed tomography (CBCT)Market,2016-2026 (USD Million)
        FIG. 7 Global EndodonticsCone beam computed tomography (CBCT)Market,2016-2026 (USD Million)
        FIG. 8 Global General DentistryCone beam computed tomography (CBCT)Market,2016-2026 (USD Million)
        FIG. 9 Global Temporomandibular Joint (TMJ) DisordersCone beam computed tomography (CBCT)Market,2016-2026 (USD Million)
        FIG. 10 Global PeriodonticsCone beam computed tomography (CBCT)Market,2016-2026 (USD Million)
        FIG. 11 Global Forensic DentistryCone beam computed tomography (CBCT)Market,2016-2026 (USD Million)
        FIG. 12 Global Other ApplicationsCone beam computed tomography (CBCT)Market,2016-2026 (USD Million)
        FIG. 13 Global Cone beam computed tomography (CBCT) MarketShare, by Patient Position, 2019 & 2026 (USD Million)
        FIG. 14 Global Standing/SeatedCone beam computed tomography (CBCT)Market,2016-2026 (USD Million)
        FIG. 15 Global SeatedCone beam computed tomography (CBCT)Market,2016-2026 (USD Million)
        FIG. 16 Global SupineCone beam computed tomography (CBCT)Market,2016-2026 (USD Million)
        FIG. 17 Global Cone beam computed tomography (CBCT) MarketShare, by End-users, 2019 & 2026 (USD Million)
        FIG. 18 Global HospitalsCone beam computed tomography (CBCT)Market,2016-2026 (USD Million)
        FIG. 19 Global Private  PracticesCone beam computed tomography (CBCT)Market,2016-2026 (USD Million)
        FIG. 20 Global Academic & Research InstitutesCone beam computed tomography (CBCT)Market,2016-2026 (USD Million)
        FIG. 21 Global Cone beam computed tomography (CBCT) MarketShare, by Region, 2019 & 2026
        FIG. 22 North AmericaCone beam computed tomography (CBCT) Market, 2016-2026
        FIG. 23 U.S.Cone beam computed tomography (CBCT) Market, 2016-2026
        FIG. 24 CanadaCone beam computed tomography (CBCT) Market, 2016-2026
        FIG. 25 EuropeCone beam computed tomography (CBCT) Market, 2016-2026
        FIG. 26 GermanyCone beam computed tomography (CBCT) Market, 2016-2026
        FIG. 27 FranceCone beam computed tomography (CBCT) Market, 2016-2026
        FIG. 28 U.K.Cone beam computed tomography (CBCT) Market, 2016-2026
        FIG. 29 ItalyCone beam computed tomography (CBCT) Market, 2016-2026
        FIG. 30 SpainCone beam computed tomography (CBCT) Market, 2016-2026
        FIG. 31 Rest of EuropeCone beam computed tomography (CBCT) Market, 2016-2026
        FIG. 32 Asia PacificCone beam computed tomography (CBCT) Market, 2016-2026
        FIG. 33 ChinaCone beam computed tomography (CBCT) Market, 2016-2026
        FIG. 34 JapanCone beam computed tomography (CBCT) Market, 2016-2026
        FIG. 35 IndiaCone beam computed tomography (CBCT) Market, 2016-2026
        FIG. 36 South  KoreaCone beam computed tomography (CBCT) Market, 2016-2026
        FIG. 37 South-East AsiaCone beam computed tomography (CBCT) Market, 2016-2026
        FIG. 38 Rest of Asia PacificCone beam computed tomography (CBCT) Market, 2016-2026
        FIG. 39 Latin AmericaCone beam computed tomography (CBCT) Market, 2016-2026
        FIG. 40 BrazilCone beam computed tomography (CBCT) Market, 2016-2026
        FIG. 41 MexicoCone beam computed tomography (CBCT) Market, 2016-2026
        FIG. 42 Rest of Latin AmericaCone beam computed tomography (CBCT) Market, 2016-2026
        FIG. 43 The Middle-East and AfricaCone beam computed tomography (CBCT) Market, 2016-2026
        FIG. 44 GCC CountriesCone beam computed tomography (CBCT) Market, 2016-2026
        FIG. 45 South AfricaCone beam computed tomography (CBCT) Market, 2016-2026
        FIG. 46 Rest of Middle-East AfricaCone beam computed tomography (CBCT) Market, 2016-2026
        FIG. 47 Competitor Market Share – Revenue
        FIG. 48 PLANMED OY Revenue and Growth Rate
        FIG. 49 PLANMED OY Market Share
        FIG. 50 CurveBeam Revenue and Growth Rate
        FIG. 51 CurveBeam Market Share
        FIG. 52 PreXion Corporation Revenue and Growth Rate
        FIG. 53 PreXion Corporation Market Share
        FIG. 54 J.Morita Mfg Corp Revenue and Growth Rate
        FIG. 55 J.Morita Mfg Corp Market Share
        FIG. 56 Cefla S.C Revenue and Growth Rate
        FIG. 57 Cefla S.C Market Share
        FIG. 58 Dentsply Sirona, Inc Revenue and Growth Rate
        FIG. 59 Dentsply Sirona, Inc Market Share
        FIG. 60 Danaher Corporation Revenue and Growth Rate
        FIG. 61 Danaher Corporation Market Share
        FIG. 62 ASAHIROENTGEN IND.CO., LTD. Revenue and Growth Rate
        FIG. 63 ASAHIROENTGEN IND.CO., LTD. Market Share
        FIG. 64 VATECH CO., LTD. Revenue and Growth Rate
        FIG. 65 VATECH CO., LTD. Market Share
        FIG. 66 Planmeca Oy Revenue and Growth Rate
        FIG. 67 Planmeca Oy Market Share
        FIG. 68 Carestream Health India Pvt. Ltd Revenue and Growth Rate
        FIG. 69 Carestream Health India Pvt. Ltd Market Share
        FIG. 70 Others Revenue and Growth Rate
        FIG. 71 Others Market Share
        FIG. 72 Market Dynamics
        FIG. 73 Global Cone beam computed tomography (CBCT) – Value Chain Analysis
        FIG. 74 Technology Roadmap and Timeline
        FIG. 75 Market Attractiveness Analysis – By Application
        FIG. 76 Market Attractiveness Analysis – By Patient Position
        FIG. 77 Market Attractiveness Analysis – By End-users
        FIG. 78 Market Attractiveness Analysis – By Region
        FIG. 79 Market Channel
        FIG. 80 Marketing Channel Development Trend
        FIG. 81 Growth in World Gross Product, 2008-2018

        List of Tables

        TABLE 1 Global Cone beam computed tomography (CBCT) Market, 2018& 2025 (USD Million) 25
        TABLE 2 Global Cone beam computed tomography (CBCT) market, by Application, 2016-2026 (USD Million) 27
        TABLE 3 Global Cone beam computed tomography (CBCT) market, by Patient Position, 2016-2026 (USD Million) 39
        TABLE 4 Global Cone beam computed tomography (CBCT) market, by End-users, 2016-2026 (USD Million) 43
        TABLE 5 Global Cone beam computed tomography (CBCT) market, by Region, 2016-2026 (USD Million) 47
        TABLE 6 North AmericaCone beam computed tomography (CBCT) Market, by Application, 2016-2026 (USD Million) 51
        TABLE 7 North AmericaCone beam computed tomography (CBCT) Market, by Patient Position, 2016-2026 (USD Million) 52
        TABLE 8 North AmericaCone beam computed tomography (CBCT) Market, by End-users, 2016-2026 (USD Million) 53
        TABLE 9 EuropeCone beam computed tomography (CBCT) Market, by Application, 2016-2026 (USD Million) 58
        TABLE 10 EuropeCone beam computed tomography (CBCT) Market, by Patient Position, 2016-2026 (USD Million) 59
        TABLE 11 EuropeCone beam computed tomography (CBCT) Market, by End-users, 2016-2026 (USD Million) 60
        TABLE 12 Asia PacificCone beam computed tomography (CBCT) Market, by Application, 2016-2026 (USD Million) 69
        TABLE 13 Asia PacificCone beam computed tomography (CBCT) Market, by Patient Position, 2016-2026 (USD Million) 70
        TABLE 14 Asia PacificCone beam computed tomography (CBCT) Market, by End-users, 2016-2026 (USD Million) 71
        TABLE 15 Latin AmericaCone beam computed tomography (CBCT) Market, by Application, 2016-2026 (USD Million) 80
        TABLE 16 Latin AmericaCone beam computed tomography (CBCT) Market, by Patient Position, 2016-2026 (USD Million) 81
        TABLE 17 Latin AmericaCone beam computed tomography (CBCT) Market, by End-users, 2016-2026 (USD Million) 82
        TABLE 18 The Middle-East and AfricaCone beam computed tomography (CBCT) Market, by Application, 2016-2026 (USD Million) 88
        TABLE 19 The Middle-East and AfricaCone beam computed tomography (CBCT) Market, by Patient Position, 2016-2026 (USD Million) 89
        TABLE 20 The Middle-East and AfricaCone beam computed tomography (CBCT) Market, by End-users, 2016-2026 (USD Million) 90
        TABLE 21 Global Cone beam computed tomography (CBCT) Market - Company Revenue Analysis 2015-2018 (USD Million) 94
        TABLE 22 Global Cone beam computed tomography (CBCT) Market - Company Revenue Share Analysis 2015-2018(%) 96
        TABLE 23 Acquisitions and Mergers 97
        TABLE 24 New Product/Service Launch 97
        TABLE 25 Research & Development Activities 97
        TABLE 26 Market Drivers 124
        TABLE 27 Market Restraints 124
        TABLE 28 Market Opportunities 125
        

Industry Major Market Players

  •  PLANMED OY
  •  CurveBeam
  •  PreXion Corporation
  •  J.Morita Mfg Corp
  •  Cefla S.C
  •  Dentsply Sirona Inc
  •  Danaher Corporation
  •  ASAHIROENTGEN IND.CO. Ltd.
  •  VATECH CO. Ltd.
  •  Planmeca Oy
  •  Carestream Health India Pvt. Ltd