Search Market Research Report

Discover Our Latest Reports
Discover Our Featured Reports
Discover Top Selling Reports

Concrete Superplasticizers Market Size, Share Global Analysis Report, , 2021 – 2026

report img

Concrete Superplasticizers Market By Type (Polycarboxylic Ether (PCE), Sulphonated Melamine Formaldehyde (SMF), Sulphonated Naphthalene Formaldehyde (SNF), Lignosulphonates (LS), & Other), By Form (Liquid & Powder), By Application (Ready-Mix Concrete, Precast Concrete, High Performance Concrete, Self-Compacting Concrete, & Others), By End-User (Residential, Commercial, Infrastructure, & Others), And By Regions – Global and Regional Industry Perspective, Comprehensive Analysis, and Forecast, 2021 – 2026

Industry Insights

[169+ Pages Report] The latest study presented by facts and factors presents a detailed market report titled “concrete superplasticizers market” which encompasses a global outlook for concrete superplasticizers. The study details that the global Concrete Superplasticizers Market was valued at USD 5.9 Billion in 2020 and is further expected to project revenue worth USD 9.8 Billion in the year 2026. The CAGR growth rate for the concrete superplasticizers market will be approximately 7.9% over the forecast period.

logoMarket Overview

Concrete superplasticizers are a blend of high range water reducers and chemical components that are used in tandem to increase the composition and quality of the cement while constantly trying to maintain an optimal ratio of water-cement ratio. Superplasticizers often possess high water absorbability capabilities. These mechanical devices help in reducing water wastage while producing a rich blend of applicable cement by 15-20%. A blend of flowing concrete is the by-product of these devices which is the initial framework for initiating of any infrastructure project.

logoIndustry Growth Factors

The growing trend of infrastructure projects undertaken by government and private sector in the commercial and residential sector is expected to be the driving factors for the global concrete superplasticizers market during the forecast timeframe. Continuous product development has led to better quality and efficient concrete superplasticizers that require less power and downtime which leads to higher sales in terms of volume. Maintenance of older infrastructure and rise of consumer spending coupled with increased demands of premium living quarters from consumers is expected to propel the growth of the concrete superplasticizers market. Rising demands for concrete instead of consumption of natural resources like sand, water, and gavel will further leave the concrete superplasticizers market in a ballooned state.

Rapid urbanization with a growth in the population will boost the sale of concrete plasticizers to a higher extent. Additional factors include the rise in tensile strength of the component after-treatment of the concrete with the concrete superplasticizer will further increase the demand during the forecast period. Increased investment by FDIs and the private sector in the infrastructure sector for the construction of new structures such as dams, bridges, and road, among others, will further open new revenue opportunities for the concrete superplasticizers market to flourish.

Concrete Superplasticizers Market

To know more about this report | Request Free Sample Copy

logoSegmentation Analysis

The global concrete superplasticizers market can be segmented on the basis of type, form, application, end-users, and regions.

On the basis of type, the global concrete superplasticizers market can be divided into polycarboxylic ether (PCE), sulphonated melamine formaldehyde (SMF), sulphonated naphthalene formaldehyde (SNF), lignosulphonates (LS), & other. The PCE superplasticizers are expected to occupy the largest market share during the forecast by a margin of over 40% if recent trends are to be followed. Factors pertaining to significant water reduction capabilities and dispersibility of the mixture will drive the segment to the dominant position. These superplasticizers are usually utilized in applications where high-performance concrete, high-strength and a higher volume of ash/slag concrete is required. On the basis of form, the global concrete superplasticizers market can be broken down into liquid and powder. The liquid segment is expected to witness the largest market share during the forecast due to easy functionality, rising adoption in the industry, and easy dispersing capabilities. On the basis of application, the global concrete plasticizers market can be disintegrated into ready-mix concrete, precast concrete, high performance concrete, self-compacting, and others. The segment of ready mix is expected to occupy the largest market share during the forecast due to the high convenience of functionality coupled with shortage of labor, limited working space, and low operational cost. On the basis of end-users, the global concrete superplasticizers market can be segmented into residential, commercial, infrastructure, and other.

logoReport Scope

Report Attribute

Details

Market Size in 2020

USD 5.9 Billion

Projected Market Size in 2026

USD 9.8 Billion

CAGR Growth Rate

7.9% CAGR

Base Year

2019

Forecast Years

2020-2026

Key Market Players

Arkema, Sika, BASF, GCP Applied Technologies, Mapei, Kao Corporation, Enaspol, Concrete Additives and Chemical, Rhein-Chemotechnik, Rain Carbon, The Euclid Chemical Company, Shandong Wanshan Chemical Co. Ltd., Fosroc, Inc., and ZheJiang LangYa Concrete Admixture, Inc., among others.

Key Segment

By Type, Form, Application, End-User, and Region

Major Regions Covered

North America, Europe, Asia Pacific, Latin America, and the Middle East & Africa

Purchase Options

Request customized purchase options to meet your research needs. Explore purchase options

logo Regional Analysis

Asia-Pacific is expected to witness the largest market share during the forecast owing to a higher demand of concrete during the forecast. Other factors for the rise in global concrete superplasticizers across the market can be credited to growing urbanization across emerging economies such as China, Japan, South Korea, Vietnam, Philippines, Thailand, and India. Furthermore, the region of Asia-Pacific is the largest producer and consumer of concrete based application with over 50% of the global consumption being reported in the region.

logo Competitive Players

The key participants in the global concrete superplasticizers market are :

  • Arkema
  • Sika
  • BASF
  • GCP Applied Technologies
  • Mapei
  • Kao Corporation
  • Enaspol
  • Concrete Additives and Chemical
  • Rhein-Chemotechnik
  • Rain Carbon
  • The Euclid Chemical Company
  • Shandong Wanshan Chemical Co. Ltd.
  • Fosroc Inc.
  • ZheJiang LangYa Concrete Admixture Inc.

logo By Type Segment Analysis

  • Polycarboxylic Ether (PCE)
  • Sulphonated Melamine Formaldehyde (SMF)
  • Sulphonated Naphthalene Formaldehyde (SNF)
  • Lignosulphonates (LS)
  • Others

logo By Form Segment Analysis

  • Liquid
  • Powder

logo By Application Segment Analysis

  • Ready-Mix Concrete
  • Precast Concrete
  • High-Performance Concrete
  • Self-Compacting Concrete
  • Others

logo By End-User Segment Analysis

  • Residential
  • Commercial
  • Infrastructure
  • Others

logo By Regional Segment Analysis

  • North America
    • U.S
    • Canada
  • Europe
    • UK
    • France
    • Germany
    • Italy
    • Spain
    • Rest of Europe
  • Asia Pacific
    • China
    • Japan
    • India
    • South Korea
    • Southeast Asia
    • Rest of Asia Pacific
  • Latin America
    • Brazil
    • Mexico
    • Rest of Latin America
  • Middle East and Africa
    • GCC Countries
    • South Africa
    • Rest of MEA

Table of Content

  1. Chapter 1 Executive Summary
    1. 1.1. Introduction of Concrete Plasticizers
    2. 1.2. Global Concrete Plasticizers Market, 2020 & 2026 (USD Billion)
    3. 1.3. Global Concrete Plasticizers Market, 2016 – 2026 (USD Billion)
    4. 1.4. Global Concrete Plasticizers Market Absolute Revenue Opportunity, 2016 – 2026 (USD Billion)
    5. 1.5. Global Concrete Plasticizers Market Incremental Revenue Opportunity, 2020 – 2026 (USD Billion)
  2. Chapter 2 Concrete Plasticizers Market – Type Analysis
    1. 2.1. Global Concrete Plasticizers Market – Type Overview
    2. 2.2. Global Concrete Plasticizers Market Share, by Type, 2020 & 2026 (USD Billion)
    3. 2.3. Global Concrete Plasticizers Market share, by Type, 2020 & 2026 (Kilo Tons)
    4. 2.4. Polycarboxylic Ether (PCE)
      1. 2.4.1. Global Polycarboxylic Ether (PCE) Concrete Plasticizers Market, 2016 – 2026 (USD Billion)
      2. 2.4.2. Global Polycarboxylic Ether (PCE) Concrete Plasticizers Market, 2016 – 2026 (Kilo Tons)
    5. 2.5. Sulphonated Melamine Formaldehyde (SMF)
      1. 2.5.1. Global Sulphonated Melamine Formaldehyde (SMF) Concrete Plasticizers Market, 2016 – 2026 (USD Billion)
      2. 2.5.2. Global Sulphonated Melamine Formaldehyde (SMF) Concrete Plasticizers Market, 2016 – 2026 (Kilo Tons)
    6. 2.6. Sulphonated Naphthalene Formaldehyde (SNF)
      1. 2.6.1. Global Sulphonated Naphthalene Formaldehyde (SNF) Concrete Plasticizers Market, 2016 – 2026 (USD Billion)
      2. 2.6.2. Global Sulphonated Naphthalene Formaldehyde (SNF) Concrete Plasticizers Market, 2016 – 2026 (Kilo Tons)
    7. 2.7. Lignosulphonates (LS)
      1. 2.7.1. Global Lignosulphonates (LS) Concrete Plasticizers Market, 2016 – 2026 (USD Billion)
      2. 2.7.2. Global Lignosulphonates (LS) Concrete Plasticizers Market, 2016 – 2026 (Kilo Tons)
    8. 2.8. Others
      1. 2.8.1. Global Others Concrete Plasticizers Market, 2016 – 2026 (USD Billion)
      2. 2.8.2. Global Others Concrete Plasticizers Market, 2016 – 2026 (Kilo Tons)
  3. Chapter 3 Concrete Plasticizers Market – Form Analysis
    1. 3.1. Global Concrete Plasticizers Market – Form Overview
    2. 3.2. Global Concrete Plasticizers Market Share, by Form, 2020 & 2026 (USD Billion)
    3. 3.3. Global Concrete Plasticizers Market share, by Form, 2020 & 2026 (Kilo Tons)
    4. 3.4. Liquid
      1. 3.4.1. Global Liquid Concrete Plasticizers Market, 2016 – 2026 (USD Billion)
      2. 3.4.2. Global Liquid Concrete Plasticizers Market, 2016 – 2026 (Kilo Tons)
    5. 3.5. Powder
      1. 3.5.1. Global Powder Concrete Plasticizers Market, 2016 – 2026 (USD Billion)
      2. 3.5.2. Global Powder Concrete Plasticizers Market, 2016 – 2026 (Kilo Tons)
  4. Chapter 4 Concrete Plasticizers Market – Application Analysis
    1. 4.1. Global Concrete Plasticizers Market – Application Overview
    2. 4.2. Global Concrete Plasticizers Market Share, by Application, 2020 & 2026 (USD Billion)
    3. 4.3. Global Concrete Plasticizers Market share, by Application, 2020 & 2026 (Kilo Tons)
    4. 4.4. Ready-Mix Concrete
      1. 4.4.1. Global Ready-Mix Concrete Concrete Plasticizers Market, 2016 – 2026 (USD Billion)
      2. 4.4.2. Global Ready-Mix Concrete Concrete Plasticizers Market, 2016 – 2026 (Kilo Tons)
    5. 4.5. Precast Concrete
      1. 4.5.1. Global Precast Concrete Concrete Plasticizers Market, 2016 – 2026 (USD Billion)
      2. 4.5.2. Global Precast Concrete Concrete Plasticizers Market, 2016 – 2026 (Kilo Tons)
    6. 4.6. High Performance Concrete
      1. 4.6.1. Global High Performance Concrete Concrete Plasticizers Market, 2016 – 2026 (USD Billion)
      2. 4.6.2. Global High Performance Concrete Concrete Plasticizers Market, 2016 – 2026 (Kilo Tons)
    7. 4.7. Self-Compacting Concrete
      1. 4.7.1. Global Self-Compacting Concrete Concrete Plasticizers Market, 2016 – 2026 (USD Billion)
      2. 4.7.2. Global Self-Compacting Concrete Concrete Plasticizers Market, 2016 – 2026 (Kilo Tons)
    8. 4.8. Others
      1. 4.8.1. Global Others Concrete Plasticizers Market, 2016 – 2026 (USD Billion)
      2. 4.8.2. Global Others Concrete Plasticizers Market, 2016 – 2026 (Kilo Tons)
  5. Chapter 5 Concrete Plasticizers Market – End-Users Analysis
    1. 5.1. Global Concrete Plasticizers Market – End-Users Overview
    2. 5.2. Global Concrete Plasticizers Market Share, by End-Users, 2020 & 2026 (USD Billion)
    3. 5.3. Global Concrete Plasticizers Market share, by End-Users, 2020 & 2026 (Kilo Tons)
    4. 5.4. Residential
      1. 5.4.1. Global Residential Concrete Plasticizers Market, 2016 – 2026 (USD Billion)
      2. 5.4.2. Global Residential Concrete Plasticizers Market, 2016 – 2026 (Kilo Tons)
    5. 5.5. Commercial
      1. 5.5.1. Global Commercial Concrete Plasticizers Market, 2016 – 2026 (USD Billion)
      2. 5.5.2. Global Commercial Concrete Plasticizers Market, 2016 – 2026 (Kilo Tons)
    6. 5.6. Infrastructure
      1. 5.6.1. Global Infrastructure Concrete Plasticizers Market, 2016 – 2026 (USD Billion)
      2. 5.6.2. Global Infrastructure Concrete Plasticizers Market, 2016 – 2026 (Kilo Tons)
    7. 5.7. Other
      1. 5.7.1. Global Other Concrete Plasticizers Market, 2016 – 2026 (USD Billion)
      2. 5.7.2. Global Other Concrete Plasticizers Market, 2016 – 2026 (Kilo Tons)
  6. Chapter 6 Concrete Plasticizers Market – Regional Analysis
    1. 6.1. Global Concrete Plasticizers Market Regional Overview
    2. 6.2. Global Concrete Plasticizers Market Share, by Region, 2020 & 2026 (USD Billion)
    3. 6.3. Global Concrete Plasticizers Market Share, by Region, 2020 & 2026 (Kilo Tons)
    4. 6.4. North America
      1. 6.4.1. North America Concrete Plasticizers Market, 2016 – 2026 (USD Billion)
        1. 6.4.1.1. North America Concrete Plasticizers Market, by Country, 2016 – 2026 (USD Billion)
      2. 6.4.2. North America Market, 2016 – 2026 (Kilo Tons)
        1. 6.4.2.1. North America Concrete Plasticizers Market, by Country, 2016 – 2026 (Kilo Tons)
      3. 6.4.3. North America Concrete Plasticizers Market, by Type, 2016 – 2026 (Kilo Tons)
        1. 6.4.3.1. North America Concrete Plasticizers Market, by Type, 2016 – 2026 (USD Billion)
        2. 6.4.3.2. North America Concrete Plasticizers Market, by Type, 2016 – 2026 (Kilo Tons)
      4. 6.4.4. North America Concrete Plasticizers Market, by Form, 2016 – 2026 (Kilo Tons)
        1. 6.4.4.1. North America Concrete Plasticizers Market, by Form, 2016 – 2026 (USD Billion)
        2. 6.4.4.2. North America Concrete Plasticizers Market, by Form, 2016 – 2026 (Kilo Tons)
      5. 6.4.5. North America Concrete Plasticizers Market, by Application, 2016 – 2026 (Kilo Tons)
        1. 6.4.5.1. North America Concrete Plasticizers Market, by Application, 2016 – 2026 (USD Billion)
        2. 6.4.5.2. North America Concrete Plasticizers Market, by Application, 2016 – 2026 (Kilo Tons)
      6. 6.4.6. North America Concrete Plasticizers Market, by End-Users, 2016 – 2026 (Kilo Tons)
        1. 6.4.6.1. North America Concrete Plasticizers Market, by End-Users, 2016 – 2026 (USD Billion)
        2. 6.4.6.2. North America Concrete Plasticizers Market, by End-Users, 2016 – 2026 (Kilo Tons)
      7. 6.4.7. U.S.
        1. 6.4.7.1. U.S. Concrete Plasticizers Market, 2016 – 2026 (USD Billion)
        2. 6.4.7.2. U.S. Concrete Plasticizers Market, 2016 – 2026 (Kilo Tons)
      8. 6.4.8. Canada
        1. 6.4.8.1. Canada Concrete Plasticizers Market, 2016 – 2026 (USD Billion)
        2. 6.4.8.2. Canada Concrete Plasticizers Market, 2016 – 2026 (Kilo Tons)
    5. 6.5. Europe
      1. 6.5.1. Europe Concrete Plasticizers Market, 2016 – 2026 (USD Billion)
        1. 6.5.1.1. Europe Concrete Plasticizers Market, by Country, 2016 – 2026 (USD Billion)
      2. 6.5.2. Europe Market, 2016 – 2026 (Kilo Tons)
        1. 6.5.2.1. Europe Concrete Plasticizers Market, by Country, 2016 – 2026 (Kilo Tons)
      3. 6.5.3. Europe Concrete Plasticizers Market, by Type, 2016 – 2026 (Kilo Tons)
        1. 6.5.3.1. Europe Concrete Plasticizers Market, by Type, 2016 – 2026 (USD Billion)
        2. 6.5.3.2. Europe Concrete Plasticizers Market, by Type, 2016 – 2026 (Kilo Tons)
      4. 6.5.4. Europe Concrete Plasticizers Market, by Form, 2016 – 2026 (Kilo Tons)
        1. 6.5.4.1. Europe Concrete Plasticizers Market, by Form, 2016 – 2026 (USD Billion)
        2. 6.5.4.2. Europe Concrete Plasticizers Market, by Form, 2016 – 2026 (Kilo Tons)
      5. 6.5.5. Europe Concrete Plasticizers Market, by Application, 2016 – 2026 (Kilo Tons)
        1. 6.5.5.1. Europe Concrete Plasticizers Market, by Application, 2016 – 2026 (USD Billion)
        2. 6.5.5.2. Europe Concrete Plasticizers Market, by Application, 2016 – 2026 (Kilo Tons)
      6. 6.5.6. Europe Concrete Plasticizers Market, by End-Users, 2016 – 2026 (Kilo Tons)
        1. 6.5.6.1. Europe Concrete Plasticizers Market, by End-Users, 2016 – 2026 (USD Billion)
        2. 6.5.6.2. Europe Concrete Plasticizers Market, by End-Users, 2016 – 2026 (Kilo Tons)
      7. 6.5.7. Germany
        1. 6.5.7.1. Germany Concrete Plasticizers Market, 2016 – 2026 (USD Billion)
        2. 6.5.7.2. Germany Concrete Plasticizers Market, 2016 – 2026 (Kilo Tons)
      8. 6.5.8. France
        1. 6.5.8.1. France Concrete Plasticizers Market, 2016 – 2026 (USD Billion)
        2. 6.5.8.2. France Concrete Plasticizers Market, 2016 – 2026 (Kilo Tons)
          1. 6.5.9. U.K.
            1. 6.5.9.1. U.K. Concrete Plasticizers Market, 2016 – 2026 (USD Billion)
            2. 6.5.9.2. U.K. Concrete Plasticizers Market, 2016 – 2026 (Kilo Tons)
      9. 6.5.10. Italy
        1. 6.5.10.1. Italy Concrete Plasticizers Market, 2016 – 2026 (USD Billion)
        2. 6.5.10.2. Italy Concrete Plasticizers Market, 2016 – 2026 (Kilo Tons)
      10. 6.5.11. Spain
        1. 6.5.11.1. Spain Concrete Plasticizers Market, 2016 – 2026 (USD Billion)
        2. 6.5.11.2. Spain Concrete Plasticizers Market, 2016 – 2026 (Kilo Tons)
      11. 6.5.12. Rest of Europe
        1. 6.5.12.1. Rest of Europe Concrete Plasticizers Market, 2016 – 2026 (USD Billion)
        2. 6.5.12.2. Rest of Europe Concrete Plasticizers Market, 2016 – 2026 (Kilo Tons)
    6. 6.6. Asia Pacific
      1. 6.6.1. Asia Pacific Concrete Plasticizers Market, 2016 – 2026 (USD Billion)
        1. 6.6.1.1. Asia Pacific Concrete Plasticizers Market, by Country, 2016 – 2026 (USD Billion)
      2. 6.6.2. Asia Pacific Market, 2016 – 2026 (Kilo Tons)
        1. 6.6.2.1. Asia Pacific Concrete Plasticizers Market, by Country, 2016 – 2026 (Kilo Tons)
      3. 6.6.3. Asia Pacific Concrete Plasticizers Market, by Type, 2016 – 2026 (Kilo Tons)
        1. 6.6.3.1. Asia Pacific Concrete Plasticizers Market, by Type, 2016 – 2026 (USD Billion)
        2. 6.6.3.2. Asia Pacific Concrete Plasticizers Market, by Type, 2016 – 2026 (Kilo Tons)
      4. 6.6.4. Asia Pacific Concrete Plasticizers Market, by Form, 2016 – 2026 (Kilo Tons)
        1. 6.6.4.1. Asia Pacific Concrete Plasticizers Market, by Form, 2016 – 2026 (USD Billion)
        2. 6.6.4.2. Asia Pacific Concrete Plasticizers Market, by Form, 2016 – 2026 (Kilo Tons)
      5. 6.6.5. Asia Pacific Concrete Plasticizers Market, by Application, 2016 – 2026 (Kilo Tons)
        1. 6.6.5.1. Asia Pacific Concrete Plasticizers Market, by Application, 2016 – 2026 (USD Billion)
        2. 6.6.5.2. Asia Pacific Concrete Plasticizers Market, by Application, 2016 – 2026 (Kilo Tons)
      6. 6.6.6. Asia Pacific Concrete Plasticizers Market, by End-Users, 2016 – 2026 (Kilo Tons)
        1. 6.6.6.1. Asia Pacific Concrete Plasticizers Market, by End-Users, 2016 – 2026 (USD Billion)
        2. 6.6.6.2. Asia Pacific Concrete Plasticizers Market, by End-Users, 2016 – 2026 (Kilo Tons)
      7. 6.6.7. China
        1. 6.6.7.1. China Concrete Plasticizers Market, 2016 – 2026 (USD Billion)
        2. 6.6.7.2. China Concrete Plasticizers Market, 2016 – 2026 (Kilo Tons)
      8. 6.6.8. Japan
        1. 6.6.8.1. Japan Concrete Plasticizers Market, 2016 – 2026 (USD Billion)
        2. 6.6.8.2. Japan Concrete Plasticizers Market, 2016 – 2026 (Kilo Tons)
      9. 6.6.9. India
        1. 6.6.9.1. India Concrete Plasticizers Market, 2016 – 2026 (USD Billion)
        2. 6.6.9.2. India Concrete Plasticizers Market, 2016 – 2026 (Kilo Tons)
      10. 6.6.10. South Korea
        1. 6.6.10.1. South Korea Concrete Plasticizers Market, 2016 – 2026 (USD Billion)
        2. 6.6.10.2. South Korea Concrete Plasticizers Market, 2016 – 2026 (Kilo Tons)
      11. 6.6.11. South-East Asia
        1. 6.6.11.1. South-East Asia Concrete Plasticizers Market, 2016 – 2026 (USD Billion)
        2. 6.6.11.2. South-East Asia Concrete Plasticizers Market, 2016 – 2026 (Kilo Tons)
      12. 6.6.12. Rest of Asia Pacific
        1. 6.6.12.1. Rest of Asia Pacific Concrete Plasticizers Market, 2016 – 2026 (USD Billion)
        2. 6.6.12.2. Rest of Asia Pacific Concrete Plasticizers Market, 2016 – 2026 (Kilo Tons)
    7. 6.7. Latin America
      1. 6.7.1. Latin America Concrete Plasticizers Market, 2016 – 2026 (USD Billion)
        1. 6.7.1.1. Latin America Concrete Plasticizers Market, by Country, 2016 – 2026 (USD Billion)
      2. 6.7.2. Latin America Market, 2016 – 2026 (Kilo Tons)
        1. 6.7.2.1. Latin America Concrete Plasticizers Market, by Country, 2016 – 2026 (Kilo Tons)
      3. 6.7.3. Latin America Concrete Plasticizers Market, by Type, 2016 – 2026 (Kilo Tons)
        1. 6.7.3.1. Latin America Concrete Plasticizers Market, by Type, 2016 – 2026 (USD Billion)
        2. 6.7.3.2. Latin America Concrete Plasticizers Market, by Type, 2016 – 2026 (Kilo Tons)
      4. 6.7.4. Latin America Concrete Plasticizers Market, by Form, 2016 – 2026 (Kilo Tons)
        1. 6.7.4.1. Latin America Concrete Plasticizers Market, by Form, 2016 – 2026 (USD Billion)
        2. 6.7.4.2. Latin America Concrete Plasticizers Market, by Form, 2016 – 2026 (Kilo Tons)
      5. 6.7.5. Latin America Concrete Plasticizers Market, by Application, 2016 – 2026 (Kilo Tons)
        1. 6.7.5.1. Latin America Concrete Plasticizers Market, by Application, 2016 – 2026 (USD Billion)
        2. 6.7.5.2. Latin America Concrete Plasticizers Market, by Application, 2016 – 2026 (Kilo Tons)
      6. 6.7.6. Latin America Concrete Plasticizers Market, by End-Users, 2016 – 2026 (Kilo Tons)
        1. 6.7.6.1. Latin America Concrete Plasticizers Market, by End-Users, 2016 – 2026 (USD Billion)
        2. 6.7.6.2. Latin America Concrete Plasticizers Market, by End-Users, 2016 – 2026 (Kilo Tons)
      7. 6.7.7. Brazil
        1. 6.7.7.1. Brazil Concrete Plasticizers Market, 2016 – 2026 (USD Billion)
        2. 6.7.7.2. Brazil Concrete Plasticizers Market, 2016 – 2026 (Kilo Tons)
      8. 6.7.8. Mexico
        1. 6.7.8.1. Mexico Concrete Plasticizers Market, 2016 – 2026 (USD Billion)
        2. 6.7.8.2. Mexico Concrete Plasticizers Market, 2016 – 2026 (Kilo Tons)
      9. 6.7.9. Rest of Latin America
        1. 6.7.9.1. Rest of Latin America Concrete Plasticizers Market, 2016 – 2026 (USD Billion)
        2. 6.7.9.2. Rest of Latin America Concrete Plasticizers Market, 2016 – 2026 (Kilo Tons)
    8. 6.8. The Middle-East and Africa
      1. 6.8.1. The Middle-East and Africa Concrete Plasticizers Market, 2016 – 2026 (USD Billion)
        1. 6.8.1.1. The Middle-East and Africa Concrete Plasticizers Market, by Country, 2016 – 2026 (USD Billion)
      2. 6.8.2. The Middle-East and Africa Market, 2016 – 2026 (Kilo Tons)
        1. 6.8.2.1. The Middle-East and Africa Concrete Plasticizers Market, by Country, 2016 – 2026 (Kilo Tons)
      3. 6.8.3. The Middle-East and Africa Concrete Plasticizers Market, by Type, 2016 – 2026 (Kilo Tons)
        1. 6.8.3.1. The Middle-East and Africa Concrete Plasticizers Market, by Type, 2016 – 2026 (USD Billion)
        2. 6.8.3.2. The Middle-East and Africa Concrete Plasticizers Market, by Type, 2016 – 2026 (Kilo Tons)
      4. 6.8.4. The Middle-East and Africa Concrete Plasticizers Market, by Form, 2016 – 2026 (Kilo Tons)
        1. 6.8.4.1. The Middle-East and Africa Concrete Plasticizers Market, by Form, 2016 – 2026 (USD Billion)
        2. 6.8.4.2. The Middle-East and Africa Concrete Plasticizers Market, by Form, 2016 – 2026 (Kilo Tons)
      5. 6.8.5. The Middle-East and Africa Concrete Plasticizers Market, by Application, 2016 – 2026 (Kilo Tons)
        1. 6.8.5.1. The Middle-East and Africa Concrete Plasticizers Market, by Application, 2016 – 2026 (USD Billion)
        2. 6.8.5.2. The Middle-East and Africa Concrete Plasticizers Market, by Application, 2016 – 2026 (Kilo Tons)
      6. 6.8.6. The Middle-East and Africa Concrete Plasticizers Market, by End-Users, 2016 – 2026 (Kilo Tons)
        1. 6.8.6.1. The Middle-East and Africa Concrete Plasticizers Market, by End-Users, 2016 – 2026 (USD Billion)
        2. 6.8.6.2. The Middle-East and Africa Concrete Plasticizers Market, by End-Users, 2016 – 2026 (Kilo Tons)
      7. 6.8.7. GCC Countries
        1. 6.8.7.1. GCC Countries Concrete Plasticizers Market, 2016 – 2026 (USD Billion)
        2. 6.8.7.2. GCC Countries Concrete Plasticizers Market, 2016 – 2026 (Kilo Tons)
      8. 6.8.8. South Africa
        1. 6.8.8.1. South Africa Concrete Plasticizers Market, 2016 – 2026 (USD Billion)
        2. 6.8.8.2. South Africa Concrete Plasticizers Market, 2016 – 2026 (Kilo Tons)
      9. 6.8.9. Rest of Middle-East Africa
        1. 6.8.9.1. Rest of Middle-East Africa Concrete Plasticizers Market, 2016 – 2026 (USD Billion)
        2. 6.8.9.2. Rest of Middle-East Africa Concrete Plasticizers Market, 2016 – 2026 (Kilo Tons)
  7. Chapter 7 Concrete Plasticizers Production, Consumption, Export, Import by Regions
    1. 7.1. Global Concrete Plasticizers Production and Consumption, 2016 – 2026 (Kilo Tons)
    2. 7.2. Global Import and Export Analysis, by Region
  8. Chapter 8 Concrete Plasticizers Market – Competitive Landscape
    1. 8.1. Competitor Market Share – Revenue
    2. 8.2. Market Concentration Rate Analysis, Top 3 and Top 5 Players
    3. 8.3. Competitor Market Share – Volume
    4. 8.4. Strategic Developments
      1. 8.4.1. Acquisitions and Mergers
      2. 8.4.2. New Products
      3. 8.4.3. Research & Development Activities
  9. Chapter 9 Company Profiles
    1. 9.1. Arkema
      1. 9.1.1. Company Overview
      2. 9.1.2. Product/Service Portfolio
      3. 9.1.3. Arkema Sales, Revenue, Price, and Gross Margin
      4. 9.1.4. Arkema Revenue and Growth Rate
      5. 9.1.5. Arkema Market Share
      6. 9.1.6. Recent Initiatives, Funding/VC Activities, and Technological Innovations
    2. 9.2. Sika
      1. 9.2.1. Company Overview
      2. 9.2.2. Product/Service Portfolio
      3. 9.2.3. Sika Sales, Revenue, Price, and Gross Margin
      4. 9.2.4. Sika Revenue and Growth Rate
      5. 9.2.5. Sika Market Share
      6. 9.2.6. Recent Initiatives, Funding/VC Activities, and Technological Innovations
    3. 9.3. BASF
      1. 9.3.1. Company Overview
      2. 9.3.2. Product/Service Portfolio
      3. 9.3.3. BASF Sales, Revenue, Price, and Gross Margin
      4. 9.3.4. BASF Revenue and Growth Rate
      5. 9.3.5. BASF Market Share
      6. 9.3.6. Recent Initiatives, Funding/VC Activities, and Technological Innovations
    4. 9.4. GCP Applied Technologies
      1. 9.4.1. Company Overview
      2. 9.4.2. Product/Service Portfolio
      3. 9.4.3. GCP Applied Technologies Sales, Revenue, Price, and Gross Margin
      4. 9.4.4. GCP Applied Technologies Revenue and Growth Rate
      5. 9.4.5. GCP Applied Technologies Market Share
      6. 9.4.6. Recent Initiatives, Funding/VC Activities, and Technological Innovations
    5. 9.5. Mapei
      1. 9.5.1. Company Overview
      2. 9.5.2. Product/Service Portfolio
      3. 9.5.3. Mapei Sales, Revenue, Price, and Gross Margin
      4. 9.5.4. Mapei Revenue and Growth Rate
      5. 9.5.5. Mapei Market Share
      6. 9.5.6. Recent Initiatives, Funding/VC Activities, and Technological Innovations
    6. 9.6. Kao Corporation
      1. 9.6.1. Company Overview
      2. 9.6.2. Product/Service Portfolio
      3. 9.6.3. Kao Corporation Sales, Revenue, Price, and Gross Margin
      4. 9.6.4. Kao Corporation Revenue and Growth Rate
      5. 9.6.5. Kao Corporation Market Share
      6. 9.6.6. Recent Initiatives, Funding/VC Activities, and Technological Innovations
    7. 9.7. Enaspol
      1. 9.7.1. Company Overview
      2. 9.7.2. Product/Service Portfolio
      3. 9.7.3. Enaspol Sales, Revenue, Price, and Gross Margin
      4. 9.7.4. Enaspol Revenue and Growth Rate
      5. 9.7.5. Enaspol Market Share
      6. 9.7.6. Recent Initiatives, Funding/VC Activities, and Technological Innovations
    8. 9.8. Concrete Additives and Chemical
      1. 9.8.1. Company Overview
      2. 9.8.2. Product/Service Portfolio
      3. 9.8.3. Concrete Additives and Chemical Sales, Revenue, Price, and Gross Margin
      4. 9.8.4. Concrete Additives and Chemical Revenue and Growth Rate
      5. 9.8.5. Concrete Additives and Chemical Market Share
      6. 9.8.6. Recent Initiatives, Funding/VC Activities, and Technological Innovations
    9. 9.9. Rhein-Chemotechnik
      1. 9.9.1. Company Overview
      2. 9.9.2. Product/Service Portfolio
      3. 9.9.3. Rhein-Chemotechnik Sales, Revenue, Price, and Gross Margin
      4. 9.9.4. Rhein-Chemotechnik Revenue and Growth Rate
      5. 9.9.5. Rhein-Chemotechnik Market Share
      6. 9.9.6. Recent Initiatives, Funding/VC Activities, and Technological Innovations
    10. 9.10. Rain Carbon
      1. 9.10.1. Company Overview
      2. 9.10.2. Product/Service Portfolio
      3. 9.10.3. Rain Carbon Sales, Revenue, Price, and Gross Margin
      4. 9.10.4. Rain Carbon Revenue and Growth Rate
      5. 9.10.5. Rain Carbon Market Share
      6. 9.10.6. Recent Initiatives, Funding/VC Activities, and Technological Innovations
    11. 9.11. The Euclid Chemical Company
      1. 9.11.1. Company Overview
      2. 9.11.2. Product/Service Portfolio
      3. 9.11.3. The Euclid Chemical Company Sales, Revenue, Price, and Gross Margin
      4. 9.11.4. The Euclid Chemical Company Revenue and Growth Rate
      5. 9.11.5. The Euclid Chemical Company Market Share
      6. 9.11.6. Recent Initiatives, Funding/VC Activities, and Technological Innovations
    12. 9.12. Shandong Wanshan Chemical Co. Ltd
      1. 9.12.1. Company Overview
      2. 9.12.2. Product/Service Portfolio
      3. 9.12.3. Shandong Wanshan Chemical Co. Ltd Sales, Revenue, Price, and Gross Margin
      4. 9.12.4. Shandong Wanshan Chemical Co. Ltd Revenue and Growth Rate
      5. 9.12.5. Shandong Wanshan Chemical Co. Ltd Market Share
      6. 9.12.6. Recent Initiatives, Funding/VC Activities, and Technological Innovations
    13. 9.13. Fosroc Inc
      1. 9.13.1. Company Overview
      2. 9.13.2. Product/Service Portfolio
      3. 9.13.3. Fosroc Inc Sales, Revenue, Price, and Gross Margin
      4. 9.13.4. Fosroc Inc Revenue and Growth Rate
      5. 9.13.5. Fosroc Inc Market Share
      6. 9.13.6. Recent Initiatives, Funding/VC Activities, and Technological Innovations
    14. 9.14. ZheJiang LangYa Concrete Admixture Inc
      1. 9.14.1. Company Overview
      2. 9.14.2. Product/Service Portfolio
      3. 9.14.3. ZheJiang LangYa Concrete Admixture Inc Sales, Revenue, Price, and Gross Margin
      4. 9.14.4. ZheJiang LangYa Concrete Admixture Inc Revenue and Growth Rate
      5. 9.14.5. ZheJiang LangYa Concrete Admixture Inc Market Share
      6. 9.14.6. Recent Initiatives, Funding/VC Activities, and Technological Innovations
  10. Chapter 10 Concrete Plasticizers — Industry Analysis
    1. 10.1. Introduction and Taxonomy
    2. 10.2. Concrete Plasticizers Market – Key Trends
      1. 10.2.1. Market Drivers
      2. 10.2.2. Market Restraints
      3. 10.2.3. Market Opportunities
    3. 10.3. Value Chain Analysis
    4. 10.4. Key Mandates and Regulations
    5. 10.5. Technology Roadmap and Timeline
    6. 10.6. Concrete Plasticizers Market – Attractiveness Analysis
      1. 10.6.1. By Type
      2. 10.6.2. By Form
      3. 10.6.3. By Application
      4. 10.6.4. By End-Users
      5. 10.6.5. By Region
  11. Chapter 11 Raw Material Analysis
    1. 11.1. Concrete Plasticizers Key Raw Material Analysis
      1. 11.1.1. Key Raw Materials
      2. 11.1.2. Price Trend of Key Raw Materials
    2. 11.2. Key Suppliers of Raw Materials
    3. 11.3. Proportion of Manufacturing Cost Structure
      1. 11.3.1. Raw Materials Cost
      2. 11.3.2. Labor Cost
      3. 11.3.3. Manufacturing Expenses
      4. 11.3.4. Miscellaneous Expenses
    4. 11.4. Manufacturing Cost Analysis of Concrete Plasticizers
  12. Chapter 12 Industrial Chain, Sourcing Strategy, and Downstream Buyers
    1. 12.1. Concrete Plasticizers Industrial Chain Analysis
    2. 12.2. Upstream Raw Materials Sourcing
      1. 12.2.1. Risk Mitigation:
      2. 12.2.2. Supplier Relationships:
      3. 12.2.3. Business Processes:
      4. 12.2.4. Securing the Product:
    3. 12.3. Raw Materials Sources of Concrete Plasticizers Major Manufacturers
    4. 12.4. Downstream Buyers
    5. 12.5. Distributors/Traders List
  13. Chapter 13 Marketing Strategy Analysis, Distributors
    1. 13.1. Marketing Channel
    2. 13.2. Direct Marketing
    3. 13.3. Indirect Marketing
    4. 13.4. Marketing Channel Development Trends
    5. 13.5. Economic/Political Environmental Change
  14. Chapter 14 Report Conclusion & Key Insights
    1. 14.1. Key Insights from Primary Interviews & Surveys Respondents
    2. 14.2. Key Takeaways from Analysts, Consultants, and Industry Leaders
  15. Chapter 15 Research Approach & Methodology
    1. 15.1. Report Description
    2. 15.2. Research Scope
    3. 15.3. Research Methodology
      1. 15.3.1. Secondary Research
      2. 15.3.2. Primary Research
      3. 15.3.3. Statistical Models
        1. 15.3.3.1. Company Share Analysis Model
        2. 15.3.3.2. Revenue Based Modeling
      4. 15.3.4. Research Limitations

      List of Figures

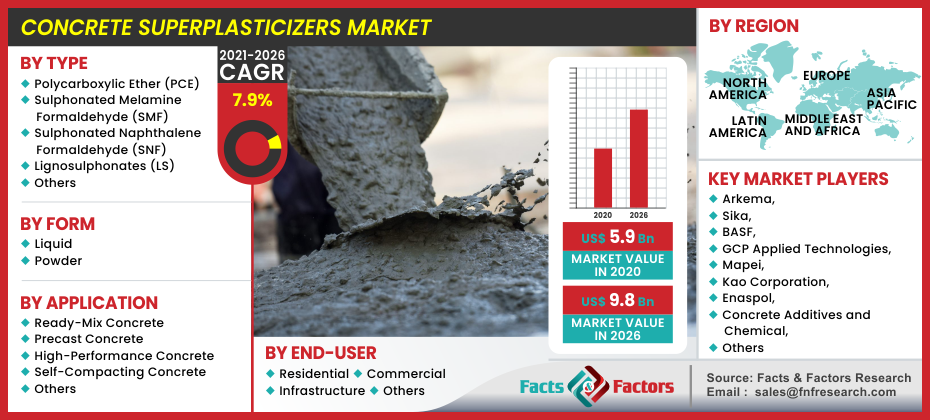
      Fig.1	Product Picture of Concrete Plasticizers
      Fig.2	Global Concrete Plasticizers  Market, 2016 – 2026 (USD Billion)
      Fig.3	Global Concrete Plasticizers  Market, 2016 – 2026 (Kilo Tons)
      Fig.4	Global Concrete Plasticizers  Market Absolute Revenue Opportunity, 2016 – 2026 (USD Billion)
      Fig.5	Global Concrete Plasticizers  Market Incremental Revenue Opportunity, 2020 – 2026 (USD Billion)
      Fig.6	Global Concrete Plasticizers  Market Share, by Type, 2020 & 2026 (USD Billion)
      Fig.7	Global Concrete Plasticizers  Market Share, by Type, 2020 & 2026 (Kilo Tons)
      Fig.8	Global Polycarboxylic Ether (PCE) Concrete Plasticizers  Market, 2016 – 2026 (USD Billion)
      Fig.9	Global Polycarboxylic Ether (PCE) Concrete Plasticizers  Market, 2016 – 2026 (Kilo Tons)
      Fig.10	Global Sulphonated Melamine Formaldehyde (SMF) Concrete Plasticizers  Market, 2016 – 2026 (USD Billion)
      Fig.11	Global Sulphonated Melamine Formaldehyde (SMF) Concrete Plasticizers  Market, 2016 – 2026 (Kilo Tons)
      Fig.12	Global Sulphonated Naphthalene Formaldehyde (SNF) Concrete Plasticizers  Market, 2016 – 2026 (USD Billion)
      Fig.13	Global Sulphonated Naphthalene Formaldehyde (SNF) Concrete Plasticizers  Market, 2016 – 2026 (Kilo Tons)
      Fig.14	Global Lignosulphonates (LS) Concrete Plasticizers  Market, 2016 – 2026 (USD Billion)
      Fig.15	Global Lignosulphonates (LS) Concrete Plasticizers  Market, 2016 – 2026 (Kilo Tons)
      Fig.16	Global Others Concrete Plasticizers  Market, 2016 – 2026 (USD Billion)
      Fig.17	Global Others Concrete Plasticizers  Market, 2016 – 2026 (Kilo Tons)
      Fig.18	Global Concrete Plasticizers  Market Share, by Form, 2020 & 2026 (USD Billion)
      Fig.19	Global Concrete Plasticizers  Market Share, by Form, 2020 & 2026 (Kilo Tons)
      Fig.20	Global Liquid Concrete Plasticizers  Market, 2016 – 2026 (USD Billion)
      Fig.21	Global Liquid Concrete Plasticizers  Market, 2016 – 2026 (Kilo Tons)
      Fig.22	Global Powder Concrete Plasticizers  Market, 2016 – 2026 (USD Billion)
      Fig.23	Global Powder Concrete Plasticizers  Market, 2016 – 2026 (Kilo Tons)
      Fig.24	Global Concrete Plasticizers  Market Share, by Application, 2020 & 2026 (USD Billion)
      Fig.25	Global Concrete Plasticizers  Market Share, by Application, 2020 & 2026 (Kilo Tons)
      Fig.26	Global Ready-Mix Concrete Concrete Plasticizers  Market, 2016 – 2026 (USD Billion)
      Fig.27	Global Ready-Mix Concrete Concrete Plasticizers  Market, 2016 – 2026 (Kilo Tons)
      Fig.28	Global Precast Concrete Concrete Plasticizers  Market, 2016 – 2026 (USD Billion)
      Fig.29	Global Precast Concrete Concrete Plasticizers  Market, 2016 – 2026 (Kilo Tons)
      Fig.30	Global High Performance Concrete Concrete Plasticizers  Market, 2016 – 2026 (USD Billion)
      Fig.31	Global High Performance Concrete Concrete Plasticizers  Market, 2016 – 2026 (Kilo Tons)
      Fig.32	Global Self-Compacting Concrete Concrete Plasticizers  Market, 2016 – 2026 (USD Billion)
      Fig.33	Global Self-Compacting Concrete Concrete Plasticizers  Market, 2016 – 2026 (Kilo Tons) 
      Fig.34	Global Others Concrete Plasticizers  Market, 2016 – 2026 (USD Billion)
      Fig.35	Global Others Concrete Plasticizers  Market, 2016 – 2026 (Kilo Tons)
      Fig.36	Global Concrete Plasticizers  Market Share, by End-Users, 2020 & 2026 (USD Billion)
      Fig.37	Global Concrete Plasticizers  Market Share, by End-Users, 2020 & 2026 (Kilo Tons)
      Fig.38	Global Residential Concrete Plasticizers  Market, 2016 – 2026 (USD Billion)
      Fig.39	Global Residential Concrete Plasticizers  Market, 2016 – 2026 (Kilo Tons)
      Fig.40	Global Commercial  Concrete Plasticizers  Market, 2016 – 2026 (USD Billion)
      Fig.41	Global Commercial  Concrete Plasticizers  Market, 2016 – 2026 (Kilo Tons)
      Fig.42	Global Infrastructure  Concrete Plasticizers  Market, 2016 – 2026 (USD Billion)
      Fig.43	Global Infrastructure  Concrete Plasticizers  Market, 2016 – 2026 (Kilo Tons)
      Fig.44	Global Other Concrete Plasticizers  Market, 2016 – 2026 (USD Billion)
      Fig.45	Global Other Concrete Plasticizers  Market, 2016 – 2026 (Kilo Tons)
      Fig.46	Global Concrete Plasticizers  Market Share, by Region, 2020 & 2026 (USD Billion)
      Fig.47	Global Concrete Plasticizers  Market Share, by Region, 2020 & 2026 (Kilo Tons)
      Fig.48	North America Concrete Plasticizers  Market, 2016 – 2026 (USD Billion)
      Fig.49	North America Concrete Plasticizers  Market, 2016 – 2026 (Kilo Tons) 
      Fig.50	U.S. Concrete Plasticizers  Market, 2016 – 2026 (USD Billion)
      Fig.51	U.S. Concrete Plasticizers   Market, 2016 – 2026 (Kilo Tons)
      Fig.52	Canada Concrete Plasticizers  Market, 2016 – 2026 (USD Billion)
      Fig.53	Canada Concrete Plasticizers   Market, 2016 – 2026 (Kilo Tons)
      Fig.54	Europe Concrete Plasticizers  Market, 2016 – 2026 (USD Billion)
      Fig.55	Europe Concrete Plasticizers  Market, 2016 – 2026 (Kilo Tons)
      Fig.56	Germany Concrete Plasticizers  Market, 2016 – 2026 (USD Billion)
      Fig.57	Germany Concrete Plasticizers   Market, 2016 – 2026 (Kilo Tons)
      Fig.58	France Concrete Plasticizers  Market, 2016 – 2026 (USD Billion)
      Fig.59	France Concrete Plasticizers   Market, 2016 – 2026 (Kilo Tons)
      Fig.60	U.K. Concrete Plasticizers  Market, 2016 – 2026 (USD Billion)
      Fig.61	U.K. Concrete Plasticizers   Market, 2016 – 2026 (Kilo Tons)
      Fig.62	Italy Concrete Plasticizers  Market, 2016 – 2026 (USD Billion)
      Fig.63	Italy Concrete Plasticizers   Market, 2016 – 2026 (Kilo Tons)
      Fig.64	Spain Concrete Plasticizers  Market, 2016 – 2026 (USD Billion)
      Fig.65	Spain Concrete Plasticizers   Market, 2016 – 2026 (Kilo Tons)
      Fig.66	Rest of Europe Concrete Plasticizers  Market, 2016 – 2026 (USD Billion)
      Fig.67	Rest of Europe Concrete Plasticizers   Market, 2016 – 2026 (Kilo Tons)
      Fig.68	Asia Pacific Concrete Plasticizers  Market, 2016 – 2026 (USD Billion)
      Fig.69	Asia Pacific Concrete Plasticizers  Market, 2016 – 2026 (Kilo Tons)
      Fig.70	China Concrete Plasticizers  Market, 2016 – 2026 (USD Billion)
      Fig.71	China Concrete Plasticizers   Market, 2016 – 2026 (Kilo Tons)
      Fig.72	Japan Concrete Plasticizers  Market, 2016 – 2026 (USD Billion)
      Fig.73	Japan Concrete Plasticizers   Market, 2016 – 2026 (Kilo Tons)
      Fig.74	India Concrete Plasticizers  Market, 2016 – 2026 (USD Billion)
      Fig.75	India Concrete Plasticizers   Market, 2016 – 2026 (Kilo Tons)
      Fig.76	South  Korea Concrete Plasticizers  Market, 2016 – 2026 (USD Billion)
      Fig.77	South  Korea Concrete Plasticizers   Market, 2016 – 2026 (Kilo Tons)
      Fig.78	South-East Asia Concrete Plasticizers  Market, 2016 – 2026 (USD Billion)
      Fig.79	South-East Asia Concrete Plasticizers   Market, 2016 – 2026 (Kilo Tons)
      Fig.80	Rest of Asia Pacific Concrete Plasticizers  Market, 2016 – 2026 (USD Billion)
      Fig.81	Rest of Asia Pacific Concrete Plasticizers   Market, 2016 – 2026 (Kilo Tons)
      Fig.82	Latin America Concrete Plasticizers  Market, 2016 – 2026 (USD Billion)
      Fig.83	Latin America Concrete Plasticizers  Market, 2016 – 2026 (Kilo Tons)
      Fig.84	Brazil Concrete Plasticizers  Market, 2016 – 2026 (USD Billion)
      Fig.85	Brazil Concrete Plasticizers   Market, 2016 – 2026 (Kilo Tons)
      Fig.86	Mexico Concrete Plasticizers  Market, 2016 – 2026 (USD Billion)
      Fig.87	Mexico Concrete Plasticizers   Market, 2016 – 2026 (Kilo Tons)
      Fig.88	Rest of Latin America Concrete Plasticizers  Market, 2016 – 2026 (USD Billion)
      Fig.89	Rest of Latin America Concrete Plasticizers   Market, 2016 – 2026 (Kilo Tons)
      Fig.90	The Middle-East and Africa Concrete Plasticizers  Market, 2016 – 2026 (USD Billion)
      Fig.91	The Middle-East and Africa Concrete Plasticizers  Market, 2016 – 2026 (Kilo Tons)
      Fig.92	GCC Countries Concrete Plasticizers  Market, 2016 – 2026 (USD Billion)
      Fig.93	GCC Countries Concrete Plasticizers   Market, 2016 – 2026 (Kilo Tons)
      Fig.94	South Africa Concrete Plasticizers  Market, 2016 – 2026 (USD Billion)
      Fig.95	South Africa Concrete Plasticizers   Market, 2016 – 2026 (Kilo Tons)
      Fig.96	Rest of Middle-East Africa Concrete Plasticizers  Market, 2016 – 2026 (USD Billion)
      Fig.97	Rest of Middle-East Africa Concrete Plasticizers   Market, 2016 – 2026 (Kilo Tons)
      Fig.98	Global Concrete Plasticizers  Production and Consumption, 2016 – 2026 (Kilo Tons)
      Fig.99	North America Concrete Plasticizers  Production and Consumption, 2016 – 2026 (USD Billion)
      Fig.100	Europe Concrete Plasticizers  Production and Consumption, 2016 – 2026 (USD Billion)
      Fig.101	Asia Pacific Concrete Plasticizers  Production and Consumption, 2016 – 2026 (USD Billion) 
      Fig.102	Latin America Concrete Plasticizers  Production and Consumption, 2016 – 2026 (USD Billion) 
      Fig.103	The Middle-East and Africa Concrete Plasticizers  Production and Consumption, 2016 – 2026 (USD Billion)
      Fig.104	Competitor Market Share – Revenue
      Fig.105	Competitor Market Share – Volume
      Fig.106	Arkema Revenue and Growth Rate
      Fig.107	Arkema Market Share
      Fig.108	Sika Revenue and Growth Rate
      Fig.109	Sika Market Share
      Fig.110	BASF Revenue and Growth Rate
      Fig.111	BASF Market Share
      Fig.112	GCP Applied Technologies Revenue and Growth Rate
      Fig.113	GCP Applied Technologies Market Share
      Fig.114	Mapei Revenue and Growth Rate
      Fig.115	Mapei Market Share
      Fig.116	Kao Corporation Revenue and Growth Rate
      Fig.117	Kao Corporation Market Share
      Fig.118	Enaspol Revenue and Growth Rate
      Fig.119	Enaspol Market Share
      Fig.120	Concrete Additives and Chemical Revenue and Growth Rate
      Fig.121	Concrete Additives and Chemical Market Share
      Fig.122	Rhein-Chemotechnik Revenue and Growth Rate
      Fig.123	Rhein-Chemotechnik Market Share
      Fig.124	Rain Carbon Revenue and Growth Rate
      Fig.125	Rain Carbon Market Share
      Fig.126	The Euclid Chemical Company Revenue and Growth Rate
      Fig.127	The Euclid Chemical Company Market Share
      Fig.128	Shandong Wanshan Chemical Co. Ltd Revenue and Growth Rate
      Fig.129	Shandong Wanshan Chemical Co. Ltd Market Share
      Fig.130	Fosroc Inc Revenue and Growth Rate
      Fig.131	Fosroc Inc Market Share
      Fig.132	ZheJiang LangYa Concrete Admixture Inc Revenue and Growth Rate
      Fig.133	ZheJiang LangYa Concrete Admixture Inc Market Share
      Fig.134	Market Dynamics
      Fig.135	Global Concrete Plasticizers  – Value Chain Analysis
      Fig.136	Key Mandates and Regulations
      Fig.137	Technology Roadmap and Timeline
      Fig.138	Market Attractiveness Analysis – By Type
      Fig.139	Market Attractiveness Analysis – By Form
      Fig.140	Market Attractiveness Analysis – By Application
      Fig.141	Market Attractiveness Analysis – By End-Users
      Fig.142	Market Attractiveness Analysis – By Region
      Fig.143	Manufacturing Cost Structure of Concrete Plasticizers
      Fig.144	Concrete Plasticizers  Industrial Chain Analysis
      Fig.145	Market Channels
      Fig.146	Marketing Channel Development Trend
      Fig.147	Growth in World Gross Product, 2008-2018
      

      List of Tables

      Table 1	Global Concrete Plasticizers  Market, 2020 & 2026 (USD Billion)
      Table 2	Global Concrete Plasticizers  Market, by Type, 2016 – 2026 (USD Billion)
      Table 3	Global Concrete Plasticizers  Market, by Type, 2016 – 2026 (Kilo Tons)
      Table 4	Global Concrete Plasticizers  Market, by Form, 2016 – 2026 (USD Billion)
      Table 5	Global Concrete Plasticizers  Market, by Form, 2016 – 2026 (Kilo Tons)
      Table 6	Global Concrete Plasticizers  Market, by Application, 2016 – 2026 (USD Billion)
      Table 7	Global Concrete Plasticizers  Market, by Application, 2016 – 2026 (Kilo Tons)
      Table 8	Global Concrete Plasticizers  Market, by End-Users, 2016 – 2026 (USD Billion)
      Table 9	Global Concrete Plasticizers  Market, by End-Users, 2016 – 2026 (Kilo Tons)
      Table 10 Global Concrete Plasticizers  Market, by Region, 2016 – 2026 (USD Billion)
      Table 11 Global Concrete Plasticizers  Market, by Region, 2016 – 2026 (Kilo Tons)
      Table 12 North America Concrete Plasticizers  Market, by Country, 2016 – 2026 (USD Billion)
      Table 13 North America Concrete Plasticizers  Market, by Country, 2016 – 2026 (Kilo Tons)
      Table 14 North America Concrete Plasticizers  Market, by Type, 2016 – 2026 (USD Billion)
      Table 15 North America Concrete Plasticizers  Market, by Type, 2016 – 2026 (Kilo Tons)
      Table 16 North America Concrete Plasticizers  Market, by Form, 2016 – 2026 (USD Billion)
      Table 17 North America Concrete Plasticizers  Market, by Form, 2016 – 2026 (Kilo Tons)
      Table 18 North America Concrete Plasticizers  Market, by Application, 2016 – 2026 (USD Billion)
      Table 19 North America Concrete Plasticizers  Market, by Application, 2016 – 2026 (Kilo Tons)
      Table 20 North America Concrete Plasticizers  Market, by End-Users, 2016 – 2026 (USD Billion)
      Table 21 North America Concrete Plasticizers  Market, by End-Users, 2016 – 2026 (Kilo Tons)
      Table 22 Europe Concrete Plasticizers  Market, by Country, 2016 – 2026 (USD Billion)
      Table 23 Europe Concrete Plasticizers  Market, by Country, 2016 – 2026 (Kilo Tons)
      Table 24 Europe Concrete Plasticizers  Market, by Type, 2016 – 2026 (USD Billion)
      Table 25 Europe Concrete Plasticizers  Market, by Type, 2016 – 2026 (Kilo Tons)
      Table 26 Europe Concrete Plasticizers  Market, by Form, 2016 – 2026 (USD Billion)
      Table 27 Europe Concrete Plasticizers  Market, by Form, 2016 – 2026 (Kilo Tons)
      Table 28 Europe Concrete Plasticizers  Market, by Application, 2016 – 2026 (USD Billion)
      Table 29 Europe Concrete Plasticizers  Market, by Application, 2016 – 2026 (Kilo Tons)
      Table 30 Europe Concrete Plasticizers  Market, by End-Users, 2016 – 2026 (USD Billion)
      Table 31 Europe Concrete Plasticizers  Market, by End-Users, 2016 – 2026 (Kilo Tons)
      Table 32 Asia Pacific Concrete Plasticizers  Market, by Country, 2016 – 2026 (USD Billion)
      Table 33 Asia Pacific Concrete Plasticizers  Market, by Country, 2016 – 2026 (Kilo Tons)
      Table 34 Asia Pacific Concrete Plasticizers  Market, by Type, 2016 – 2026 (USD Billion)
      Table 35 Asia Pacific Concrete Plasticizers  Market, by Type, 2016 – 2026 (Kilo Tons)
      Table 36 Asia Pacific Concrete Plasticizers  Market, by Form, 2016 – 2026 (USD Billion)
      Table 37 Asia Pacific Concrete Plasticizers  Market, by Form, 2016 – 2026 (Kilo Tons)
      Table 38 Asia Pacific Concrete Plasticizers  Market, by Application, 2016 – 2026 (USD Billion)
      Table 39 Asia Pacific Concrete Plasticizers  Market, by Application, 2016 – 2026 (Kilo Tons)
      Table 40 Asia Pacific Concrete Plasticizers  Market, by End-Users, 2016 – 2026 (USD Billion)
      Table 41 Asia Pacific Concrete Plasticizers  Market, by End-Users, 2016 – 2026 (Kilo Tons)
      Table 42 Latin America Concrete Plasticizers  Market, by Country, 2016 – 2026 (USD Billion)
      Table 43 Latin America Concrete Plasticizers  Market, by Country, 2016 – 2026 (Kilo Tons)
      Table 44 Latin America Concrete Plasticizers  Market, by Type, 2016 – 2026 (USD Billion)
      Table 45 Latin America Concrete Plasticizers  Market, by Type, 2016 – 2026 (Kilo Tons)
      Table 46 Latin America Concrete Plasticizers  Market, by Form, 2016 – 2026 (USD Billion)
      Table 47 Latin America Concrete Plasticizers  Market, by Form, 2016 – 2026 (Kilo Tons)
      Table 48 Latin America Concrete Plasticizers  Market, by Application, 2016 – 2026 (USD Billion)
      Table 49 Latin America Concrete Plasticizers  Market, by Application, 2016 – 2026 (Kilo Tons)
      Table 50 Latin America Concrete Plasticizers  Market, by End-Users, 2016 – 2026 (USD Billion)
      Table 51 Latin America Concrete Plasticizers  Market, by End-Users, 2016 – 2026 (Kilo Tons)
      Table 52 The Middle-East and Africa Concrete Plasticizers  Market, by Country, 2016 – 2026 (USD Billion)
      Table 53 The Middle-East and Africa Concrete Plasticizers  Market, by Country, 2016 – 2026 (Kilo Tons)
      Table 54 The Middle-East and Africa Concrete Plasticizers  Market, by Type, 2016 – 2026 (USD Billion)
      Table 55 The Middle-East and Africa Concrete Plasticizers  Market, by Type, 2016 – 2026 (Kilo Tons)
      Table 56 The Middle-East and Africa Concrete Plasticizers  Market, by Form, 2016 – 2026 (USD Billion)
      Table 57 The Middle-East and Africa Concrete Plasticizers  Market, by Form, 2016 – 2026 (Kilo Tons)
      Table 58 The Middle-East and Africa Concrete Plasticizers  Market, by Application, 2016 – 2026 (USD Billion)
      Table 59 The Middle-East and Africa Concrete Plasticizers  Market, by Application, 2016 – 2026 (Kilo Tons)
      Table 60 The Middle-East and Africa Concrete Plasticizers  Market, by End-Users, 2016 – 2026 (USD Billion)
      Table 61 The Middle-East and Africa Concrete Plasticizers  Market, by End-Users, 2016 – 2026 (Kilo Tons)
      Table 62 North America Concrete Plasticizers  Production, Consumption, Export, Import, 2016 – 2019
      Table 63 Europe Concrete Plasticizers  Production, Consumption, Export, Import, 2016 – 2019
      Table 64 Asia Pacific Concrete Plasticizers  Production, Consumption, Export, Import, 2016 – 2019
      Table 65 Latin America Concrete Plasticizers  Production, Consumption, Export, Import, 2016 – 2019
      Table 66 The Middle-East and Africa Concrete Plasticizers  Production, Consumption, Export, Import, 2016 – 2019
      Table 67 Global Concrete Plasticizers  Market - Company Revenue Analysis, 2016 – 2019 (USD Billion)
      Table 68 Global Concrete Plasticizers  Market - Company Revenue Share Analysis, 2016 – 2019 (%)
      Table 69 Global Concrete Plasticizers  Market - Company Volume Analysis, 2016 – 2019
      Table 70 Global Concrete Plasticizers  Market - Company Volume Share Analysis, 2016 – 2019 (%)
      Table 71 Acquisitions and Mergers
      Table 72 Market Drivers – Impact Analysis
      Table 73 Market Restraints
      Table 74 Market Opportunities
      Table 75 Production Base and Market Concentration Rate of Raw Material
      Table 76 Key Suppliers of Raw Materials
      Table 77 Raw Materials Sources of Concrete Plasticizers  Major Manufacturers
      Table 78 Major Buyers of Concrete Plasticizers
      Table 79 Distributors/Traders of Concrete Plasticizers  by Region
      

Industry Major Market Players

  • Arkema
  • Sika
  • BASF
  • GCP Applied Technologies
  • Mapei
  • Kao Corporation
  • Enaspol
  • Concrete Additives and Chemical
  • Rhein-Chemotechnik
  • Rain Carbon
  • The Euclid Chemical Company
  • Shandong Wanshan Chemical Co. Ltd.
  • Fosroc Inc.
  • ZheJiang LangYa Concrete Admixture Inc.