Search Market Research Report

Discover Our Latest Reports
Discover Our Featured Reports
Discover Top Selling Reports

Coconut Water Market Size, Share Global Analysis Report, 2020–2026

report img

Coconut Water Market By Variants (Natural, and Flavored), By Packaging (Paper and Paperboard, Metal, and Plastic), and By Distribution (Hypermarket And Supermarket, Convenience Stores, Specialty Stores, and Others): Global Industry Outlook, Market Size, Business Intelligence, Consumer Preferences, Statistical Surveys, Comprehensive Analysis, Historical Developments, Current Trends, and Forecast 2020–2026

Industry Insights

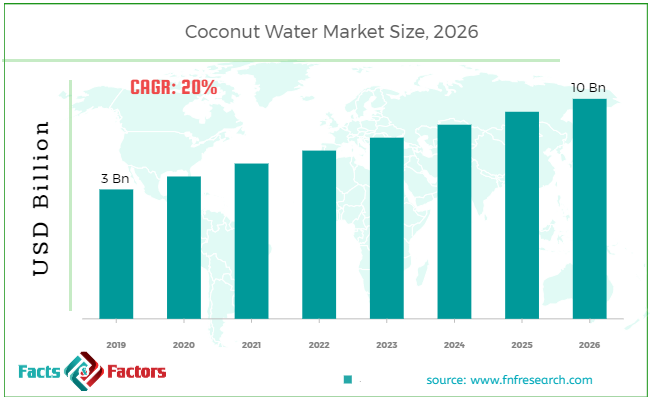
[195+ Pages Report] According to the report published by Facts Factors, the global coconut water market size was worth around USD 3 billion in 2019 and is predicted to grow to around USD 10 billion by 2026 with a compound annual growth rate (CAGR) of roughly 20% between 2020 and 2026. The report analyzes the global coconut water market drivers, restraints/challenges, and the effect they have on the demands during the projection period. In addition, the report explores emerging opportunities in the coconut water market.

Coconut Water Market Size

To know more about this report | Request Free Sample Copy

This specialized and expertise-oriented industry research report scrutinizes the technical and commercial business outlook of the coconut water industry. The report analyzes and declares the historical and current trends analysis of the coconut water industry and subsequently recommends the projected trends anticipated to be observed in the coconut water market during the upcoming years.

The coconut water market report analyzes and notifies the industry statistics at the global as well as regional and country levels in order to acquire a thorough perspective of the entire Coconut Water market. The historical and past insights are provided for FY 2016 to FY 2019 whereas projected trends are delivered for FY 2020 to FY 2026. The quantitative and numerical data is represented in terms of both volumes (Tons) and value (USD Billion) from FY 2016 – 2026.


logoKey Insights from Primary Research

  • It was acknowledged through the primary study that the global coconut water market was evaluated at around USD 3 Billion in 2019.
  • Based on distribution segmentation, the “Hypermarket And Supermarket” category held the top market share in 2019.
  • Europe leads the market for coconut water, due to the strong consumption of healthy products.
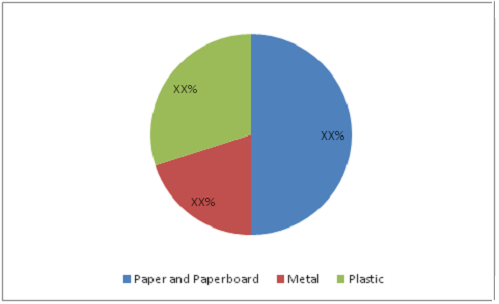
  • The “Paper and Paperboard” category, based on the packaging-based segmentation projected to become an important revenue-producing contributing category.

logoKey Recommendations from Analysts

  • As per our analysis, the coconut water industry across the globe is developing at a substantial rate. The paper and paperboard-based packaging category is projected to have a major share in the upcoming period due to its environment-friendly and less cost.
  • Based on the variant, natural coconut water is preferred to consume by the end consumers. The effectiveness of natural coconut water for the human body is estimated to fetch a significant demand.
  • Increasing at a CAGR of around 20%, the global coconut water market delivers several opportunities for all of the included stakeholders through the entire value chain.
  • Our analysts have acknowledged that the “Paper and Paperboard” and “Hypermarket And Supermarket” categories as the vital investment pockets for the coconut water market.
  • The growing trend of a healthy lifestyle and environment-friendly packaging generates significant market growth across the world.

logoCoconut Water Market Share 2018 – By Packaging

Coconut Water Market

To know more about this report | Request Free Sample Copy


The quantitative data is further underlined and reinforced by comprehensive qualitative data which comprises various across-the-board market dynamics. The rationales which directly or indirectly impact the coconut water industry are exemplified through parameters such as growth drivers, restraints, challenges, and opportunities among other impacting factors.

Throughout our research report, we have encompassed all the proven models and tools of industry analysis and extensively illustrated all the key business strategies and business models adopted in the Coconut Water industry. The report provides an all-inclusive and detailed competitive landscape prevalent in the coconut water market.

The report utilizes established industry analysis tools and models such as Porter’s Five Forces framework to analyze and recognize critical business strategies adopted by various stakeholders involved in the entire value chain of the coconut water industry. The coconut water market report additionally employs SWOT analysis and PESTLE analysis models for further in-depth analysis.

The report study further includes an in-depth analysis of industry players' market shares and provides an overview of leading players' market position in the coconut water sector. Key strategic developments in the Coconut Water market competitive landscape such as acquisitions & mergers, inaugurations of different products and services, partnerships & joint ventures, MoU agreements, VC & funding activities, R&D activities, and geographic expansion among other noteworthy activities by key players of the coconut water market are appropriately highlighted in the report.

The coconut water market research report delivers an acute valuation and taxonomy of the Coconut Water industry by practically splitting the market on the basis of different variants, packaging, distribution, and regions. Through the analysis of the historical and projected trends, all the segments and sub-segments were evaluated through the bottom-up approach, and different market sizes have been projected for FY 2020 to FY 2026.

logoReport Scope

Report Attribute

Details

Market Size in 2019

USD 3 Billion

Projected Market Size in 2026

USD 10 Billion

CAGR Growth Rate

20% CAGR

Base Year

2019

Forecast Years

2020-2026

Key Market Players

Amy and Brian Naturals, COPRA Inc., Coca-Cola, Navitas Naturals, Green COCO, COCOZIACoco Libre, PepsiCo, Celebes Coconut Corporation, Vita-Coco, and Harmless Harvest., and Others

Key Segment

By Variant, Packaging, Distribution, and Region

Major Regions Covered

North America, Europe, Asia Pacific, Latin America, and the Middle East & Africa

Purchase Options

Request customized purchase options to meet your research needs.Explore purchase options

The regional segmentation of the coconut water industry includes the complete classification of all the major continents including North America, Latin America, Europe, Asia Pacific, and the Middle East & Africa. Further, country-wise data for the Coconut Water industry is provided for the leading economies of the world.

The coconut water market is segmented based on variants, packaging, and distribution. On the basis of variant segmentation, the market is classified into natural, and flavored. In terms of packaging segmentation, the market is bifurcated into paper, paperboard, metal, and plastic. Based on the distribution-based segmentation market is categorized as hypermarkets and supermarkets, convenience stores, specialty stores, and others.

logoSome of the essential players operating in the Coconut Water market, but not restricted include

  •  Amy and Brian Naturals
  •  Coca-Cola
  •  Green COCO
  •  PepsiCo
  •  Vita-Coco
  •  Harmless Harvest
  •  Celebes Coconut Corporation
  •  COCOZIACoco Libre
  •  Navitas Naturals
  •  COPRA Inc

The taxonomy of the Coconut Water industry by its scope and segmentation is as follows:

logo By Variants Segmentation Analysis

  • Natural
  • Flavoured

logo By Packaging Segmentation Analysis

  • Paper and Paperboard
  • Metal
  • Plastic

logo By Distribution Segmentation Analysis

  • Hypermarket And Supermarket
  • Convenience Stores
  • Specialty Stores
  • Others

logoBy Regional Segmentation Analysis

  • North America
    • The U.S.
    • Canada
  • Europe
    • Germany
    • The UK
    • France
    • Spain
    • Italy
    • Rest of Europe
  • Asia Pacific
    • China
    • Japan
    • India
    • South Korea
    • Southeast Asia
    • Rest of Asia Pacific
  • Latin America
    • Brazil
    • Mexico
    • Rest of Latin America
  • Middle East & Africa
    • GCC
    • South Africa
    • Rest of Middle East & Africa

Table of Content

  1. Chapter 1 Executive Summary
    1. 1.1. Introduction of Coconut Water
    2. 1.2. Global Coconut Water Market, 2019 & 2026 (USD Million)
    3. 1.3. Global Coconut Water Market, 2016 – 2026 (USD Million) (Tons)
    4. 1.4. Global Coconut Water Market Absolute Revenue Opportunity, 2016 – 2026 (USD Million)
    5. 1.5. Global Coconut Water Market Incremental Revenue Opportunity, 2020 – 2026 (USD Million)
  2. Chapter 2 Coconut Water Market – Variant Analysis
    1. 2.1. Global Coconut Water Market – Variant Overview
    2. 2.2. Global Coconut Water Market Share, by Variant, 2019 & 2026 (USD Million)
    3. 2.3. Global Coconut Water Market share, by Variant, 2019 & 2026 (Tons)
    4. 2.4. Natural
      1. 2.4.1. Global Natural Coconut Water Market, 2016 – 2026 (USD Million)
      2. 2.4.2. Global Natural Coconut Water Market, 2016 – 2026 (Tons)
    5. 2.5. Flavored
      1. 2.5.1. Global Flavored Coconut Water Market, 2016 – 2026 (USD Million)
      2. 2.5.2. Global Flavored Coconut Water Market, 2016 – 2026 (Tons)
  3. Chapter 3 Coconut Water Market – Packaging Analysis
    1. 3.1. Global Coconut Water Market – Packaging Overview
    2. 3.2. Global Coconut Water Market Share, by Packaging, 2019 & 2026 (USD Million)
    3. 3.3. Global Coconut Water Market share, by Packaging, 2019 & 2026 (Tons)
    4. 3.4. Paper Paperboard
      1. 3.4.1. Global Paper Paperboard Coconut Water Market, 2016 – 2026 (USD Million)
      2. 3.4.2. Global Paper Paperboard Coconut Water Market, 2016 – 2026 (Tons)
    5. 3.5. Metal
      1. 3.5.1. Global Metal Coconut Water Market, 2016 – 2026 (USD Million)
      2. 3.5.2. Global Metal Coconut Water Market, 2016 – 2026 (Tons)
    6. 3.6. Plastic
      1. 3.6.1. Global Plastic Coconut Water Market, 2016 – 2026 (USD Million)
      2. 3.6.2. Global Plastic Coconut Water Market, 2016 – 2026 (Tons)
  4. Chapter 4 Coconut Water Market – Distribution Analysis
    1. 4.1. Global Coconut Water Market – Distribution Overview
    2. 4.2. Global Coconut Water Market Share, by Distribution, 2019 & 2026 (USD Million)
    3. 4.3. Global Coconut Water Market share, by Distribution, 2019 & 2026 (Tons)
    4. 4.4. Hypermarket And Supermarket
      1. 4.4.1. Global Hypermarket And Supermarket Coconut Water Market, 2016 – 2026 (USD Million)
      2. 4.4.2. Global Hypermarket And Supermarket Coconut Water Market, 2016 – 2026 (Tons)
    5. 4.5. Convenience Stores
      1. 4.5.1. Global Convenience Stores Coconut Water Market, 2016 – 2026 (USD Million)
      2. 4.5.2. Global Convenience Stores Coconut Water Market, 2016 – 2026 (Tons)
    6. 4.6. Specialty Stores
      1. 4.6.1. Global Specialty Stores Coconut Water Market, 2016 – 2026 (USD Million)
      2. 4.6.2. Global Specialty Stores Coconut Water Market, 2016 – 2026 (Tons)
    7. 4.7. Others
      1. 4.7.1. Global Others Coconut Water Market, 2016 – 2026 (USD Million)
      2. 4.7.2. Global Others Coconut Water Market, 2016 – 2026 (Tons)
  5. Chapter 5 Coconut Water Market – Regional Analysis
    1. 5.1. Global Coconut Water Market Regional Overview
    2. 5.2. Global Coconut Water Market Share, by Region, 2019 & 2026 (USD Million)
    3. 5.3. Global Coconut Water Market Share, by Region, 2019 & 2026 (Tons)
    4. 5.4. North America
      1. 5.4.1. North America Coconut Water Market, 2016 – 2026 (USD Million)
        1. 5.4.1.1. North America Coconut Water Market, by Country, 2016 – 2026 (USD Million)
      2. 5.4.2. North America Market, 2016 – 2026 (Tons)
        1. 5.4.2.1. North America Coconut Water Market, by Country, 2016 – 2026 (Tons)
      3. 5.4.3. North America Coconut Water Market, by Variant, 2016 – 2026
        1. 5.4.3.1. North America Coconut Water Market, by Variant, 2016 – 2026 (USD Million)
        2. 5.4.3.2. North America Coconut Water Market, by Variant, 2016 – 2026 (Tons)
      4. 5.4.4. North America Coconut Water Market, by Packaging, 2016 – 2026
        1. 5.4.4.1. North America Coconut Water Market, by Packaging, 2016 – 2026 (USD Million)
        2. 5.4.4.2. North America Coconut Water Market, by Packaging, 2016 – 2026 (Tons)
      5. 5.4.5. North America Coconut Water Market, by Distribution, 2016 – 2026
        1. 5.4.5.1. North America Coconut Water Market, by Distribution, 2016 – 2026 (USD Million)
        2. 5.4.5.2. North America Coconut Water Market, by Distribution, 2016 – 2026 (Tons)
      6. 5.4.6. U.S.
        1. 5.4.6.1. U.S. Coconut Water Market, 2016 – 2026 (USD Million)
        2. 5.4.6.2. U.S. Coconut Water Market, 2016 – 2026 (Tons)
      7. 5.4.7. Canada
        1. 5.4.7.1. Canada Coconut Water Market, 2016 – 2026 (USD Million)
        2. 5.4.7.2. Canada Coconut Water Market, 2016 – 2026 (Tons)
    5. 5.5. Europe
      1. 5.5.1. Europe Coconut Water Market, 2016 – 2026 (USD Million)
        1. 5.5.1.1. Europe Coconut Water Market, by Country, 2016 – 2026 (USD Million)
      2. 5.5.2. Europe Market, 2016 – 2026 (Tons)
        1. 5.5.2.1. Europe Coconut Water Market, by Country, 2016 – 2026 (Tons)
      3. 5.5.3. Europe Coconut Water Market, by Variant, 2016 – 2026
        1. 5.5.3.1. Europe Coconut Water Market, by Variant, 2016 – 2026 (USD Million)
        2. 5.5.3.2. Europe Coconut Water Market, by Variant, 2016 – 2026 (Tons)
      4. 5.5.4. Europe Coconut Water Market, by Packaging, 2016 – 2026
        1. 5.5.4.1. Europe Coconut Water Market, by Packaging, 2016 – 2026 (USD Million)
        2. 5.5.4.2. Europe Coconut Water Market, by Packaging, 2016 – 2026 (Tons)
      5. 5.5.5. Europe Coconut Water Market, by Distribution, 2016 – 2026
        1. 5.5.5.1. Europe Coconut Water Market, by Distribution, 2016 – 2026 (USD Million)
        2. 5.5.5.2. Europe Coconut Water Market, by Distribution, 2016 – 2026 (Tons)
      6. 5.5.6. Germany
        1. 5.5.6.1. Germany Coconut Water Market, 2016 – 2026 (USD Million)
        2. 5.5.6.2. Germany Coconut Water Market, 2016 – 2026 (Tons)
      7. 5.5.7. France
        1. 5.5.7.1. France Coconut Water Market, 2016 – 2026 (USD Million)
        2. 5.5.7.2. France Coconut Water Market, 2016 – 2026 (Tons)
      8. 5.5.8. U.K.
        1. 5.5.8.1. U.K. Coconut Water Market, 2016 – 2026 (USD Million)
        2. 5.5.8.2. U.K. Coconut Water Market, 2016 – 2026 (Tons)
      9. 5.5.9. Italy
        1. 5.5.9.1. Italy Coconut Water Market, 2016 – 2026 (USD Million)
        2. 5.5.9.2. Italy Coconut Water Market, 2016 – 2026 (Tons)
      10. 5.5.10. Spain
        1. 5.5.10.1. Spain Coconut Water Market, 2016 – 2026 (USD Million)
        2. 5.5.10.2. Spain Coconut Water Market, 2016 – 2026 (Tons)
      11. 5.5.11. Rest of Europe
        1. 5.5.11.1. Rest of Europe Coconut Water Market, 2016 – 2026 (USD Million)
        2. 5.5.11.2. Rest of Europe Coconut Water Market, 2016 – 2026 (Tons)
    6. 5.6. Asia Pacific
      1. 5.6.1. Asia Pacific Coconut Water Market, 2016 – 2026 (USD Million)
        1. 5.6.1.1. Asia Pacific Coconut Water Market, by Country, 2016 – 2026 (USD Million)
      2. 5.6.2. Asia Pacific Market, 2016 – 2026 (Tons)
        1. 5.6.2.1. Asia Pacific Coconut Water Market, by Country, 2016 – 2026 (Tons)
      3. 5.6.3. Asia Pacific Coconut Water Market, by Variant, 2016 – 2026
        1. 5.6.3.1. Asia Pacific Coconut Water Market, by Variant, 2016 – 2026 (USD Million)
        2. 5.6.3.2. Asia Pacific Coconut Water Market, by Variant, 2016 – 2026 (Tons)
      4. 5.6.4. Asia Pacific Coconut Water Market, by Packaging, 2016 – 2026
        1. 5.6.4.1. Asia Pacific Coconut Water Market, by Packaging, 2016 – 2026 (USD Million)
        2. 5.6.4.2. Asia Pacific Coconut Water Market, by Packaging, 2016 – 2026 (Tons)
      5. 5.6.5. Asia Pacific Coconut Water Market, by Distribution, 2016 – 2026
        1. 5.6.5.1. Asia Pacific Coconut Water Market, by Distribution, 2016 – 2026 (USD Million)
        2. 5.6.5.2. Asia Pacific Coconut Water Market, by Distribution, 2016 – 2026 (Tons)
      6. 5.6.6. China
        1. 5.6.6.1. China Coconut Water Market, 2016 – 2026 (USD Million)
        2. 5.6.6.2. China Coconut Water Market, 2016 – 2026 (Tons)
      7. 5.6.7. Japan
        1. 5.6.7.1. Japan Coconut Water Market, 2016 – 2026 (USD Million)
        2. 5.6.7.2. Japan Coconut Water Market, 2016 – 2026 (Tons)
      8. 5.6.8. India
        1. 5.6.8.1. India Coconut Water Market, 2016 – 2026 (USD Million)
        2. 5.6.8.2. India Coconut Water Market, 2016 – 2026 (Tons)
      9. 5.6.9. South Korea
        1. 5.6.9.1. South Korea Coconut Water Market, 2016 – 2026 (USD Million)
        2. 5.6.9.2. South Korea Coconut Water Market, 2016 – 2026 (Tons)
      10. 5.6.10. South-East Asia
        1. 5.6.10.1. South-East Asia Coconut Water Market, 2016 – 2026 (USD Million)
        2. 5.6.10.2. South-East Asia Coconut Water Market, 2016 – 2026 (Tons)
      11. 5.6.11. Rest of Asia Pacific
        1. 5.6.11.1. Rest of Asia Pacific Coconut Water Market, 2016 – 2026 (USD Million)
        2. 5.6.11.2. Rest of Asia Pacific Coconut Water Market, 2016 – 2026 (Tons)
    7. 5.7. Latin America
      1. 5.7.1. Latin America Coconut Water Market, 2016 – 2026 (USD Million)
        1. 5.7.1.1. Latin America Coconut Water Market, by Country, 2016 – 2026 (USD Million)
      2. 5.7.2. Latin America Market, 2016 – 2026 (Tons)
        1. 5.7.2.1. Latin America Coconut Water Market, by Country, 2016 – 2026 (Tons)
      3. 5.7.3. Latin America Coconut Water Market, by Variant, 2016 – 2026
        1. 5.7.3.1. Latin America Coconut Water Market, by Variant, 2016 – 2026 (USD Million)
        2. 5.7.3.2. Latin America Coconut Water Market, by Variant, 2016 – 2026 (Tons)
      4. 5.7.4. Latin America Coconut Water Market, by Packaging, 2016 – 2026
        1. 5.7.4.1. Latin America Coconut Water Market, by Packaging, 2016 – 2026 (USD Million)
        2. 5.7.4.2. Latin America Coconut Water Market, by Packaging, 2016 – 2026 (Tons)
      5. 5.7.5. Latin America Coconut Water Market, by Distribution, 2016 – 2026
        1. 5.7.5.1. Latin America Coconut Water Market, by Distribution, 2016 – 2026 (USD Million)
        2. 5.7.5.2. Latin America Coconut Water Market, by Distribution, 2016 – 2026 (Tons)
      6. 5.7.6. Brazil
        1. 5.7.6.1. Brazil Coconut Water Market, 2016 – 2026 (USD Million)
        2. 5.7.6.2. Brazil Coconut Water Market, 2016 – 2026 (Tons)
      7. 5.7.7. Mexico
        1. 5.7.7.1. Mexico Coconut Water Market, 2016 – 2026 (USD Million)
        2. 5.7.7.2. Mexico Coconut Water Market, 2016 – 2026 (Tons)
      8. 5.7.8. Rest of Latin America
        1. 5.7.8.1. Rest of Latin America Coconut Water Market, 2016 – 2026 (USD Million)
        2. 5.7.8.2. Rest of Latin America Coconut Water Market, 2016 – 2026 (Tons)
    8. 5.8. The Middle-East and Africa
      1. 5.8.1. The Middle-East and Africa Coconut Water Market, 2016 – 2026 (USD Million)
        1. 5.8.1.1. The Middle-East and Africa Coconut Water Market, by Country, 2016 – 2026 (USD Million)
      2. 5.8.2. The Middle-East and Africa Market, 2016 – 2026 (Tons)
        1. 5.8.2.1. The Middle-East and Africa Coconut Water Market, by Country, 2016 – 2026 (Tons)
      3. 5.8.3. The Middle-East and Africa Coconut Water Market, by Variant, 2016 – 2026
        1. 5.8.3.1. The Middle-East and Africa Coconut Water Market, by Variant, 2016 – 2026 (USD Million)
        2. 5.8.3.2. The Middle-East and Africa Coconut Water Market, by Variant, 2016 – 2026 (Tons)
      4. 5.8.4. The Middle-East and Africa Coconut Water Market, by Packaging, 2016 – 2026
        1. 5.8.4.1. The Middle-East and Africa Coconut Water Market, by Packaging, 2016 – 2026 (USD Million)
        2. 5.8.4.2. The Middle-East and Africa Coconut Water Market, by Packaging, 2016 – 2026 (Tons)
      5. 5.8.5. The Middle-East and Africa Coconut Water Market, by Distribution, 2016 – 2026
        1. 5.8.5.1. The Middle-East and Africa Coconut Water Market, by Distribution, 2016 – 2026 (USD Million)
        2. 5.8.5.2. The Middle-East and Africa Coconut Water Market, by Distribution, 2016 – 2026 (Tons)
      6. 5.8.6. GCC Countries
        1. 5.8.6.1. GCC Countries Coconut Water Market, 2016 – 2026 (USD Million)
        2. 5.8.6.2. GCC Countries Coconut Water Market, 2016 – 2026 (Tons)
      7. 5.8.7. South Africa
        1. 5.8.7.1. South Africa Coconut Water Market, 2016 – 2026 (USD Million)
        2. 5.8.7.2. South Africa Coconut Water Market, 2016 – 2026 (Tons)
      8. 5.8.8. Rest of Middle-East Africa
        1. 5.8.8.1. Rest of Middle-East Africa Coconut Water Market, 2016 – 2026 (USD Million)
        2. 5.8.8.2. Rest of Middle-East Africa Coconut Water Market, 2016 – 2026 (Tons)
  6. Chapter 6 Coconut Water Production, Consumption, Export, Import by Regions
    1. 6.1. Global Coconut Water Production and Consumption, 2016 – 2026 (Tons)
    2. 6.2. Global Import and Export Analysis, by Region
  7. Chapter 7 Coconut Water Market – Competitive Landscape
    1. 7.1. Competitor Market Share – Revenue
    2. 7.2. Market Concentration Rate Analysis, Top 3 and Top 5 Players
    3. 7.3. Competitor Market Share – Volume
    4. 7.4. Strategic Developments
      1. 7.4.1. Acquisitions and Mergers
      2. 7.4.2. New Products
      3. 7.4.3. Research & Development Activities
  8. Chapter 8 Company Profiles
    1. 8.1. Amy and Brian Naturals
      1. 8.1.1. Company Overview
      2. 8.1.2. Product/Service Portfolio
      3. 8.1.3. Amy and Brian Naturals Sales, Revenue, Price, and Gross Margin
      4. 8.1.4. Amy and Brian Naturals Revenue and Growth Rate
      5. 8.1.5. Amy and Brian Naturals Market Share
      6. 8.1.6. Recent Initiatives, Funding/VC Activities, and Technological Innovations
    2. 8.2. Coca-Cola
      1. 8.2.1. Company Overview
      2. 8.2.2. Product/Service Portfolio
      3. 8.2.3. Coca-Cola Sales, Revenue, Price, and Gross Margin
      4. 8.2.4. Coca-Cola Revenue and Growth Rate
      5. 8.2.5. Coca-Cola Market Share
      6. 8.2.6. Recent Initiatives, Funding/VC Activities, and Technological Innovations
    3. 8.3. Green COCO
      1. 8.3.1. Company Overview
      2. 8.3.2. Product/Service Portfolio
      3. 8.3.3. Green COCO Sales, Revenue, Price, and Gross Margin
      4. 8.3.4. Green COCO Revenue and Growth Rate
      5. 8.3.5. Green COCO Market Share
      6. 8.3.6. Recent Initiatives, Funding/VC Activities, and Technological Innovations
    4. 8.4. PepsiCo
      1. 8.4.1. Company Overview
      2. 8.4.2. Product/Service Portfolio
      3. 8.4.3. PepsiCo Sales, Revenue, Price, and Gross Margin
      4. 8.4.4. PepsiCo Revenue and Growth Rate
      5. 8.4.5. PepsiCo Market Share
      6. 8.4.6. Recent Initiatives, Funding/VC Activities, and Technological Innovations
    5. 8.5. Vita-Coco
      1. 8.5.1. Company Overview
      2. 8.5.2. Product/Service Portfolio
      3. 8.5.3. Vita-Coco Sales, Revenue, Price, and Gross Margin
      4. 8.5.4. Vita-Coco Revenue and Growth Rate
      5. 8.5.5. Vita-Coco Market Share
      6. 8.5.6. Recent Initiatives, Funding/VC Activities, and Technological Innovations
    6. 8.6. Harmless Harvest
      1. 8.6.1. Company Overview
      2. 8.6.2. Product/Service Portfolio
      3. 8.6.3. Harmless Harvest Sales, Revenue, Price, and Gross Margin
      4. 8.6.4. Harmless Harvest Revenue and Growth Rate
      5. 8.6.5. Harmless Harvest Market Share
      6. 8.6.6. Recent Initiatives, Funding/VC Activities, and Technological Innovations
    7. 8.7. Celebes Coconut Corporation
      1. 8.7.1. Company Overview
      2. 8.7.2. Product/Service Portfolio
      3. 8.7.3. Celebes Coconut Corporation Sales, Revenue, Price, and Gross Margin
      4. 8.7.4. Celebes Coconut Corporation Revenue and Growth Rate
      5. 8.7.5. Celebes Coconut Corporation Market Share
      6. 8.7.6. Recent Initiatives, Funding/VC Activities, and Technological Innovations
    8. 8.8. COCOZIACoco Libre
      1. 8.8.1. Company Overview
      2. 8.8.2. Product/Service Portfolio
      3. 8.8.3. COCOZIACoco Libre Sales, Revenue, Price, and Gross Margin
      4. 8.8.4. COCOZIACoco Libre Revenue and Growth Rate
      5. 8.8.5. COCOZIACoco Libre Market Share
      6. 8.8.6. Recent Initiatives, Funding/VC Activities, and Technological Innovations
    9. 8.9. Navitas Naturals
      1. 8.9.1. Company Overview
      2. 8.9.2. Product/Service Portfolio
      3. 8.9.3. Navitas Naturals Sales, Revenue, Price, and Gross Margin
      4. 8.9.4. Navitas Naturals Revenue and Growth Rate
      5. 8.9.5. Navitas Naturals Market Share
      6. 8.9.6. Recent Initiatives, Funding/VC Activities, and Technological Innovations
    10. 8.10. COPRA Inc.
      1. 8.10.1. Company Overview
      2. 8.10.2. Product/Service Portfolio
      3. 8.10.3. COPRA Inc. Sales, Revenue, Price, and Gross Margin
      4. 8.10.4. COPRA Inc. Revenue and Growth Rate
      5. 8.10.5. COPRA Inc. Market Share
      6. 8.10.6. Recent Initiatives, Funding/VC Activities, and Technological Innovations
  9. Chapter 9 Coconut Water — Industry Analysis
    1. 9.1. Introduction and Taxonomy
    2. 9.2. Coconut Water Market – Key Trends
      1. 9.2.1. Market Drivers
      2. 9.2.2. Market Restraints
      3. 9.2.3. Market Opportunities
    3. 9.3. Value Chain Analysis
    4. 9.4. Key Mandates and Regulations
    5. 9.5. Technology Roadmap and Timeline
    6. 9.6. Coconut Water Market – Attractiveness Analysis
      1. 9.6.1. By Variant
      2. 9.6.2. By Packaging
      3. 9.6.3. By Distribution
      4. 9.6.4. By Region
  10. Chapter 10 Raw Material Analysis
    1. 10.1. Coconut Water Key Raw Material Analysis
      1. 10.1.1. Key Raw Materials
      2. 10.1.2. Price Trend of Key Raw Materials
    2. 10.2. Key Suppliers of Raw Materials
    3. 10.3. Proportion of Manufacturing Cost Structure
      1. 10.3.1. Raw Materials Cost
      2. 10.3.2. Labor Cost
      3. 10.3.3. Manufacturing Expenses
      4. 10.3.4. Miscellaneous Expenses
    4. 10.4. Manufacturing Cost Analysis of Coconut Water
  11. Chapter 11 Industrial Chain, Sourcing Strategy, and Downstream Buyers
    1. 11.1. Coconut Water Industrial Chain Analysis
    2. 11.2. Upstream Raw Materials Sourcing
      1. 11.2.1. Risk Mitigation:
      2. 11.2.2. Supplier Relationships:
      3. 11.2.3. Business Processes:
      4. 11.2.4. Securing the Product:
    3. 11.3. Raw Materials Sources of Coconut Water Major Manufacturers
    4. 11.4. Downstream Buyers
    5. 11.5. Distributors/Traders List
  12. Chapter 12 Marketing Strategy Analysis, Distributors
    1. 12.1. Marketing Channel
    2. 12.2. Direct Marketing
    3. 12.3. Indirect Marketing
    4. 12.4. Marketing Channel Development Trends
    5. 12.5. Economic/Political Environmental Change
  13. Chapter 13 Report Conclusion & Key Insights
    1. 13.1. Key Insights from Primary Interviews & Surveys Respondents
    2. 13.2. Key Takeaways from Analysts, Consultants, and Industry Leaders
  14. Chapter 14 Research Approach & Methodology
    1. 14.1. Report Description
    2. 14.2. Research Scope
    3. 14.3. Research Methodology
      1. 14.3.1. Secondary Research
      2. 14.3.2. Primary Research
      3. 14.3.3. Statistical Models
        1. 14.3.3.1. Company Share Analysis Model
        2. 14.3.3.2. Revenue Based Modeling
      4. 14.3.4. Research Limitations

      List of Figures

      Fig.1 Product Picture of Coconut Water
      Fig.2 Global Coconut Water Market, 2016 – 2026 (USD Million)
      Fig.3 Global Coconut Water Market, 2016 – 2026 (Tons)
      Fig.4 Global Coconut Water Market Absolute Revenue Opportunity, 2016 – 2026 (USD Million)
      Fig.5 Global Coconut Water Market Incremental Revenue Opportunity, 2020 – 2026 (USD Million)
      Fig.6 Global Coconut Water Market Share, by Variant, 2019 & 2026 (USD Million)
      Fig.7 Global Coconut Water Market Share, by Variant, 2019 & 2026 (Tons)
      Fig.8 Global Natural Coconut Water Market, 2016 – 2026 (USD Million)
      Fig.9 Global Natural Coconut Water Market, 2016 – 2026 (Tons)
      Fig.10 Global  Flavored Coconut Water Market, 2016 – 2026 (USD Million)
      Fig.11 Global  Flavored Coconut Water Market, 2016 – 2026 (Tons)
      Fig.12 Global Coconut Water Market Share, by Packaging, 2019 & 2026 (USD Million)
      Fig.13 Global Coconut Water Market Share, by Packaging, 2019 & 2026 (Tons)
      Fig.14 Global Paper Paperboard Coconut Water Market, 2016 – 2026 (USD Million)
      Fig.15 Global Paper Paperboard Coconut Water Market, 2016 – 2026 (Tons)
      Fig.16 Global Metal Coconut Water Market, 2016 – 2026 (USD Million)
      Fig.17 Global Metal Coconut Water Market, 2016 – 2026 (Tons)
      Fig.18 Global Plastic Coconut Water Market, 2016 – 2026 (USD Million)
      Fig.19 Global Plastic Coconut Water Market, 2016 – 2026 (Tons)
      Fig.20 Global Coconut Water Market Share, by  Distribution, 2019 & 2026 (USD Million)
      Fig.21 Global Coconut Water Market Share, by  Distribution, 2019 & 2026 (Tons)
      Fig.22 Global Hypermarket And Supermarket Coconut Water Market, 2016 – 2026 (USD Million)
      Fig.23 Global Hypermarket And Supermarket Coconut Water Market, 2016 – 2026 (Tons)
      Fig.24 Global Convenience Stores Coconut Water Market, 2016 – 2026 (USD Million)
      Fig.25 Global Convenience Stores Coconut Water Market, 2016 – 2026 (Tons)
      Fig.26 Global Specialty Stores Coconut Water Market, 2016 – 2026 (USD Million)
      Fig.27 Global Specialty Stores Coconut Water Market, 2016 – 2026 (Tons)
      Fig.28 Global Others Coconut Water Market, 2016 – 2026 (USD Million)
      Fig.29 Global Others Coconut Water Market, 2016 – 2026 (Tons)
      Fig.30 Global Coconut Water Market Share, by Region, 2019 & 2026 (USD Million)
      Fig.31 Global Coconut Water Market Share, by Region, 2019 & 2026 (Tons)
      Fig.32 North America Coconut Water Market, 2016 – 2026 (USD Million)
      Fig.33 North America Coconut Water Market, 2016 – 2026 (Tons)
      Fig.34 U.S. Coconut Water Market, 2016 – 2026 (USD Million)
      Fig.35 U.S. Coconut Water  Market, 2016 – 2026 (Tons)
      Fig.36 Canada Coconut Water Market, 2016 – 2026 (USD Million)
      Fig.37 Canada Coconut Water  Market, 2016 – 2026 (Tons)
      Fig.38 Europe Coconut Water Market, 2016 – 2026 (USD Million)
      Fig.39 Europe Coconut Water Market, 2016 – 2026 (Tons)
      Fig.40 Germany Coconut Water Market, 2016 – 2026 (USD Million)
      Fig.41 Germany Coconut Water  Market, 2016 – 2026 (Tons)
      Fig.42 France Coconut Water Market, 2016 – 2026 (USD Million)
      Fig.43 France Coconut Water  Market, 2016 – 2026 (Tons)
      Fig.44 U.K. Coconut Water Market, 2016 – 2026 (USD Million)
      Fig.45 U.K. Coconut Water  Market, 2016 – 2026 (Tons)
      Fig.46 Italy Coconut Water Market, 2016 – 2026 (USD Million)
      Fig.47 Italy Coconut Water  Market, 2016 – 2026 (Tons)
      Fig.48 Spain Coconut Water Market, 2016 – 2026 (USD Million)
      Fig.49 Spain Coconut Water  Market, 2016 – 2026 (Tons)
      Fig.50 Rest of Europe Coconut Water Market, 2016 – 2026 (USD Million)
      Fig.51 Rest of Europe Coconut Water  Market, 2016 – 2026 (Tons)
      Fig.52 Asia Pacific Coconut Water Market, 2016 – 2026 (USD Million)
      Fig.53 Asia Pacific Coconut Water Market, 2016 – 2026 (Tons)
      Fig.54 China Coconut Water Market, 2016 – 2026 (USD Million)
      Fig.55 China Coconut Water  Market, 2016 – 2026 (Tons)
      Fig.56 Japan Coconut Water Market, 2016 – 2026 (USD Million)
      Fig.57 Japan Coconut Water  Market, 2016 – 2026 (Tons)
      Fig.58 India Coconut Water Market, 2016 – 2026 (USD Million)
      Fig.59 India Coconut Water  Market, 2016 – 2026 (Tons)
      Fig.60 South  Korea Coconut Water Market, 2016 – 2026 (USD Million)
      Fig.61 South  Korea Coconut Water  Market, 2016 – 2026 (Tons)
      Fig.62 South-East Asia Coconut Water Market, 2016 – 2026 (USD Million)
      Fig.63 South-East Asia Coconut Water  Market, 2016 – 2026 (Tons)
      Fig.64 Rest of Asia Pacific Coconut Water Market, 2016 – 2026 (USD Million)
      Fig.65 Rest of Asia Pacific Coconut Water  Market, 2016 – 2026 (Tons)
      Fig.66 Latin America Coconut Water Market, 2016 – 2026 (USD Million)
      Fig.67 Latin America Coconut Water Market, 2016 – 2026 (Tons)
      Fig.68 Brazil Coconut Water Market, 2016 – 2026 (USD Million)
      Fig.69 Brazil Coconut Water  Market, 2016 – 2026 (Tons)
      Fig.70 Mexico Coconut Water Market, 2016 – 2026 (USD Million)
      Fig.71 Mexico Coconut Water  Market, 2016 – 2026 (Tons)
      Fig.72 Rest of Latin America Coconut Water Market, 2016 – 2026 (USD Million)
      Fig.73 Rest of Latin America Coconut Water  Market, 2016 – 2026 (Tons)
      Fig.74 The Middle-East and Africa Coconut Water Market, 2016 – 2026 (USD Million)
      Fig.75 The Middle-East and Africa Coconut Water Market, 2016 – 2026 (Tons)
      Fig.76 GCC Countries Coconut Water Market, 2016 – 2026 (USD Million)
      Fig.77 GCC Countries Coconut Water  Market, 2016 – 2026 (Tons)
      Fig.78 South Africa Coconut Water Market, 2016 – 2026 (USD Million)
      Fig.79 South Africa Coconut Water  Market, 2016 – 2026 (Tons)
      Fig.80 Rest of Middle-East Africa Coconut Water Market, 2016 – 2026 (USD Million)
      Fig.81 Rest of Middle-East Africa Coconut Water  Market, 2016 – 2026 (Tons)
      Fig.82 Global Coconut Water Production and Consumption, 2016 – 2026 (Tons)
      Fig.83 North America Coconut Water Production and Consumption, 2016 – 2026 (USD Million) (Tons)
      Fig.84 Europe Coconut Water Production and Consumption, 2016 – 2026 (USD Million) (Tons)
      Fig.85 Asia Pacific Coconut Water Production and Consumption, 2016 – 2026 (USD Million) (Tons)
      Fig.86 Latin America Coconut Water Production and Consumption, 2016 – 2026 (USD Million) (Tons)
      Fig.87 The Middle-East and Africa Coconut Water Production and Consumption, 2016 – 2026 (USD Million) (Tons)
      Fig.88 Competitor Market Share – Revenue
      Fig.89 Competitor Market Share – Volume
      Fig.90 Amy and Brian Naturals Revenue and Growth Rate
      Fig.91 Amy and Brian Naturals Market Share
      Fig.92 Coca-Cola Revenue and Growth Rate
      Fig.93 Coca-Cola Market Share
      Fig.94 Green COCO Revenue and Growth Rate
      Fig.95 Green COCO Market Share
      Fig.96 PepsiCo Revenue and Growth Rate
      Fig.97 PepsiCo Market Share
      Fig.98 Vita-Coco Revenue and Growth Rate
      Fig.99 Vita-Coco Market Share
      Fig.100 Harmless Harvest Revenue and Growth Rate
      Fig.101 Harmless Harvest Market Share
      Fig.102 Celebes Coconut Corporation Revenue and Growth Rate
      Fig.103 Celebes Coconut Corporation Market Share
      Fig.104 COCOZIACoco Libre Revenue and Growth Rate
      Fig.105 COCOZIACoco Libre Market Share
      Fig.106 Navitas Naturals Revenue and Growth Rate
      Fig.107 Navitas Naturals Market Share
      Fig.108 COPRA Inc. Revenue and Growth Rate
      Fig.109 COPRA Inc. Market Share
      Fig.110 Market Dynamics
      Fig.111 Global Coconut Water – Value Chain Analysis
      Fig.112 Key Mandates and Regulations
      Fig.113 Technology Roadmap and Timeline
      Fig.114 Market Attractiveness Analysis – By Variant
      Fig.115 Market Attractiveness Analysis – By Packaging
      Fig.116 Market Attractiveness Analysis – By  Distribution
      Fig.117 Market Attractiveness Analysis – By Region
      Fig.118 Manufacturing Cost Structure of Coconut Water
      Fig.119 Coconut Water Industrial Chain Analysis
      Fig.120 Market Channels
      Fig.121 Marketing Channel Development Trend
      Fig.122 Growth in World Gross Product, 2008-2018
      

      List of Tables

      Table 1 Global Coconut Water Market, 2019 & 2026 (USD Million)
      Table 2 Global Coconut Water Market, by Variant, 2016 – 2026 (USD Million)
      Table 3 Global Coconut Water Market, by Variant, 2016 – 2026 (Tons)
      Table 4 Global Coconut Water Market, by Packaging, 2016 – 2026 (USD Million)
      Table 5 Global Coconut Water Market, by Packaging, 2016 – 2026 (Tons)
      Table 6 Global Coconut Water Market, by  Distribution, 2016 – 2026 (USD Million)
      Table 7 Global Coconut Water Market, by  Distribution, 2016 – 2026 (Tons)
      Table 8 Global Coconut Water Market, by Region, 2016 – 2026 (USD Million)
      Table 9 Global Coconut Water Market, by Region, 2016 – 2026 (Tons)
      Table 10 North America Coconut Water Market, by Country, 2016 – 2026 (USD Million)
      Table 11 North America Coconut Water Market, by Country, 2016 – 2026 (Tons)
      Table 12 North America Coconut Water Market, by Variant, 2016 – 2026 (USD Million)
      Table 13 North America Coconut Water Market, by Variant, 2016 – 2026 (Tons)
      Table 14 North America Coconut Water Market, by Packaging, 2016 – 2026 (USD Million)
      Table 15 North America Coconut Water Market, by Packaging, 2016 – 2026 (Tons)
      Table 16 North America Coconut Water Market, by  Distribution, 2016 – 2026 (USD Million)
      Table 17 North America Coconut Water Market, by  Distribution, 2016 – 2026 (Tons)
      Table 18 Europe Coconut Water Market, by Country, 2016 – 2026 (USD Million)
      Table 19 Europe Coconut Water Market, by Country, 2016 – 2026 (Tons)
      Table 20 Europe Coconut Water Market, by Variant, 2016 – 2026 (USD Million)
      Table 21 Europe Coconut Water Market, by Variant, 2016 – 2026 (Tons)
      Table 22 Europe Coconut Water Market, by Packaging, 2016 – 2026 (USD Million)
      Table 23 Europe Coconut Water Market, by Packaging, 2016 – 2026 (Tons)
      Table 24 Europe Coconut Water Market, by  Distribution, 2016 – 2026 (USD Million)
      Table 25 Europe Coconut Water Market, by  Distribution, 2016 – 2026 (Tons)
      Table 26 Asia Pacific Coconut Water Market, by Country, 2016 – 2026 (USD Million)
      Table 27 Asia Pacific Coconut Water Market, by Country, 2016 – 2026 (Tons)
      Table 28 Asia Pacific Coconut Water Market, by Variant, 2016 – 2026 (USD Million)
      Table 29 Asia Pacific Coconut Water Market, by Variant, 2016 – 2026 (Tons)
      Table 30 Asia Pacific Coconut Water Market, by Packaging, 2016 – 2026 (USD Million)
      Table 31 Asia Pacific Coconut Water Market, by Packaging, 2016 – 2026 (Tons)
      Table 32 Asia Pacific Coconut Water Market, by  Distribution, 2016 – 2026 (USD Million)
      Table 33 Asia Pacific Coconut Water Market, by  Distribution, 2016 – 2026 (Tons)
      Table 34 Latin America Coconut Water Market, by Country, 2016 – 2026 (USD Million)
      Table 35 Latin America Coconut Water Market, by Country, 2016 – 2026 (Tons)
      Table 36 Latin America Coconut Water Market, by Variant, 2016 – 2026 (USD Million)
      Table 37 Latin America Coconut Water Market, by Variant, 2016 – 2026 (Tons)
      Table 38 Latin America Coconut Water Market, by Packaging, 2016 – 2026 (USD Million)
      Table 39 Latin America Coconut Water Market, by Packaging, 2016 – 2026 (Tons)
      Table 40 Latin America Coconut Water Market, by  Distribution, 2016 – 2026 (USD Million)
      Table 41 Latin America Coconut Water Market, by  Distribution, 2016 – 2026 (Tons)
      Table 42 The Middle-East and Africa Coconut Water Market, by Country, 2016 – 2026 (USD Million)
      Table 43 The Middle-East and Africa Coconut Water Market, by Country, 2016 – 2026 (Tons)
      Table 44 The Middle-East and Africa Coconut Water Market, by Variant, 2016 – 2026 (USD Million)
      Table 45 The Middle-East and Africa Coconut Water Market, by Variant, 2016 – 2026 (Tons)
      Table 46 The Middle-East and Africa Coconut Water Market, by Packaging, 2016 – 2026 (USD Million)
      Table 47 The Middle-East and Africa Coconut Water Market, by Packaging, 2016 – 2026 (Tons)
      Table 48 The Middle-East and Africa Coconut Water Market, by  Distribution, 2016 – 2026 (USD Million)
      Table 49 The Middle-East and Africa Coconut Water Market, by  Distribution, 2016 – 2026 (Tons)
      Table 50 North America Coconut Water Production, Consumption, Export, Import, 2016 – 2019
      Table 51 Europe Coconut Water Production, Consumption, Export, Import, 2016 – 2019
      Table 52 Asia Pacific Coconut Water Production, Consumption, Export, Import, 2016 – 2019
      Table 53 Latin America Coconut Water Production, Consumption, Export, Import, 2016 – 2019
      Table 54 The Middle-East and Africa Coconut Water Production, Consumption, Export, Import, 2016 – 2019
      Table 55 Global Coconut Water Market - Company Revenue Analysis, 2016 – 2019 (USD Million)
      Table 56 Global Coconut Water Market - Company Revenue Share Analysis, 2016 – 2019 (%)
      Table 57 Global Coconut Water Market - Company Volume Analysis, 2016 – 2019 (Tons)
      Table 58 Global Coconut Water Market - Company Volume Share Analysis, 2016 – 2019 (%)
      Table 59 Acquisitions and Mergers
      Table 60 Market Drivers – Impact Analysis
      Table 61 Market Restraints
      Table 62 Market Opportunities
      Table 63 Production Base and Market Concentration Rate of Raw Material
      Table 64 Key Suppliers of Raw Materials
      Table 65 Raw Materials Sources of Coconut Water Major Manufacturers
      Table 66 Major Buyers of Coconut Water
      Table 67 Distributors/Traders of Coconut Water by Region
      

Industry Major Market Players

  •  Amy and Brian Naturals
  •  Coca-Cola
  •  Green COCO
  •  PepsiCo
  •  Vita-Coco
  •  Harmless Harvest
  •  Celebes Coconut Corporation
  •  COCOZIACoco Libre
  •  Navitas Naturals
  •  COPRA Inc